
Abstract
Aim: To develop a reliable method for whole genome analysis of DNA methylation. Materials & methods: Genome-scale analysis of DNA methylation includes affinity-based approaches such as enrichment using methyl-CpG-binding proteins. One of these methods, the methylated-CpG island recovery assay (MIRA), is based on the high affinity of the MBD2b-MBD3L1 complex for CpG-methylated DNA. Here we provide a detailed description of MIRA and combine it with next generation sequencing platforms (MIRA-seq). Results: We assessed the performance of MIRA-seq and compared the data with whole genome bisulfite sequencing. Conclusion: MIRA-seq is a reliable, genome-scale DNA methylation analysis platform for scoring DNA methylation differences at CpG-rich genomic regions. The method is not limited by primer or probe design and is cost effective.
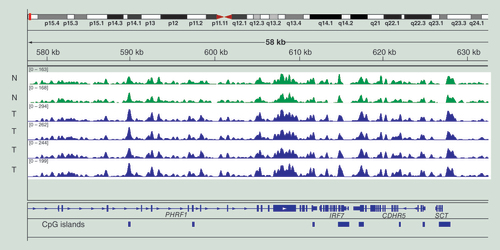
Data are for two samples of normal melanocytes from different individuals (N, green, at the top) and four melanoma tumors (T, blue, at the bottom). The data are displayed in the Integrative Genomics Viewer. An area of the short arm of chromosome 11 near the end of the chromosome is shown.
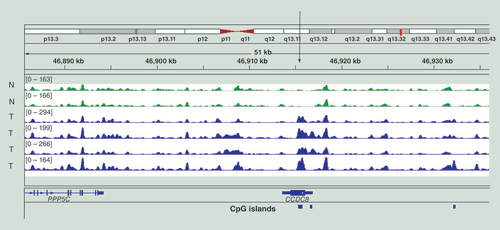
Data are for two samples of normal melanocytes (N, green) and four melanoma tumors (T, blue). The data are displayed in the Integrative Genomics Viewer and an area of chromosome 19 is shown. The vertical arrow points to the gene CCDC8, which becomes methylated in the gene body in melanoma.
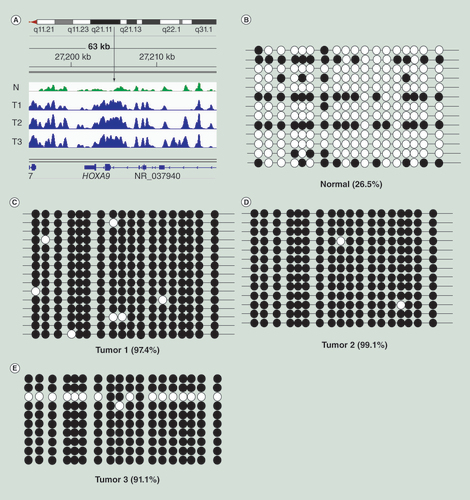
(A) MIRA-seq was performed on DNA from normal melanocytes (N, green) and three melanoma samples (T1, T2, T3, blue). The vertical arrow indicates the region of the HOXA9 gene analyzed by bisulfite sequencing. (B) Bisulfite sequence data for normal melanocytes. (C–E) Bisulfite sequence data for three melanoma tumors. Open circles: unmethylated CpG sequences; black circles: methylated CpG sequences. The percentages indicate percentage of methylated CpGs.
(A) The percentages of MIRA-seq read fractions were plotted against the smoothed BS methylation degree for 500-bp windows and compared with the fraction of methylated bins calculated from Lister et al. [Citation5] and the fraction of CpG density. (B) Using MIRA-seq and bisulfite sequencing, methylation levels were compared along genes.
BS: Bisulfite; MIRA: Methylated-CpG island recovery assay; TSS: Transcription start site.
![Figure 5. Whole genome comparison between bisulfite sequencing and MIRA-seq for IMR90 cells. (A) The percentages of MIRA-seq read fractions were plotted against the smoothed BS methylation degree for 500-bp windows and compared with the fraction of methylated bins calculated from Lister et al. [Citation5] and the fraction of CpG density. (B) Using MIRA-seq and bisulfite sequencing, methylation levels were compared along genes.BS: Bisulfite; MIRA: Methylated-CpG island recovery assay; TSS: Transcription start site.](/cms/asset/6c80afb1-90c1-43d1-a4b1-19a87044411d/iepi_a_12324998_f0005.jpg)
We obtained the MIRA-seq data from IMR90 cells; the bisulfite sequencing data were downloaded from [Citation5]. The window size for both approaches was 500 bp. (A)HOXB cluster region. Note the lower signal intensity of MIRA-seq compared with bisulfite sequencing for regions with low GC content (left side of sequence region). (B) HOXC cluster region.
BS: Bisulfite; MIRA: Methylated-CpG island recovery assay.
![Figure 6. Snaphots from the University of California Santa Cruz genome browser showing data for MIRA-seq in comparison to bisulfite sequencing.We obtained the MIRA-seq data from IMR90 cells; the bisulfite sequencing data were downloaded from [Citation5]. The window size for both approaches was 500 bp. (A)HOXB cluster region. Note the lower signal intensity of MIRA-seq compared with bisulfite sequencing for regions with low GC content (left side of sequence region). (B) HOXC cluster region.BS: Bisulfite; MIRA: Methylated-CpG island recovery assay.](/cms/asset/cc1262b9-2aef-41b6-ab85-4c0673c516d2/iepi_a_12324998_f0006.jpg)
Many approaches are available for genome-wide analysis of DNA methylation patterns [Citation1–6]. The most comprehensive ones are based on single base resolution analysis using sodium bisulfite-induced deamination of cytosine, which leaves 5-methylcytosine unconverted. This approach provides the most detailed level of analysis. However, it is still resource-intensive and expensive and, depending on the purpose of the experiment, quite often this level of detail is not required. For example, when identifying differentially methylated regions between cancer genomes and normal control cells or tissues of a patient, many of the most relevant DNA methylation differences occur at CpG-rich, so-called CpG island regions, and the changes will encompass most CpGs within an island. In cancer, hundreds or even thousands of CpG islands can become hypermethylated [Citation7], which sometimes goes along with gene silencing. In comparison, a much smaller number of CpG islands may undergo hypomethylation in tumors, including, for example, a class of germ line-specific genes, the so-called cancer-testis antigen genes [Citation8].
For the purpose of identifying and characterizing tissue-specific DNA methylation patterns, we have previously developed the methylated-CpG island recovery assay (MIRA) [Citation9–11]. Mammalian genomes contain a small set of evolutionary conserved proteins that are characterized by a methylated-CpG-binding domain (MBD), a protein domain that recognizes methylated CpG dinucleotides [Citation12,Citation13]. MIRA is based on the high affinity of a complex of two related proteins, the methyl-CpG-binding protein MBD2b and its homologue, MBD3L1, a protein that has no MBD but forms heterodimers with MBD2b [Citation14,Citation15]. These two proteins form a complex that tightly binds to CpG-methylated DNA in a methylated CpG density-dependent manner [Citation9]. The bound DNA fragments are strongly enriched in CpG-methylated sequences as confirmed by bisulfite sequence analysis [Citation16]. The MBD2b/MBD3L1 complex does not interact with 5-hydroxymethylcytosine [Citation17]. We previously used the MIRA approach in conjunction with different microarray systems [Citation18–20]. We have now optimized the MIRA technique and show here that MIRA is well suited for the analysis of DNA methylation patterns on high-throughput genome sequencing platforms. This technology, which we refer to as MIRA-seq, is now beginning to be used [Citation21,Citation22]. The approach is described in detail in this article.
Materials & methods
Cell & DNA sources
Normal melanocytes were obtained from Lonza (MD, USA). IMR90 cells were from the ATCC. DNA was isolated from cells using DNA purification kits (Qiagen, CA, USA). Melanoma tumor DNA was obtained from Origene (MD, USA).
Expression & purification of GST-tagged MBD2b protein
The following protocol was used for a 100-ml bacterial culture. BL21 (DE3; Invitrogen, CA, USA) competent cells were transformed with GST-MBD2b expression plasmid (available on request via standard material transfer agreement), plated on ampicillin-containing LB agar plates and incubated overnight at 37°C. One colony of the transformed bacteria was inoculated into 5 ml of LB-ampicillin media and incubated at 37°C with shaking overnight. Then, 100 ml of LB-ampicillin medium was inoculated with a 1:100 dilution of the overnight culture and incubated with shaking at 37°C until the culture reached an OD of 0.6 at 600 nm.
The expression of GST-tagged MBD2b protein was induced by adding 100 μl of 0.5 M IPTG (isopropyl β-D-thiogalactopyranoside) per 100 ml culture and cells were allowed to grow for an additional 4–6 h. The induced bacterial culture was transferred into a 50 ml conical tube, centrifuged at 3500 × g for 10 min at 4°C and the supernatant was discarded. The pelleted bacterial cells can be stored at -80°C. Alternatively, protein purification can be done immediately.
In the cold-room or working on ice, the pellet was resuspended in 10 ml of ice-cold STE buffer (10 mM Tris-HCl, pH 7.8, 150 mM NaCl, 1 mM EDTA). After adding 100 μl of 100 mM PMSF and 40 μl of freshly prepared 25 mg/ml lysozyme, the suspension was mixed well and incubated on ice for 10 min. Lysis of bacterial cells was induced by addition of 1.5 ml of 10% N-lauroylsarcosine (Sarkosyl) in STE buffer and mixing. The bacterial lysate was sonicated until it cleared up. For example, using an Epishear™ sonicator (Active Motif, CA, USA), the samples were sheared in a 50 ml tube with 4 pulses at 40% amplitude, consisting of a 15-s sonication followed by a 1 min rest on ice. After sonication, we added 2 ml of 10% Triton X-100 to the lysate and mixed well by vortexing for 20 s, then incubated the lysate for 30 min on ice. The lysate was cleared by centrifugation for 15 min at 3500 × g at 4°C.
We transferred the supernatant into a new 15 ml tube, added 100 μl of a 50% slurry of Glutathione Sepharose® 4B beads (GE Healthcare, WI, USA) and mixed gently on a rocking or rotating platform at 4°C for 45 min. The beads were pelleted by centrifugation at 1000 × g for 1 min at 4°C. The supernatant was discarded. The beads were washed three times with 10 ml of ice cold 1× PBST (1× PBS including 0.1% Triton X-100). For each wash, we inverted the tube several times then placed the tube on a rocking platform for 5 min at 4°C. The beads were pelleted by centrifuging at 1000 × g for 1 min at 4°C. The supernatant was discarded.
The GST-tagged MBD2b protein was eluted from the beads with 2 ml elution buffer (50 mM Tris-HCl, pH 8.5, 150 mM NaCI, 20 mM reduced glutathione, and 0.1% Triton X-100) for 4 h at 4°C on a rocking or rotating platform. The beads were spun down by centrifugation at 1000 × g for 1 min. The supernatant was carefully collected and retained on ice.
The eluted GST-tagged MBD2b protein was dialyzed against 1× PBS in the cold-room for 5 h and then overnight against protein dialysis and storage buffer (50 mM HEPES, pH 7.4, 150 mM NaCI, 5 mM β-mercaptoethanol and 50% glycerol). The purified MBD2b protein can be kept at -20°C for 6 months. The quantity and purity of purified GST-tagged MBD2b protein was checked on a 10% SDS-PAGE gel using BSA as a control for protein amount.
Expression & purification of His-tagged MBD3L1 protein
We transformed BL21 (DE3) competent cells with His-MBD3L1 expression plasmid (available on request), plated them on kanamycin-containing LB-agar plates and incubated overnight at 37°C. We added 100 μl kanamycin stock (50 mg/ml) to 100 ml LB-agar solution or LB media. We inoculated one colony of the transformed bacteria into 5 ml of LB-kanamycin media and incubated at 37°C with shaking overnight. Then, 100 ml of LB-kanamycin media was inoculated with a 1:100 dilution of the overnight culture and incubated at 37°C while shaking until the culture reached an OD of 0.6 at 600 nm.
The expression of His-tagged MBD3L1 protein was induced by addition of 100 μl of 0.5 M IPTG per 100 ml culture, and we allowed cells to grow for an additional 5 h. The induced bacterial culture was transferred into a 50 ml conical tube and centrifuged at 3500 × g for 10 min at 4°C. The supernatant was removed and cells were frozen at -80°C. Alternatively, we proceeded immediately to protein purification.
Working in a cold-room or on ice, the pellet was resuspended in 10 ml of ice-cold STE buffer. We added 100 μl of 100 mM PMSF, 20 μl of 50× complete protease inhibitor cocktail (Roche Applied Science, WI USA) and 40 μl of freshly prepared 25 mg/ml lysozyme (Sigma), then mixed well and incubated on ice for 10 min. We induced lysis of bacterial cells by addition of 1.5 ml of 10% N-lauroylsarcosine and mixed well. The bacterial lysate was sonicated until it cleared up. We added 2 ml 10% Triton X-100 to the sonicated lysate and mixed well by vortexing for 20 s, then incubated the lysate for 30 min on ice. The lysate was cleared by centrifugation for 15 min at 3500 × g at 4°C.
The supernatant was transferred into a new 15 ml tube and 100 μl of a 50% slurry of Ni-NTA agarose beads (GE Healthcare) was added. The suspension was mixed gently on a rocking platform at 4°C for 45 min. The beads were collected by centrifugation at 1000 × g for 1 min at 4°C and the supernatant discarded. The pellet was washed three times with wash buffer 1 (50 mM NaH2PO4, pH 8.0, 300 mM NaCl, 10 mM imidazole). The beads were pelleted by centrifugation at 1000 × g for 1 min at 4°C and the supernatant discarded. Then, 5 ml wash buffer 2 (50 mM NaH2PO4, pH 8.0, 300 mM NaCl, 20 mM imidazole, 0.1% Triton X-100, 5 mM β-mercaptoethanol) was added, the tube inverted several times, and then placed on a rocking platform for 5 min at 4°C. The beads were collected by centrifugation at 1000 × g for 1 min at 4°C and the supernatant discarded. After addition of 5 ml wash buffer 3 (50 mM NaH2PO4, pH 8.0, 300 mM NaCl, 40 mM imidazole, 0.1% Triton X-100, 5 mM β-mercaptoethanol), the tube was inverted several times and then placed on a rocking platform for 5 min at 4°C. The beads were pelleted by centrifugation at 1000 × g for 1 min at 4°C and the supernatant discarded.
The His-tagged MBD3L1 protein was eluted from the beads by addition of 1 ml His-tagged protein elution buffer (50 mM NaH2PO4, pH 8.0, 300 mM NaCl, 250 mM imidazole). The tube was put on a rocking or rotating platform with shaking for 10 min at 4°C. The beads were collected by centrifugation at 1000 × g for 1 min. The supernatant was collected into a new tube on ice. The eluted His-tagged MBD3L1 protein was dialyzed against 1× PBS in the cold-room for 5 h and then overnight against protein dialysis and storage buffer (50 mM HEPES, pH 7.4, 150 mM NaCI, 5 mM β-mercaptoethanol and 50% glycerol). The purified MBD3L1 protein can be kept at -20°C for approximately 6 months. The quantity and purity of the purified His-tagged MBD3L1 protein was checked on a 10% SDS-PAGE gel using BSA as a control for protein amount. A kit containing recombinant MBD2b and MBD3L1 proteins for enrichment of methylated DNA is currently available as ’MethylCollector™ Ultra’ from Active Motif (CA, USA).
Sonication of genomic DNA
Genomic DNA was sonicated to an average fragment size of 100–300 bp using a sonicator.
Ligation of Illumina deep sequencing linkers
For DNA end repair, we incubated 0.5–2 μg sonicated genomic DNA in 1× NEB end repair reaction buffer by adding 5 μl of NEB End Repair Enzyme mix (New England Biolabs, MA, USA) in a volume of 100 μl. The reaction mixture was incubated at 20°C for 30 min. The DNA was purified using QIAquick PCR purification kit (Qiagen) and eluted with 50 μl of water. To achieve dA-tailing, we incubated the end-repaired DNA in a 50 μl volume in 1× NEBNext dA-Tailing Reaction buffer (New England Biolabs) by adding 3 μl of NEB Klenow exo- and incubating at 37°C for 30 min. The DNA was purified using MinElute PCR Purification kit (Qiagen) and eluted twice in 10 μl of Qiagen elution buffer. The final volume was approximately 20 μl.
Subsequently, we performed linker ligation in a volume of 40 μl by incubating the dA-tailed DNA in 1× NEB T4 DNA ligase reaction buffer with 6 μl of a 20 μM stock solution of Illumina Tru-seq linkers in the presence of 1 μl of NEB T4 DNA ligase (400 U/μl). The reaction was carried out at 16°C overnight. The ligated DNA was purified using MinElute PCR Purification kit (Qiagen) and eluted in 10 μl of Qiagen elution buffer (twice), then combined into one tube. We saved 2 μl of linker-ligated DNA as control DNA (input).
MIRA reaction
Preparation of magnetic beads
In a 1.5 ml Eppendorf tube, 5 μl of MagneGST™ magnetic beads (MB; Promega, WI, USA) were dispensed for each reaction. The MB were washed three times with 1 ml cold 1× PBS by inverting the tube several times. Using a magnetic stand to capture MB, we carefully removed the supernatant with a pipette. To preblock MB, we added 400 μl blocking solution (1× NEBuffer 2 buffer, 0.025% Triton X-100, and 1.25 ng/μl of sonicated JM110 DNA) and incubated for 20 min at 4°C on a rotating platform. The MB were captured by magnetic stand and the supernatant was carefully removed, but approximately 20 μl was left in the tube.
Preblocking of MBD proteins
For each reaction, in a total volume of 382 μl, we mixed on ice 40 μl of 10× NEBuffer 2 (10 mM Tris-HCl, pH 7.9, 50 mM NaCl, 10 mM MgCl2 and 1 mM DTT) containing 0.05% Triton X-100, 500 ng of sonicated E. coli JM110 genomic DNA, 1 μg of purified GST-MBD2b protein and 1 μg of purified His-MBD3L1 protein. The mixture was incubated for 20 min at 4°C on a rotating platform.
MIRA binding reaction
We added 18 μl of the linker-ligated sonicated genomic DNA to the 382 μl of preblocked MBD proteins. The binding reaction was incubated overnight at 4°C on a rotating platform.
Purification of methylated DNA using GST magnetic beads
We added MB in blocking solution (10–20 μl) to the MIRA reactions and incubated for 1 h at 4°C on a rotating platform. This step was followed by capture of the MB (methyl-CpG-rich fraction) by magnetic stand separation and by carefully removing the supernatant. Then, 900 μl cold MIRA wash buffer (10 mM Tris-HCl, pH 7.5, 600 mM NaCl, 0.1% (v/v) Triton X-100) was added and the tube was inverted for 5 min on an overhead rotator. The MB were captured by magnetic stand and the supernatant was carefully removed. The washing steps were repeated three to four times, the last time trying to remove all solution from the MB. Then, we added 500 μl PB buffer (from QIAquick PCR Purification kit, Qiagen) directly to the MB and vortexed the tube for 20 s at room temperature. The MB were collected by magnetic stand and the supernatant was transferred into a QIAquick column. We followed the instructions in the QIAquick PCR purification kit to purify the DNA on the column and eluted the enriched methylated DNA from the column with 40 μl of Qiagen EB buffer (10 mM Tris-Cl, pH 8.5).
Illumina sequencing
The MIRA-enriched methylated DNA and input DNA were PCR-amplified by adding Phusion® High-Fidelity PCR Master Mix (NEB). The reaction volume was 100 μl, which included 50 μl of the Phusion High-Fidelity PCR Master Mix, the purified sample or input DNA, 2 μl of 25 μM of Illumina’s primer PE 1.0, 2 μl of 25 μM index primer, and 1 M betaine, using the following conditions in a thermal cycler: 30 s at 98°C, 12 cycles of: 10 s at 98°C, 30 s at 65°C, and 30 s at 72°C, followed by 5 min at 72°C. The PCR products were purified by adding 130 μl Ampure® XP beads (Beckman Coulter, CA, USA) to 100 μl PCR solution, eluted in 25 μl of 10 mM Tris-Cl, pH 8.5, and size-selected by gel electrophoresis on a 6% TBE gel. The targeted range of DNA fragment sizes (250–500 bp) was cut out from the gel. The smashed gel slices were eluted with 200 μl of 10 mM Tris-Cl, pH 8.5 at room temperature for at least 2 h and concentrated with an Amicon Ultra 50 K column (Millipore, MA, USA). Alternatively, one can purify the DNA sample by adding 100 μl Ampure XP beads (1.0×) to 100 μl PCR solution to remove fragments smaller than 200 bp, and use double beads selection (0.65×) to remove the fragments larger than 500 bp. To validate and quantify the purified library we used Bioanalyzer (Agilent, CA, USA). The sequencing library is then processed by Illumina sequencing. Here, an Illumina Hi-seq 2000 instrument and paired-end sequencing were used, but single-end sequencing and other platforms should work as well.
Bioinformatics analysis
Quality control
The first step in MIRA-seq analysis is to test the quality of the resulting Fastq formatted files. The quality, or more precisely the confidence for each base pair is encoded in the Phred scores, which are logarithmically linked to error probabilities. One software package, which can plot the Phred scores for each cycle, is Fastq [Citation23]. Per base sequence quality should be above 20 for the majority of the reads. As read quality commonly drops toward the 3′ end of reads, clipping might be applied if necessary.
Furthermore, the per base sequence content should not indicate any bias toward a certain region-specific GC content within the read. The per sequence GC content should be normally distributed for input samples and show a shift of about 6–10% higher for MIRA-seq reads (e.g., from 45% GC to 51% GC). This is a first indicator that the MBD proteins were binding methylated DNA fragments. Next, there should be no over-represented sequences in the higher single percentages, which could indicate adapter contamination. To test against a set of different sources of possible contamination, the files can be aligned against different species using Fastq Screen [Citation24].
Alignment to the genome
After quality assessment, the fastq files were aligned against the genome. A common and robust solution is to use the bowtie algorithm [Citation25]. A typical example for paired end reads and bowtie2 is:
bowtie2 -p SLOTS -q –very-sensitive-local -S filename.sam -x hg19 -1 ForwardReads.fastq -2 ReverseReads.fastq
SLOTS is the number of threads assigned per alignment. Recommended are 8 or more. The resulting sam formatted files can be converted to the more compact binary bam format with samtools [Citation26]. In this way only aligned reads can be converted, including the header information. Duplicated reads are collapsed to one read. Only uniquely mapped reads are used for downstream analysis.
The next step is to test if the genomic coverage is high enough to compare different samples with each other. One way to do this is by a so-called saturation analysis, which plots the Pearson correlation rates against increasing subsets of the library. The estimated correlation for the total size of the library should be 90% or more. One solution is to use the function MEDIPS.saturation of the MEDIPS bioconductor package, developed by Lukas Chavez and colleagues [Citation27].
For getting an estimate of the fragment enrichment by the MBD proteins, the relative enrichment of CpGs in read-covered sequences in comparison to the genome can be calculated with the MEDIPS.CpGenrich function. Different batches can be compared as well. The observed/expected ratio of CpGs within the regions divided by the observed/expected ratio of CpGs within the reference genome normally ranges between 1.6 and 2.0 for enriched samples and 0.8 to 1.0 for input samples, indicating the quality of the enrichment.
Binning approach for peak calling
Several algorithms have been developed for identifying peaks from ChIP-seq data. However, algorithms like MACS were developed for identifying smaller regions, defined by a specific read distribution around the binding site, commonly found with many transcription factors. Methylated regions in contrast can stretch for several hundred to thousands of base pairs. In this particular case, a binning approach is sufficient. Again, a solution has been worked out in the MEDIPS package and reads can be conveniently binned against different genome builds. The binning length is dependent on the fragment size and is typically between 200 and 500 bp.
Differentially methylated regions between different samples can be calculated by edgeR [Citation28], which has been developed with the particular case of few replicates per group as commonly found in deep sequence experiments. For this purpose the count data can be selected, or the function MEDIPS.meth from the MEDIPS package can be utilized. A rule of thumb is to use a minimum of ten reads coverage for peaks and at least a twofold change to identify differentially methylated regions.
Data display in the Integrative Genomics Viewer
In order to select regions for validation, a visualization of the RPKM normalized read densities is recommended. The MEDIPS package offers a solution to create MEDIPS set objects with the function MEDIPS.createSet and then to export wig formatted files with the function MEDIPS.exportWIG.
The wig files can then be easily imported to genome browsers such as the Integrative Genomics Viewer (IGV) [Citation29] or the genome browser at the University of California Santa Cruz (UCSC), CA, USA [Citation30].
Results & discussion
MIRA-seq produces reliable DNA methylation profiles
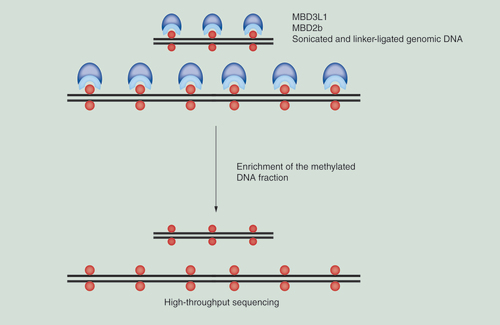
MIRA-seq is based on enrichment of the methylated fraction of genomes by the MBD2b/MBD3L1 complex. An outline of the approach is depicted in . We used the protocol described in ’Materials & methods’ to profile DNA methylation patterns in several human cell or tissue samples. We typically aim at obtaining approximately 30–50 million uniquely aligned reads (postfiltering to remove duplicate reads) for each human or mouse DNA sample. Overall, this approach is comparable to mapping histone modifications (ChIP-seq) and can easily be used directly alongside of such mapping experiments. The advantage of MIRA over antibody-based approaches is that MIRA works with double-stranded DNA and denaturation of the DNA, which is necessary for most anti-5mC antibody-based immunoprecipitation, is not required. This difference can help avoid potential biases associated with incomplete denaturation of very GC-rich DNA sequences. Since the MBD2b/MBD3L1 complex has a strong affinity to methylated DNA [Citation9], the sensitivity of MIRA is high. Although we have not systematically explored the lower limits of DNA amounts that can be used in MIRA-seq, we have previously carried out the MIRA procedure in combination with microarray platforms with as little as 100 ng of mammalian DNA used as input.
shows examples of MIRA profiles. We have compared methylation patterns of DNA obtained from two nontransformed melanocyte cell lines (green) with DNA from four metastatic melanoma tumors (blue). As this typical example shows, the profiles are generally highly similar throughout the genome attesting to the reliability and reproducibility of the MIRA-seq method. Cancer-specific DNA hypermethylation is easily apparent in genomic regions where it does occur in the tumors. As an example, shows the profile of the gene CCDC8, which shows hypermethylation of two CpG islands in the gene body and at the promoter in melanoma tumors when compared with normal melanocytes.
Validation & comparison with whole genome sodium bisulfite sequencing
In order to validate the MIRA-seq method, we conducted standard sodium bisulfite sequencing on several genomic targets. shows tumor-associated MIRA peaks in the HOXA9 gene locus. Verification by bisulfite sequencing shows that the percent of methylated CpG dinucleotides in the sequence region analyzed increases from 26.5% in normal melanocytes () to over 90% in three melanoma tumors (–E).
We also conducted MIRA-seq with DNA from IMR90 fibroblasts. In order to allow a genome-wide comparison between bisulfite sequencing (BS-seq) and MIRA-seq, we downloaded the BS-seq data from Lister et al. [Citation5] for IMR90 cells and smoothed, by using the BSmooth algorithm [Citation31], the individual CpG percentages to a window of 500 bp, the same window size we used for our binning approach with the MIRA-seq data from the same cell type. Compared to whole genome sodium bisulfite sequencing, the advantage of MIRA-seq is a higher sensitivity toward CpG-richer regions and BS-methylated regions of around 0.7 and above, as can be seen in . The two methods provide similar DNA methylation profiles when signals are plotted along genes genome-wide (). Both approaches show a pronounced dip of methylation levels near transcription start sites and higher methylation levels in gene bodies. shows a snapshot from the UCSC genome browser including the HOXB and HOXC gene cluster regions. The data illustrate that the results obtained by whole genome bisulfite sequencing and by MIRA-seq are generally very comparable. As expected, genomic regions with lower GC content and with few CpG islands (such as those at the left side of the HOXB cluster, ) have a lower MIRA-seq signal. However, the methylation status of CpG islands (methylated, unmethylated or weakly methylated) is well represented by MIRA-seq and reflects the one obtained by whole genome bisulfite sequencing.
Both bisulfite sequencing and MIRA-seq have their own inherent biases. Whereas MIRA preferentially detects methylation in CpG-rich DNA, bisulfite may have the opposite bias in that highly methylated GC-rich sequences may be underrepresented due to less efficient PCR amplification of the target regions when they are methylated compared with when they are unmethylated and more cytosines get converted to uracils. Therefore, MIRA and BS can complement each other for accessing regions of different sequence composition.
We propose that MIRA-seq is an efficient and cost-effective alternative to whole genome bisulfite sequencing when it is not necessary to know the methylation state of every single CpG dinucleotide. The procedure gives reliable information on the methylation status of the approximately 28,000 CpG islands in the human genome. It can easily be used to score if methylation of any of these regions and many other CpG-rich sequences is different between specimens. This is particularly useful when samples are compared between normal and disease states, such as normal tissue versus cancer tissue. Currently, one sequencing lane on the Illumina Hiseq system produces approximately 150,000,000 sequencing reads, which is sufficient to analyze three to four tissue samples by MIRA-seq at a cost of a little over US$300 per sample. The cost is similar to that of Illumina’s Infinium arrays. These arrays are dependent on the locations of predesigned probes that cover specific genes. MIRA-seq provides a broad coverage of the genome and is not dependent on specific probes.
Conclusion & future perspective
We provide a detailed protocol for analyzing genomic DNA methylation patterns using the technology platform of MIRA-seq. The examples shown and comparison to bisulfite sequencing demonstrate the utility of this technology. We propose that MIRA-seq is a useful and reliable method for comparing genome-wide methylation patterns between normal and diseased tissues including studies on cancer-associated DNA methylation changes. The limitations of MIRA-seq are that it has moderate resolution, does not analyze every CpG site and that it is best suited for analyzing genomic sequences with medium to high CpG content. Bisulfite sequencing does not have these limitations and can assess methylation at low-density CpG sequence regions. MIRA-seq also does not detect methylation at non-CpG sequences, which exists in a few mammalian cell or tissue types but has unknown function. On the other hand, it is rarely necessary to have information on every single genomic CpG site; in fact the data obtained from whole genome bisulfite sequencing are often binned and smoothed, which leads to a loss of that information. Specifically analyzing all CpG-rich DNA regions by MIRA-seq clearly has a cost advantage over whole genome bisulfite sequencing (∼US$300 vs ∼US$6000). The bioinformatics processing is also much more straightforward. In addition, MIRA-seq is specific for 5-methylcytosine and, unlike standard bisulfite sequencing, does not score 5-hydroxymethylcytosine at CpG sequences [Citation17]. This feature can be useful when tissues with a high content of 5-hydroxymethylcytosine are analyzed, for example, different brain regions. The prospect for the technique is that the cost for this technology will be reduced further in the future due to increasing capacity of the sequencing platforms.
Aim
To develop a genome-scale DNA methylation mapping technique that is reliable, sensitive and cost effective.
Materials & methods
We optimized the methylated CpG island recovery assay (MIRA) and combined it with next-generation sequencing (MIRA-seq).
We developed specific bioinformatics approaches to analyze the MIRA-seq data.
Results
We show that the MIRA-seq technology produces highly similar and reliable DNA methylation profiles when samples from different individuals are compared.
We demonstrate that MIRA-seq has excellent ability to identify cancer-associated DNA hypermethylation events.
MIRA-seq is particularly informative for sequences of medium-to-high CpG content, including CpG islands.
Conclusion
MIRA-seq is an attractive and cost-effective approach for complete methylome analysis when single-base resolution is not required.
Ethical conduct of research
The authors state that they have obtained appropriate institutional review board approval or have followed the principles outlined in the Declaration of Helsinki for all human or animal experimental investigations. In addition, for investigations involving human subjects, informed consent has been obtained from the participants involved.
Financial & competing interests disclosure
This work was supported by NIH grants AG036041, CA160965 and CA084469 awarded to GP Pfeifer. Under a licensing agreement between City of Hope and Active Motif (Carlsbad, CA, USA) the methylated-CpG island recovery assay (MIRA) technique was licensed to Active Motif, and TA Rauch and GP Pfeifer are entitled to (but do not currently receive) a share of the royalties from sales of the licensed technology. The authors have no other relevant affiliations or financial involvement with any organization or entity with a financial interest in or financial conflict with the subject matter or materials discussed in the manuscript apart from those disclosed.
No writing assistance was utilized in the production of this manuscript.
Additional information
Funding
References
- Kalari S , PfeiferGP . Identification of driver and passenger DNA methylation in cancer by epigenomic analysis . Adv. Genet.70 , 277 – 308 ( 2010 ).
- Harris RA , WangT , CoarfaCet al. Comparison of sequencing-based methods to profile DNA methylation and identification of monoallelic epigenetic modifications . Nat. Biotechnol.28 ( 10 ), 1097 – 1105 ( 2010 ).
- Stirzaker C , TaberlayPC , StathamALet al. Mining cancer methylomes: prospects and challenges . Trends Genet.30 ( 2 ), 75 – 84 ( 2014 ).
- Rauch T , PfeiferGP . Methods for assessing genome-wide DNA methylation . In:Handbook of Epigenetics.TollefsbolT ( Ed. ). Elsevier , Amsterdam, The Netherlands , 135 – 147 ( 2010 ).
- Lister R , PelizzolaM , DowenRHet al. Human DNA methylomes at base resolution show widespread epigenomic differences . Nature462 ( 7271 ), 315 – 322 ( 2009 ).
- Weber M , DaviesJJ , WittigDet al. Chromosome-wide and promoter-specific analyses identify sites of differential DNA methylation in normal and transformed human cells . Nat. Genet.37 ( 8 ), 853 – 862 ( 2005 ).
- Baylin SB , JonesPA . A decade of exploring the cancer epigenome - biological and translational implications . Nat. Rev. Cancer11 ( 10 ), 726 – 734 ( 2011 ).
- De Smet C , LurquinC , LetheBet al. DNA methylation is the primary silencing mechanism for a set of germ line- and tumor-specific genes with a CpG-rich promoter . Mol. Cell. Biol.19 ( 11 ), 7327 – 7335 ( 1999 ).
- Rauch T , LiH , WuXet al. MIRA-assisted microarray analysis, a new technology for the determination of DNA methylation patterns, identifies frequent methylation of homeodomain-containing genes in lung cancer cells . Cancer Res.66 ( 16 ), 7939 – 7947 ( 2006 ).
- Rauch T , PfeiferGP . Methylated-CpG island recovery assay: a new technique for the rapid detection of methylated-CpG islands in cancer . Lab. Invest.85 ( 9 ), 1172 – 1180 ( 2005 ).
- Rauch TA , WuX , ZhongXet al. A human B cell methylome at 100-base pair resolution . Proc. Natl Acad. Sci. USA106 ( 3 ), 671 – 678 ( 2009 ).
- Cross SH , CharltonJA , NanXet al. Purification of CpG islands using a methylated DNA binding column . Nat. Genet.6 ( 3 ), 236 – 244 ( 1994 ).
- Hendrich B , BirdA . Identification and characterization of a family of mammalian methyl-CpG binding proteins . Mol. Cell. Biol.18 ( 11 ), 6538 – 6547 ( 1998 ).
- Jiang CL , JinSG , LeeDHet al. MBD3L1 and MBD3L2, two new proteins homologous to the methyl-CpG-binding proteins MBD2 and MBD3: characterization of MBD3L1 as a testis-specific transcriptional repressor . Genomics80 ( 6 ), 621 – 629 ( 2002 ).
- Jiang CL , JinSG , PfeiferGP . MBD3L1 is a transcriptional repressor that interacts with methyl-CpG-binding protein 2 (MBD2) and components of the NuRD complex . J. Biol. Chem.279 ( 50 ), 52456 – 52464 ( 2004 ).
- Choi JH , LiY , GuoJet al. Genome-wide DNA methylation maps in follicular lymphoma cells determined by methylation-enriched bisulfite sequencing . PLoS ONE5 ( 9 ), e13020 ( 2010 ).
- Jin SG , KadamS , PfeiferGP . Examination of the specificity of DNA methylation profiling techniques towards 5-methylcytosine and 5-hydroxymethylcytosine . Nucleic Acids Res.38 ( 11 ), e125 ( 2010 ).
- Rauch T , WangZ , ZhangXet al. Homeobox gene methylation in lung cancer studied by genome-wide analysis with a microarray-based methylated CpG island recovery assay . Proc. Natl Acad. Sci. USA104 ( 13 ), 5527 – 5532 ( 2007 ).
- Rauch TA , PfeiferGP . The MIRA method for DNA methylation analysis . Methods Mol. Biol.507 , 65 – 75 ( 2009 ).
- Rauch TA , ZhongX , WuXet al. High-resolution mapping of DNA hypermethylation and hypomethylation in lung cancer . Proc. Natl Acad. Sci. USA105 ( 1 ), 252 – 257 ( 2008 ).
- Almamun M , LevinsonBT , GaterSTet al. Genome-wide DNA methylation analysis in precursor B-cells . Epigenetics9 ( 12 ), 1588 – 1595 ( 2014 ).
- Green BB , McKaySD , KerrDE . Age dependent changes in the LPS induced transcriptome of bovine dermal fibroblasts occurs without major changes in the methylome . BMC Genomics16 ( 1 ), 30 ( 2015 ).
- FastQC . www.bioinformatics.babraham.ac.uk/projects/fastqc/
- FastQ Screen . www.bioinformatics.babraham.ac.uk/projects/fastq_screen
- Langmead B , TrapnellC , PopMet al. Ultrafast and memory-efficient alignment of short DNA sequences to the human genome . Genome Biol.10 ( 3 ), R25 ( 2009 ).
- Sam tools . http://sourceforge.net/projects/samtools/files/
- MEDIPS . www.bioconductor.org/packages/2.13/bioc/html/MEDIPS
- Robinson MD , McCarthyDJ , SmythGK . edgeR: a bioconductor package for differential expression analysis of digital gene expression data . Bioinformatics26 ( 1 ), 139 – 140 ( 2010 ).
- Integrative Genomics Viewer . www.broadinstitute.org/igv
- Human Genome Browser Gateway . http://genome.ucsc.edu/cgi-bin/hgGateway
- Hansen KD , LangmeadB , IrizarryRA . BSmooth: from whole genome bisulfite sequencing reads to differentially methylated regions . Genome Biol.13 ( 10 ), R83 ( 2012 ).