
Abstract
Aim: To estimate incremental costs and healthcare resource utilization (HRU) associated with select severe adverse events (AEs) and AEs of any severity in patients with metastatic urothelial carcinoma receiving first-line (1L) therapy. Materials & methods: Adults treated with 1L systemic therapy between January 2012 and September 2017 with ≥1 urothelial cancer diagnosis were identified using claims data. Per-patient-per-month cost differences and HRU rate ratios comparing patients with and without select AEs were estimated. Results: Patients with any severe select AEs had higher costs than those without (cost difference = $6130 per-patient-per-month; p 0.001). Healthcare costs and HRU for patients with select AEs were significantly higher versus those without. Conclusion: Select AEs during 1L therapy for metastatic urothelial carcinoma can result in significant burden to patients and healthcare systems.
Urothelial cancer (UC) is the fifth most common cancer in USA, with an estimated 81,190 new cases in 2018 [Citation2]. UC most commonly arises in the bladder but can also develop from other sites, including the renal pelvis, ureters or urethra. Patients with muscle-invasive disease represent 25% of all UC cases [Citation2,Citation3], and up to 50% of them eventually experience distant recurrence (i.e., metastatic disease) after radical cystectomy [Citation4]. The 5-year overall survival of patients with metastatic UC (mUC) is 5%, indicating an urgent unmet need for new therapies [Citation5].
First-line (1L) systemic therapy for mUC consists of cisplatin-based chemotherapy [Citation3], or for cisplatin-ineligible patients, noncisplatin-based chemotherapy regimens such as carboplatin and gemcitabine [Citation6]. Historically, few treatment options were available for platinum (cisplatin/carboplatin)-resistant UC [Citation7]. Recently, immuno-oncology (IO) therapies including PD-1 and PD-L1 antagonists have emerged as effective salvage therapies for mUC [Citation8–10]. From 2016 to 2017, atezolizumab, nivolumab, durvalumab, avelumab and pembrolizumab were approved for the treatment of locally advanced unresectable or mUC that progressed during or following platinum-containing chemotherapy [Citation9,Citation11,Citation12]. Moreover, atezolizumab and pembrolizumab have received accelerated approval from USA and European regulatory agencies for the 1L treatment of patients with mUC who are unfit for cisplatin-containing chemotherapy and whose tumors express PD-L1, or platinum-ineligible patients (regardless of PD-L1 expression) [Citation13–16].
mUC is associated with a high overall economic burden [Citation17], but little is known about the contribution of treatment-related adverse events (AEs) to this burden. This is especially important to understand in light of recent evidence suggesting checkpoint inhibitors are generally better tolerated than chemotherapy, with lower frequency of most AEs (e.g., febrile neutropenia, thrombocytopenia and anemia), but higher frequency of other immune-related AEs [Citation18]. In a recent study, Wong et al. analyzed the incremental costs associated with AEs in patients with cancer [Citation19]. While AEs were evaluated separately for patients with bladder cancer, costs were assessed among patients with bladder cancer of any stage and may, thus, not accurately reflect those of patients with mUC. Filling this knowledge gap is important to raise awareness about the magnitude of these costs, which may inform future considerations around therapy or economic modeling studies [Citation18]. Therefore, this study sought to estimate the incremental costs and healthcare resource utilization (HRU) associated with the management of severe select AEs and select AEs of any severity among USA patients with mUC treated with 1L systemic therapy. Given limitations of the study data source, the occurrence of AEs could not be specifically attributed to specific treatment in this study; rather, diagnoses related to AEs were studied without consideration regarding an ascertained underlying cause. Costs were reported in 2015 USD in this study.
Materials & methods
Data source
Administrative healthcare claims data from the IQVIA™ Real-World Data Adjudicated Claims–US (IQVIA RWD Adjudicated Claims–US) database from 1 January 2012 to 30 September 2017 were used. This database integrates claims of commercial insurance plans and employer-sponsored Medicare Supplemental plans covered by large US employers. The database includes medical claims, pharmacy claims and demographic characteristics (e.g., age, gender and plan type) for >80 million members from >100 health plans across USA. Records in the IQVIA RWD Adjudicated Claims–US database are representative of the US national commercially-insured population. All information contained in this database is de-identified and thus, fully compliant with the confidentiality requirements of the Health Insurance Accountability and Affordability Act.
Study design
A retrospective longitudinal cohort design was used for this study. The index date was defined as the initiation date of 1L IO agents (all IOs available were considered: atezolizumab, nivolumab, pembrolizumab, avelumab and durvalumab) or chemotherapy (carboplatin, cisplatin, cyclophosphamide, docetaxel, doxorubicin, gemcitabine, ifosfamide, methotrexate, paclitaxel [including nab-paclitaxel], pemetrexed and vinblastine) for mUC. Since avelumab, durvalumab and nivolumab are not indicated for 1L treatment of mUC, this study may have captured off-label use. All agents initiated ≤28 days of the index date were considered part of the 1L treatment regimen [Citation20]. The baseline period was defined as the 6-month period of continuous enrollment before the index date. HRU and costs were assessed during 1L treatment episode, defined as the period from the index date to the earliest of end of 1L therapy (last day of supply before a gap of ≥90 consecutive days without any therapeutic agent from the 1L treatment regimen [Citation21] or initiation of an agent not part of 1L treatment regimen), end of eligibility or end of data availability.
An expert clinician (PG) was consulted to identify relevant AEs (hereafter referred to as select AEs), and the following were selected based on their frequency in UC and other tumor types, high treatment-related costs, relative severity and high clinical relevance to the therapies of interest: sepsis, febrile neutropenia, acute kidney injury, dehydration, colitis (including diarrhea), adrenal insufficiency, hepatitis and pneumonitis. The same AEs were assessed in patients treated with IO versus chemotherapy. Notably, claims data do not contain information regarding ascertained attribution of diagnoses to a specific cause or treatment, and thus this study makes no assumption about whether the AEs identified are treatment-related. Given the nature of the data (i.e., administrative healthcare claims), severe AEs were identified from hospitalization claims using all ICD-9-CM and ICD-10-CM diagnosis codes available, as AE grade according to the Common Terminology Criteria for Adverse Events is not a variable that is available through claims data. AEs of any severity were identified based on diagnosis codes observed for claims from any setting (e.g., hospitalization, emergency room [ER] visit, outpatient visit). Each patient’s 1L treatment episode was classified as ‘with AE’ or ‘without AE’ based on whether a diagnosis for the select AE was observed during the 1L treatment episode. Since patients may have experienced multiple AEs during a treatment episode, a treatment episode may be considered ‘with AE’ in the analysis of certain AEs and ‘without AE’ in the analysis of others.
The comparison of patients with and without severe select AEs was the predominant focus of this study, although comparisons of select AEs of any severity were also performed.
Study population
US-based patients meeting the following criteria were included: ≥18 years of age, received 1L chemotherapy or IO, had ≥1 UC diagnosis code during the 6 months prior to the index date, and had continuous enrollment for ≥6 months prior to and ≥3 months following the index date. No patients using avelumab or durvalumab were identified. Patients treated with IOs (i.e., atezolizumab, nivolumab or pembrolizumab) were assumed to have mUC based on the US FDA-approved indication for these agents. Patients treated with chemotherapy were required to have ≥1 medical claim with a primary or secondary diagnosis code for a secondary malignancy to identify patients with metastases.
Patients with a claim for a select AE during the 6-month baseline period were excluded from the analysis for that specific AE only.
Study outcomes & statistical analysis
Healthcare costs
Total healthcare costs were measured over the 1L treatment episode and reported per-patient-per-month (PPPM). Costs were inflated to 2017 USD using the Medical Care component of the Consumer Price Index from the Bureau of Labor Statistics, US Department of Labor. Multivariable linear regression was used to estimate mean cost differences comparing patients with and without any severe AEs, AEs of any severity and each select AE. A separate regression was performed for each analysis. The models were adjusted for the following baseline demographic and clinical characteristics: age, gender, region, insurance type, year of index date, index treatment regimen, time from first claim with UC diagnosis code to index date, most prevalent comorbidities during baseline (overall prevalence ≥5%), most prevalent baseline AEs (prevalence ≥5% in the studied AE cohort) and total baseline healthcare costs. Nonparametric bootstrap estimation with 499 replications was used to estimate 95% confidence intervals and p-values.
Healthcare resource utilization
Crude rates of HRU were calculated based on claims for hospitalization, ER visits and outpatient visits. Results were reported as the number of events per patient-year. Adjusted incremental rates of HRU associated with severe select AEs (overall), select AEs of any severity (overall) and each select AE were estimated using multivariable Poisson regression models that compared HRU rates over the 1L treatment episode between patients with versus without the AE. The models were adjusted for baseline demographic and clinical characteristics. Adjusted rate ratios (RR) and their corresponding 95% confidence intervals were reported.
Results
Baseline characteristics
Of 10,870 patients with ≥1 claim for any mUC systemic therapy, 2031 patients met the study eligibility criteria, including 125 (6.2%) treated with an IO agent and 1906 (93.8%) treated with chemotherapy (). Median age was 62 years, and 680 (33.5%) patients were female. The average time from first claim with a UC diagnosis to index was 3.0 months, and the average Charlson comorbidity index score was 7.1 out of 24 (1.1 out of 18 when excluding cancer). Hypertension (n = 871, 42.9%), iron deficiency anemia (n = 391, 19.3%) and fluid electrolyte disorder (n = 370, 18.2%) were the most common baseline comorbidities. The average 1L treatment episode duration was 3.8 months. 796 (39.2%) patients experienced ≥1 specific AE during baseline, including acute kidney injury (n = 346, 17.0%), dehydration (n = 245, 12.1%) and hepatitis (n = 192, 9.5%).
Table 1. Baseline demographics and clinical characteristics.
Patients with any severe AEs (n = 290) and patients without any severe AEs (n = 1290) were comparable with respect to geographic region and gender. A small number of patients with severe AEs (n = 14) and without severe AEs (n = 82) were treated with IOs, and the proportion of patients with any severe AE treated with IOs was slightly lower than that for patients without any severe AE (4.8% [n = 14] vs 6.4% [n = 82]; p = 0.325), though this difference was not statistically significant. More patients with versus without any severe AE had hypertension (47.2% [n = 137] vs 40.1% [n = 517]; p = 0.025).
Incremental healthcare costs over the 1L treatment episode
Among patients with severe select AEs, mean total all-cause healthcare cost was $20,376 PPPM (Supplementary Figure 1). These costs included outpatient costs ($11,055), hospitalizations ($8508), pharmacy costs ($704) and ER costs ($109). All-cause healthcare costs were significantly higher for patients with versus without any severe AEs, with an adjusted mean incremental cost difference of $6130 PPPM (p 0.001). The greatest mean incremental cost differences PPPM were observed for severe pneumonitis ($20,242; p 0.001), sepsis ($9490; p 0.001) and acute kidney injury ($8843; p 0.001). Mean incremental cost differences for severe adrenal insufficiency and hepatitis were not statistically significant ().
(A) Adjusted mean cost differences (and 95% CIs) comparing patients with versus without select severe AEs. (B) Adjusted mean cost differences (and 95% CIs) comparing patients with versus without select AEs of any severity.
*Indicates statistical significance at the 5% level.
AE: Adverse event; CI: Confidence interval; PPPM: Per-patient-per-month.
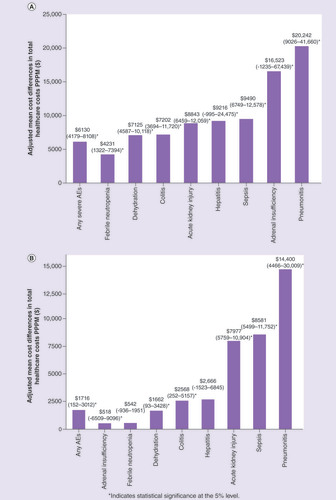
All-cause healthcare costs for patients with AEs of any severity (n = 666) were significantly higher compared with patients without AEs (n = 569), with an adjusted mean incremental cost difference of $1716 PPPM (p 0.05). The greatest cost differences PPPM were observed for pneumonitis ($14,400; p 0.001), sepsis ($8581; p 0.001) and acute kidney injury ($7977; p 0.001; ).
Incremental HRU over the 1L treatment episode
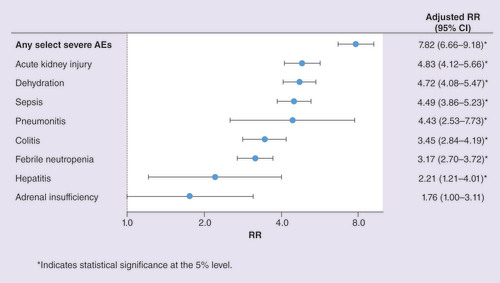
All-cause HRU was significantly greater for patients with versus without any severe select AE, especially for hospitalizations. The rate of HRU per patient-year for patients with versus without severe AEs was 4.63 versus 0.58 for hospitalizations (adjusted RR = 7.82), 2.07 versus 1.22 for ER visits (adjusted RR = 1.64) and 87.6 versus 82.1 for outpatient visits (adjusted RR = 1.05; all p 0.001). For specific severe AEs, the rate of hospitalization was significantly higher for patients in each of the severe AE cohorts compared with their non-AE counterparts with the exception of adrenal insufficiency ().
*Indicates statistical significance at the 5% level.
AE: Adverse event; CI: Confidence interval; RR: Rate ratio.
All-cause HRU was significantly higher for patients with versus without any select AE (of any severity). The rate of HRU per patient-year for patients with versus without select AEs was 1.65 versus 0.68 for hospitalizations (adjusted RR = 2.53), 1.50 versus 0.90 for ER visits (adjusted RR = 1.75) and 85.6 versus 77.9 for outpatient visits (adjusted RR = 1.09; all p 0.001).
Discussion
Limited information is available on costs and HRU related to the management of AEs among US patients with mUC in a real-world setting. Findings from our study suggest that incremental costs associated with severe select AEs are high, especially among patients with severe pneumonitis, sepsis and acute kidney injury. The severe select AEs associated with the highest incremental rate of hospitalization were acute kidney injury, dehydration and sepsis.
A previous study by Wong et al. evaluated the costs of 1L treatment episodes with versus without AEs stratified by different cancer types, including bladder cancer [Citation19]. The AEs assessed in both our study and that from Wong et al. were neutoprenia/leukopenia, pneumonitis and sepsis. The authors estimated the incremental costs of treatment episodes with neutoprenia/leukopenia at $4368, those with pneumonitis at $7548 and those with sepsis at $19,475. After correcting for the duration of each episode (and assuming these durations are similar overall and among patients with bladder cancer), this yields PPPM incremental costs of $929 for neutropenia/leukopenia, $909 for pneumonitis and $3416 for sepsis. These cost estimates are substantially lower than those reported in the present study, particularly for pneumonitis. This may largely be due to the fact that Wong et al. did not focus on patients with mUC (i.e., patients with bladder cancer of any stage were included). Differences in study design may also contribute to this apparent discrepancy: unlike the present study, Wong et al. performed their analyses at the 1L treatment episode level, and the duration of the treatment episode varied depending on the AEs that occurred. Moreover, the potential low incidence of some of these AEs may also hinder the accuracy of cost estimates in our analysis. In another study that included cancer patients (any type, including 10% with genitourinary cancer) treated with chemotherapy, patients with neutropenic complications experienced higher rates of hospitalizations and outpatient encounters, which is consistent with our findings [Citation1].
Two factors contribute to the overall cost of AEs: the overall incidence of AEs, and the cost of AEs per patient, which is influenced by the nature and severity of AE. Although the present study was focused on the latter aspect, a meta-analysis showed that checkpoint inhibitors were associated with a significantly reduced incidence of AEs relative to chemotherapy [Citation18]. Notably, the incidence of severe AEs was particularly reduced in the study [Citation18]. This suggests that IO agents, used alone or in combination, may reduce both the incidence and severity of AEs, which may in turn help alleviate the high cost burden of AEs found in our study. Future studies are warranted to formally test this hypothesis. With regards to costs of AEs per patient, a key result of the present study is that patients with severe select AEs or select AEs of any severity had significantly higher costs than those without AEs. The AEs associated with the highest incremental costs were immune-related and included pneumonitis, adrenal insufficiency and sepsis. While such immune-related AEs are more common with IO agents than chemotherapy [Citation18], their absolute incidence is rare. For example, only approximately 1–5% of patients had pneumonitis in trials of IO agents compared with chemotherapy [Citation22–26].
It is important to note that the costs calculated in the present study cannot Citation27be solely attributed to a specific AE as costs were calculated at the patient level for the entire 1L treatment period. For example, patients who developed pneumonitis may be predisposed to other AEs resulting in increased total costs, which would have been captured in the present analysis. When assessing costs among oncology patients at the hospitalization level, Chu et al. found that the costs of hospitalization for immune-related AEs were lower than those for other oncologic admissions ($3142 versus $8257 per day) [Citation27]. This evidence further suggests that the costs of severe AEs in our study may have been lower if the proportion of patients treated with IO agents had been higher.
The economic burden of AEs could not be assessed separately among patients treated with IO agents since the vast majority of patients included in our study were treated before the advent of IO agents. Cohorts for immune-related AEs were identified for patients treated with IO and chemotherapy, the latter of which comprised the vast majority of patients in each cohort, and were among those with the smallest number of patients with AEs in the study. For instance, no patients with severe pneumonitis, adrenal insufficiency or hepatitis and only three patients with severe colitis were treated with IO agents. Thus, it is not possible to generalize these results to the burden of immune-related AEs among patients treated with IO therapy in real-world practice. In addition, our study did not assess the incidence of AEs because claims data cannot be used for this purpose. Therefore, no conclusions can be drawn regarding how IO agents impact the pattern and associated costs of AEs. Further research, including clinical trials, is needed to assess clinical outcomes, HRU and costs associated with IO agents, chemotherapy and their combination.
The present study is subject to some limitations. Given the relatively recent approval of these agents, the sample size for immune-related AEs was small and prevented stratified analyses by patients receiving IOs versus chemotherapy. While avelumab, durvalumab and nivolumab are not indicated for 1L use, some patients may have received these drugs off-label per inclusion criteria or may have previously received a line of therapy that was not captured in the data. Also, the database did not contain granular clinical information to identify patients with mUC with certainty through claims data, and relied on the use of diagnosis codes from administrative billing claims. Moreover, potential misspecification of diagnosis codes might have resulted in the misclassification of UC patients and those with select AEs. In contrast to clinical trials which use, for example, Common Terminology Criteria for Adverse Events to grade AE severity, this study defined severe AEs as a hospitalization claim with a diagnosis code for one of the select AEs, limiting the comparability of our results to clinical trials. Health conditions that did not require medical care resulting in an insurance claim were not represented in the data, and treatment duration and monitoring/follow-up interval assessments may have varied among patients. However, relying on diagnosis codes is very typical for such claims-based studies. Furthermore, due to lack of data on underlying specific cause, it was not possible to ascertain if the select AE diagnoses were directly related to the treatment of interest. It is also important to note that the data only included patients with employer-sponsored health plans or Medicare Supplemental plans. Thus, results may not be generalizable to patients with other insurance types, such as Medicaid or to those without health insurance. Furthermore, patients included in the study were younger than expected based on the typical age of diagnosis of UC (73 years old), which could have an impact on the costs of AEs in this population [Citation28]. Lastly, due to the nonrandomized nature of observational studies, results may be subject to residual unmeasured confounding and selection biases. Potential confounders not available in claims data include performance status, disease burden and site of metastasis, response to prior therapies and treatment-free interval, as well as laboratory values. Of note, unadjusted and adjusted differences were roughly similar, which likely reflects the fact that baseline characteristics were generally comparable between patients with and without each of the specific select AEs. Our study focused on select AEs deemed more relevant for mUC, but other AEs also contribute to the burden of mUC; these could be the focus of future studies.
Conclusion
In this study, select severe AEs and AEs of any severity during 1L treatment for mUC were associated with higher costs and HRU. Given the small numbers of patients treated with IOs in this study, specific conclusions cannot be drawn regarding how the use of IO agents may impact real-world patterns or costs of immune-related AEs. This is one of the very first studies to show HRU and cost data on immune-related AEs in mUC and highlights the need for further research on these AEs, and also compared with chemotherapy-related AEs.
Previous studies noted that metastatic urothelial cancer presents a substantial economic burden. However information on adverse event (AE)-related healthcare costs and healthcare resource utilization (HRU) in this population is limited.
In this study, patients experiencing febrile neutropenia, dehydration, acute kidney injury, sepsis, colitis, hepatitis, adrenal insufficiency and pneumonitis during first-line treatment were identified using medical claims. Note that due to the use of claims data, AEs could not be specifically attributed to treatment. Per-patient-per-month incremental cost differences and HRU rate ratios comparing patients with and without select AEs were estimated.
The majority of patients included in the study were treated with chemotherapy (94%) as opposed to immuno-oncology therapy (6%) with immuno-oncology therapy.
Patients with any severe select AEs had higher costs than the patients without severe select AEs, and all-cause healthcare costs and HRU for patients with select AEs were significantly higher compared with patients without AEs.
Select AEs during first-line therapy for metastatic urothelial cancer can result in significant burden to patients and healthcare systems.
Selecting appropriate therapies based on validated biomarkers, patient education and early diagnosis of AEs may help lessen the impact of AEs on healthcare costs and HRU.
Previous presentation
Part of the material in this manuscript was previously presented at the ICPE Annual Conference 2019, ASCO Genitourinary Cancers Symposium 2019, and AMCP Nexus 2018
Supplemental Figure 1
Download Zip (16.1 KB)Acknowledgments
The authors would like to thank D Lejeune, C O’Connor and P Jacques for their assistance with statistical analyses.
Supplementary data
To view the supplementary data that accompany this paper please visit the journal website at: www.tandfonline.com/doi/suppl/10.2217/fon-2019-0434
Financial & competing interests disclosure
This research was funded by AstraZeneca US. R Shenolikar and Y Doleh are employees and stockholders of AstraZeneca. M Duh, M DerSarkissian and F Laliberté report grants from AstraZeneca, during the conduct of the study; grants from numerous pharmaceutical manufacturers, including Pfizer, GSK, Janssen, Bayer, Ipsen, Takeda, Sanofi, Shire, Kiniksa, Novo Nordisk, TARIS, Eisai, Allergan, Merck and Medtronic outside the submitted work. P Grivas has received research funding and has provided consulting to AstraZeneca. P Grivas reports personal fees and other from AstraZeneca, during the conduct of the study; personal fees and other from Genentech, personal fees from Dendreon, personal fees and other from Bayer, personal fees and other from Merck & Co., personal fees and other from Mirati, other from Oncogenex, personal fees and other from Pfizer, personal fees and other from Bristol-Myers Squibb, personal fees from Exelixis, personal fees from Biocept, personal fees and other from ClovisOncology, personal fees from EMD Serono, personal fees from Seattle Genetics, personal fees from Foundation Medicine, personal fees from Driver Inc., personal fees from QED Therapeutics, personal fees from Heron Therapeutics, personal fees from Janssen, other from Bavarian Nordic, other from Immunomedics, other from Debiopharm, outside the submitted work. The authors have no other relevant affiliations or financial involvement with any organization or entity with a financial interest in or financial conflict with the subject matter or materials discussed in the manuscript apart from those disclosed.
No writing assistance was utilized in the production of this manuscript.
Additional information
Funding
References
- Weycker D , MalinJ, EdelsbergJ, GlassA, GokhaleM, OsterGet al. Cost of neutropenic complications of chemotherapy. Ann Oncol.. 19(3), 454–460 (2007).
- Siegel RL , MillerKD, JemalA. Cancer statistics, 2018. CA Cancer J. Clin.68(1), 7–30 (2018).
- Sanli O , DobruchJ, KnowlesMAet al. Bladder cancer. Nat. Rev. Dis. Primers3, 17022 (2017).
- Mari A , CampiR, TelliniRet al. Patterns and predictors of recurrence after open radical cystectomy for bladder cancer: a comprehensive review of the literature. World J. Urol.36(2), 157–170 (2018).
- American Cancer Society . Survival rates for bladder cancer (2017). www.cancer.org/cancer/bladder-cancer/detection-diagnosis-staging/survival-rates.html
- Makhinova T , BarnerJC, RichardsKMet al. Asthma controller medication adherence, risk of exacerbation, and use of rescue agents among texas medicaid patients with persistent asthma. J. Manag. Care Spec. Pharm.21(12), 1124–1132 (2015).
- Oing C , RinkM, OechsleK, SeidelC, Von AmsbergG, BokemeyerC. Second line chemotherapy for advanced and metastatic urothelial carcinoma: vinflunine and beyond – a comprehensive review of the current literature. J. Urol.195(2), 254–263 (2016).
- Massard C , GordonMS, SharmaSet al. Safety and efficacy of durvalumab (MEDI4736), an anti-programmed cell death ligand-1 immune checkpoint inhibitor, in patients with advanced urothelial bladder cancer. J. Clin. Oncol.34(26), 3119–3125 (2016).
- Ning YM , SuzmanD, MaherVEet al. FDA approval summary: atezolizumab for the treatment of patients with progressive advanced urothelial carcinoma after platinum-containing chemotherapy. Oncologist22(6), 743–749 (2017).
- Sharma P , RetzM, Siefker-RadtkeAet al. Nivolumab in metastatic urothelial carcinoma after platinum therapy (CheckMate 275): a multicentre, single-arm, Phase II trial. Lancet Oncol.18(3), 312–322 (2017).
- Apolo AB , InfanteJR, BalmanoukianAet al. Avelumab, an anti-programmed death-ligand 1 antibody, in patients with refractory metastatic urothelial carcinoma: results from a multicenter, Phase Ib study. J. Clin. Oncol.35(19), 2117–2124 (2017).
- Bellmunt J , DeWit R, VaughnDJet al. Pembrolizumab as second-line therapy for advanced urothelial carcinoma. N. Engl. J. Med.376(11), 1015–1026 (2017).
- Balar AV , CastellanoD, O’DonnellPHet al. First-line pembrolizumab in cisplatin-ineligible patients with locally advanced and unresectable or metastatic urothelial cancer (KEYNOTE-052): a multicentre, single-arm, Phase 2 study. Lancet Oncol.18(11), 1483–1492 (2017).
- Balar AV , GalskyMD, RosenbergJEet al. Atezolizumab as first-line treatment in cisplatin-ineligible patients with locally advanced and metastatic urothelial carcinoma: a single-arm, multicentre, phase 2 trial. Lancet389(10064), 67–76 (2017).
- Genentech . TECENTRIQ® (atezolizumab): highlights of prescribing information (2019). www.gene.com/download/pdf/tecentriq_prescribing.pdf
- Merck & Co. KEYTRUDA® (pembrolizumab): highlights of prescribing information (2019). www.merck.com/product/usa/pi_circulars/k/keytruda/keytruda_pi.pdf
- Aly A , JohnsonC, YangS, BottemanMF, RaoS, HussainA. Overall survival, costs, and healthcare resource use by line of therapy in Medicare patients with newly diagnosed metastatic urothelial carcinoma. J. Med. Econ.22(7), 662–670 (2019).
- Nishijima TF , ShacharSS, NyropKA, MussHB. Safety and tolerability of PD-1/PD-L1 inhibitors compared with chemotherapy in patients with advanced cancer: a meta-analysis. Oncologist22(4), 470–479 (2017).
- Wong W , YimYM, KimAet al. Assessment of costs associated with adverse events in patients with cancer. PLoS ONE13(4), e0196007 (2018).
- Hurvitz S , GuerinA, BrammerMet al. Investigation of adverse-event-related costs for patients with metastatic breast cancer in a real-world setting. Oncologist19(9), 901–908 (2014).
- Lang K , MarciniakMD, FariesDet al. Costs of first-line doublet chemotherapy and lifetime medical care in advanced non-small-cell lung cancer in the United States. Value Health12(4), 481–488 (2009).
- US FDA . Prescribing information – IMFINZI® (durvalumab) (2019). www.accessdata.fda.gov/drugsatfda_docs/label/2019/761069s013lbl.pdf
- US FDA . Prescribing information – OPDIVO (nivolumab) (2019). www.accessdata.fda.gov/drugsatfda_docs/label/2015/125527s000lbl.pdf
- US FDA . Prescribing information – TECENTRIQ® (atezolizumab) (2017). www.accessdata.fda.gov/drugsatfda_docs/label/2019/761034s014lbl.pdf
- US FDA . Prescribing information – BAVENCIO® (Avelumab) (2019). www.accessdata.fda.gov/drugsatfda_docs/label/2019/761049s006lbl.pdf
- US FDA . Prescribing information – KEYTRUDA® (pembrolizumab) (2019). www.accessdata.fda.gov/drugsatfda_docs/label/2019/125514s055s056lbl.pdf
- Chu JN , ChoiJG, OstvarSet al. Cost of inpatient admissions for immune-related adverse effects from immune checkpoint inhibitor therapy: a single center experience. J. Clin. Oncol.36(Suppl. 15), 3060 (2018).
- American Cancer Society . Key statistics for bladder cancer (2019). www.cancer.org/cancer/bladder-cancer/about/key-statistics.html