
Abstract
Aims: Adnexal mass risk assessment (AMRA) stratifies patients with adnexal masses, identifying the relatively small number of malignancies from benigns which might take a ‘watchful waiting’ approach. Methods: AMRA uses seven biomarkers and derived from women with adnexal masses scheduled for surgery. Estimated clinical performance was calculated using fixed prevalence. Results: At 5% prevalence, the high-risk group, 7.9% total, captured 75.9% of invasive malignancies at a positive predictive value of 35.8%. High risk/intermediate risk combined had a sensitivity of 89.7 and 95.6% for pre- and post-menopausal cancers, respectively. The low-risk group, 67.8% total, had an negative predictive value of 99.0%. Conclusion: With highly differentiating risk stratification capability across histological subtypes and stages, AMRA is potentially applicable to patients with adnexal masses to assist deciding whether immediate surgery is recommended.
Adnexal masses are a common clinical diagnosis in women from the age of adolescence onward, occurring in five to ten percent of women during their lifetimes. Masses are benign in the vast majority of cases [Citation1]. However, the potential risk of malignancy must be considered.
Benign masses may cause problems due to size, proximity to organs and pain or discomfort. Surgical removal of the mass may be recommended. However, some benign masses may be largely asymptomatic and can be monitored. The benefits of this are clear: the avoidance of an invasive surgery and the associated costs, both financial and in terms of recovery time [Citation2].
The current standard of care for a suspected adnexal mass is imaging, typically performed via transvaginal ultrasonography. Imaging may clearly reveal the mass to be benign or malignant based on its physical features, but there are many cases in which the mass is indeterminate [Citation3]. In these cases, in an asymptomatic patient, follow-up imaging after a period of time is recommended in order to determine if the mass is persistent, stable or has resolved. A risk associated with this approach is delay in detection and management of a malignant lesion [Citation4].
Adnexal mass risk assessment (AMRA) is a multivariate index assay of serum biomarkers developed to segregate patients with a suspected adnexal mass into three risks of malignancy categories to assist in the decision on whether immediate surgery is recommended. The objective is to use one cutoff to capture a high percentage of the total cancer cases within a relative small group of high risk patients resulting a clinically actionable positive predictive value and to use a second cutoff to assign a significant portion of the remaining test population into a low-risk (LR) group with a very high negative predictive value.
The ability to develop and evaluate a serum test for the above-described intended use is often hindered by the lack of properly enrolled clinical samples with inclusion/exclusion criteria representative of the targeted test population and the practical difficulty of missing definitive clinical classifications for those who do not have surgery. For the development as well as independent validation of AMRA, biomarker data were retrospectively analyzed from prospectively collected cohorts of patients diagnosed with adnexal masses and for whom all had definitive pathological classifications from surgery. To project the performance of AMRA on its intended population of patients with adnexal masses prior to the decision of surgery, we assumed that except for the obvious differences in cancer prevalence, the cancer cases in the patient cohorts used in the current study and AMRA’s intended population are similar in terms of histologic subtypes, grades, and stages, and if anything else the noncancer benign patients in AMRA’s intended population would likely be ‘healthier’ controls. This allowed us to estimate conservatively important test performance metrics such as positive and negative predictive values of the AMRA high- and low-risk groups, respectively by adjusting for an assumed malignancy prevalence that is typically observed in AMRA’s intended populations [Citation8].
Methods
Multi-analyte panel
Seven serum protein analytes were included as input for AMRA development: APO-A1, B2M, CA 125-II, FSH, HE4, TRF and TT. Subsets of these analytes have been used for multivariate index assay (MIA) and multivariate index assay second generation (MIA2G). For all datasets, the analytes were measured on Roche cobas 6000 (Roche Diagnostics Corp., IN, USA) per manufacturer product package inserts.
Sample sets
Data from samples in four separate collections were used in this study. For the derivation of the AMRA algorithm, the training data were from samples that have been previously used for the derivation and validation for the original MIA and the MIAG2 IVDMIA [Citation5,Citation6,Citation7] tests (‘OVA1 Study’). These samples were originally collected prospectively from 27 Institutional Review Board-approved sites throughout the USA. Inclusion criteria were: women age ≥18 years, signed informed consent, agreeable to phlebotomy and documented pelvic mass planned for surgical intervention within 3 months of imaging. A pelvic mass was confirmed by imaging (computed tomography, ultrasonography or MRI) prior to enrollment. Exclusion criteria included a diagnosis of malignancy in the previous 5 years (excepting nonmelanoma skin cancers). With the original use of the sample collection to evaluate the utility of MIA and MIAG2 in referring high-risk (HR) patients to be operated by gynecologic oncologists, the collection excluded patient initially enrolled by a gynecologic oncologist. Menopause was defined as the absence of menses for ≥12 months, or age ≥50 years for a small number of subjects for whom the menopausal data were missing. Demographic and clinicopathological data were collected on case report forms.
The original prospectively collected sample set represented the actual test population of preoperative risk assessment of adnexal masses. For AMRA algorithm development, however, only a subset (88.36%) of the total samples for whom results of all seven analytes were available, resulting in a slightly over-representation of ovarian cancer cases. Among the 585 samples, there were 284 premenopausal patients including 54 ovarian cancer cases and 230 benign controls, and 301 postmenopausal patients with 124 cases and 177 controls. lists in detail relevant demographic and clinicopathological descriptions of the sample sets.
Table 1. Study demographics and clinicopathologic information according to menaopausal stage.
The trained AMRA algorithms were then validated on datasets from the remaining three independent Institutional Review Board-approved specimen cohorts: FHCRC#7788, the OVA500 study and OVA1-PS1-CO4.
For FHCRC#7788, Patients were prospectively enrolled at gynecologic oncology and benign gynecologic clinics at the Seattle Cancer Care Alliance and the University of Washington Medical Center from 2012 to 2015. Inclusion criteria included women age ≥18 years, signed informed consent and a documented adnexal mass planned for surgery. An adnexal mass was confirmed by imaging (computed tomography, ultrasonography or MRI) prior to enrollment. Exclusion criteria included pelvic surgery within 6 weeks prior to presentation. Demographic, clinical and pathologic information were collected prospectively. Informed consent was provided by all enrolled patients. For validation of AMRA, a case–control set from the FHCRC#7788 cohort was used based on samples with all seven biomarkers.
The OVA500 study and OVA1-PS1-CO4 had the same enrollment and exclusion criteria as the OVA1 study except that OVA1-PS1-CO4 included only subjects not yet referred to a gynecologic oncologist even though for whom surgical intervention had been planned. As a result, the prevalence of ovarian cancer in OVA1-PS1-CO4 is significantly lower than that in OVA500.
All samples in each study with known biomarker values for all seven analytes were used in this analysis. Among the cancer cases, 15 samples (0.074% of total samples) with malignancies not involved with the ovary were removed from analysis.
Model derivation
AMRA was developed for the intended utility of using two cutoffs to identify a small group of HR patients that captures a large portion of the cancer cases and a relatively large groups of LR patients with a high negative predictive value. During model derivation, the desired performance characteristics, in particular, to have an improved sensitivity at very high specificity, was translated and implemented numerically and computationally to influence the derivation and selection of the final models. To assure statistical stability of results, extensive statistical resampling approaches, such as bootstrap sampling of data points within the training sample set and random selection of subset of input analytes were extensively used.
Two separate predictive models (algorithms) were derived for the pre- and post-menopausal patient populations, respectively. For each algorithm, the training dataset was also used to determine a ‘rule-in’ cutoff to identify HR group and a ‘rule-out’ cutoff to identify relatively LR group. The samples between the two cutoffs were classified as intermediate risk (IR). The selection of cutoffs was driven by the desired performance characteristics based on consensus from clinicians. For example, tradeoff between sensitivity and having a smaller proportion of patients in HR group (and the corresponding positive predictive value [PPV]) determined the rule-in cutoff; and similarly, balance between a required high negative predictive value (NPV) and having a sufficiently large LR group helped to select the rule-out cutoff.
Performance evaluation
The derived AMRA algorithms and the fixed cutoffs were evaluated on the training set and the three independent validation sets individually and combined. Area under curves from receiver-operating characteristic curve analysis were used to assess the overall performance and to compare with CA125. Sensitivity for the rule-in cutoff (proportion of total cases captured by the HR group) and specificity for the rule-out cutoff (proportion of total benigns in the LR group) were estimated. In addition, positive likelihood ratios (LR+) and negative likelihood ratios (LR-), which are not dependent on prevalence, were also estimated for the HR and LR groups, respectively, and used to provide approximated assessment on changes in post-test probability of cancer from pretest probability.
The samples used for the current study were all from what were originally prospectively collected cohorts. However, with the retrospective use of only samples for whom results of all seven biomarkers were available, the proportion of malignant cases and benign controls were somewhat skewed. The reasons for samples with missing biomarker values were mostly due to specimen volume and other study-dependent decision on data generation and were not directly related to patient clinicopathological phenotypes. As previously discussed, it seemed reasonable to assume that the cancer cases and the benign controls of the individual sample sets were approximate representations of the cases and controls, respectively, in the AMRA test’s intended test population except for the obvious differences in malignancy prevalence. To project the performance of the AMRA algorithms in its intended population, we assumed a pretest prevalence of 5 and 10% in pre- and post-menopausal test populations, respectively. The projected distribution of benign, low-malignant potential tumors (LMPs), stage I/II cases and stage III/IV cases among the three AMRA risk classification groups were estimated after adjustment for the assumed prevalence. Based on such adjustments, percentage of total test population, post-test cancer prevalence was estimated for the AMRA risk groups, including PPVs and NPVs for the HR and LR groups, respectively.
Results
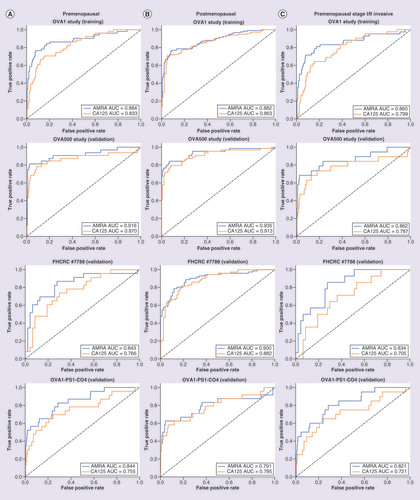
shows the receiver operating characteristic (ROC) curves of AMRA with comparison to CA125 on pre- and post-menopausal patients in the training set, and the three validation sets. AMRA outperformed CA125 across all sample sets, especially in the part of ROC curve representing sensitivity at very high specificity (leftmost of the plot) that determines the performance characteristics of the rule-in (HR) group. In particular, the improvement among premenopausal patients was statistically significant for all ovarian cancer (p-values = 0.01, 0.06, 0.05 and <0.01) as well as for stage I/II invasive ovarian cancer (p-values = 0.01, 0.07, <0.01 and <0.01; ) for the training set (OVA1), and the three validation sets (OVA500, FHCRC#7788 and OVA1-PS1-CO4), respectively.
(A) (left): premenopausal, (B) (middle): post-menopausal, (C) (right): pre-menopausal, stage I/II invasive cancer and benign adnexal masses only. Training set: OVA1 Study, Validation sets: OVA500 Study, FHCRC #7788 and OVA1-PS1-CO4.
AMRA: Adnexal mass risk assessment; AUC: Area under curve; ROC: Receiver operating characteristic.
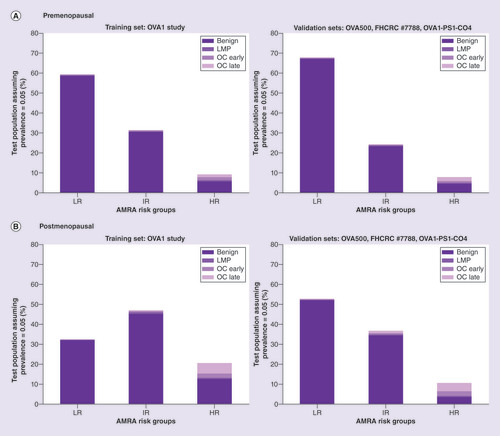
The AMRA rule-in and rule-out cutoff values, at 14.0 IU and 5.0 IU, respectively, for the premenopausal model, and 10.0 IU and 5.0 IU for the postmenopausal model, were established using the training sample set and then fixed in validation. Using the rule-in and rule-out cutoffs, the samples in the three validation sets were combined to estimate and plot the prevalence-adjusted cancer/benign distributions among the three AMRA risk groups (). The raw and prevalence-adjusted proportion of cancer and benign patients within each risk groups are listed in and. In , both prevalence-independent performance metrics such as sensitivity, specificity, and LR+ and LR-, and the prevalence-adjusted estimates such as percentage of test population, PPV and NPV are provided for the individual and meaningful combinations of risk groups. Finally, for easy visualization, plots the prevalence-adjusted projected post-test cancer probabilities of the AMRA risk groups superimposed with an interpolation curve by logistic regression.
Figure 3A (top): premenopausal, Figure 3B (bottom): postmenopausal. Left: training set (OVA1 Study), Right: combined validation Sets (OVA500 Study, FHCRC #7788 and OVA1-PS1-CO4). Exact numbers are listed under ‘Estimates Adjusted for Assumed Pretest Prevalence’ in &.
AMRA: Adnexal mass risk assessment; HR: High risk; IR: Intermediate risk; LR: Lower risk.
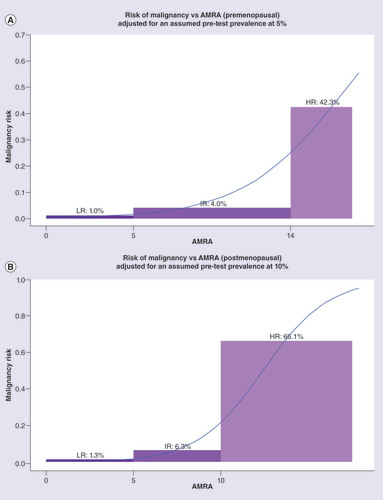
Table 2. Distribution of benign, low-malignant potential tumor/early stage, late stage cancer in premenopausal adnexal mass risk assessment risk groups (actual and projected based on assumed prevalence).
Table 3. Distribution of benign, low-malignant potential tumor/early stage, late stage cancer in postmenopausal adnexal mass risk assessment risk groups (actual and projected based on assumed prevalence).
Table 4. Estimated performance metrics of adnexal mass risk assessment risk groups.
The estimated cancer probability bars were superimposed with an interpolation curve by logistic regression.
AMRA demonstrated sharp differentiation of post-test cancer probabilities across the three risk groups that should be clinically actionable ( with numerical results in &). For both pre- and post-menopausal population, the relatively small HR group (7.9 and 10.6% of test population, respectively) captured over two-thirds of the total cancer cases with PPVs at 42.3 and 66.1%, respectively. When LMPs were excluded, the sensitivity of HR both increased to 75% or above. The LR group identified a significant portion of the test population (67.8 and 52.7% for pre- and post-menopausal, respectively) with an NPV close to 99%. Post-test cancer prevalence in the remaining IR group patients was lower than the assumed pretest prevalence (4.0 and 6.3% for all cancer, or 2.1 and 4.8% excluding LMPs, for pre- and post-menopausal, respectively). also listed the sensitivity and PPV of the combined group of HR and IR to be at 85.9 and 13.3%, respectively for premenopausal patients and 93.1 and 19.7%, respectively, for postmenopausal patients. The sensitivities for invasive cancer only were even higher.
Discussion
AMRA was developed to segregate patients into three groups with highly differentiating post-test cancer probabilities. Under the assumption that the ovarian cancer cases would be similar in terms of histologic subtypes, grades and stages in patients diagnosed with adnexal masses with or without planned surgery, we were able to estimate PPVs and NPVs using the validation datasets individually () [Citation8]. Adjusting for assumed pretest cancer prevalence, we were able to statistically project AMRA potential performance for its intended use in the decision of whether immediate surgery is recommended for the individual validation sets. Finally, to improve statistical stability of the estimated results, the overall validation results were further estimated using the combined validation data, adjusted to the assumed pretest prevalence (&–).
The projected post-test cancer probabilities among the AMRA risk groups, such as PPV for the HR group, and NPV for the LR group, are dependent on the assumed pretest cancer prevalence. The ability of AMRA to segregate patients into highly differential and clinically meaningful risk groups is however further supported by the estimated positive and negative likelihood ratios (LR+ and LR-) which are prevalence-independent measures of how a positive or negative test result might alter the probability of disease. For example, using a simplified interpretation of LRs suggested by Steven McGee [Citation9] the estimated LR+ of >10.0 for the postmenopausal AMRA HR group in the combined validation samples indicates a potential increase of approximately 45 percentage points in cancer probability. Similarly, the estimated LR- of 0.5 for the postmenopausal AMRA LR group, suggests a post-test decrease in cancer probability of approximately 15 percentage points.
As a multivariate index assay, AMRA provided a relatively uniform performance across multiple histological subtypes and performed well for detecting LMPs and stage I/II invasive ovarian cancers. In particular, ROC curve analysis confirmed a statistically significant improvement by AMRA over CA125 overall, as well as in stage I/II ovarian cancer for premenopausal patients for whom the decision of surgery often requires careful consideration.
To aid clinicians in the management of indeterminate masses, key features of AMRA design and actual derivation and implementation included a high sensitivity with its rule-out cutoff resulting a very high NPV for a large portion of the test populations indicated by AMRA as LR. The rule-in cutoff, on the other end, identified a small yet ‘case-enriched’ group of patients, offering a clinically actionable PPV and at the same time captures a majority of the total cancer cases. Based on the independent validation results from the current study and pending further validation in prospective studies, the AMRA algorithm with its two cutoffs seems to be able to provide the desired efficiency in clinical management of patients diagnosed with a suspicious adnexal mass, including recommendation for surgery for HR patients, serial monitoring with ultrasound exam for LR patients, and assessment by clinical impression for IR patients.
Future perspective
There are many reasons a woman with an adnexal mass might wish to avoid immediate surgery if it is safe to do so, including financial cost and the recovery time involved in surgery. However, there is not presently a test on the market specifically aimed at this ‘watch and wait’ population. The purpose of AMRA is to address this need, so that in the future women with adnexal masses might consider to delay surgery based on their physician’s workup and with the added confidence of the test result.
Adnexal mass risk assessment (AMRA) is a multivariate index assay of serum biomarkers developed to stratify women with adnexal masses into three risk groups for the purpose of capturing the relatively small number of malignancies in a high-risk (HR) group with a high positive predictive value, and keeping a low-risk (LR) group with a very high negative predictive value. The high confidence in the AMRA LR result could allow the doctor to include it in a ‘watch and wait’ tool as a part of the workup for an adnexal mass.
The algorithm was developed using retrospective data from prospectively collected samples in previous clinical trials. All serum samples were from women with confirmed adnexal masses who had been scheduled for surgery.
Two separate predictive models (algorithms) were derived for the pre- and post-menopausal patient populations, respectively. For each algorithm, the training dataset was also used to determine a ‘rule-in’ cutoff to identify HR group and a ‘rule-out’ cutoff to identify relatively LR group. The samples between the two cutoffs were classified as intermediate risk (IR).
To project the performance of the AMRA algorithms in its intended population, we assumed a pretest prevalence of 5 and 10% in pre- and post-menopausal test populations, respectively, and estimated clinical performance was calculated.
AMRA demonstrated sharp differentiation of post-test cancer probabilities across the three risk groups that should be clinically actionable. For both pre- and post-menopausal population, the relatively small HR group captured over two-third of the total cancer cases. When low-malignant potential tumors were excluded, the sensitivity of HR both increased to 75% or above.
The LR group identified a significant portion of the test population (67.8 and 52.7% for pre- and post-menopausal, respectively) with an negative predictive value close to 99%.
The sensitivity and positive predictive value of the combined group of HR and IR to be at 85.9 and 13.3%, respectively, for premenopausal patients and 93.1 and 19.7%, respectively, for postmenopausal patients.
As a multivariate index assay, AMRA provided a relatively uniform performance across multiple histological subtypes and performed well for detecting low-malignant potential tumors and stage I/II invasive ovarian cancers with significant improvement over CA125.
Based on the independent validation results from the current study and pending further validation in prospective studies, the AMRA algorithm with its two cutoffs seemed to be able to provide the desired efficiency in clinical management of patients diagnosed with a suspicious adnexal mass, including recommendation for surgery for HR patients, serial monitoring with ultrasound exam for LR patients and assessment by clinical impression for IR patients.
Author contributions
Z Zhang performed design and conceptualization, drafting, data analysis and final approval. RG Bullock performed drafting, data analysis and final approval. H Fritsche performed design and conceptualization, critical editing and final approval. C Dunton performed design and conceptualization and critical editing. L Twiggs performed critical editing.
Ethical conduct of research
The authors state that all clinical trials referenced in this manuscript underwent IRB approval, and all human participants gave informed consent to have their data used.
Financial&competing interests disclosure
This research and manuscript were funded by Vermillion, Inc. Herbert Fritsche is an employee of ASPiRA Labs, a subsidiary of Vermillion, Inc. Rowan G Bullock is an employee of Vermillion, Inc. Zhen Zhang is a consultant with Vermillion, Inc., however contributed to this work in a personal capacity and is independent of his affiliation with Johns Hopkins University. Vermillion, Inc. provided funding for this study. The authors have no other relevant affiliations or financial involvement with any organization or entity with a financial interest in or financial conflict with the subject matter or materials discussed in the manuscript apart from those disclosed.
No writing assistance was utilized in the production of this manuscript.
Data sharing statement
The authors certify that this manuscript reports the secondary analysis of clinical trial data that have been shared with them, and that the use of this shared data is in accordance with the terms (if any) agreed upon their receipt. The source of this data is: OVA1-001-CO1, OVA1-001-CO3, OVA1-7788, OVA1-PS1-CO4. As the data are proprietary, no individual clinical trial data will be shared other than the statistical summaries already available.
Additional information
Funding
References
- Demir R , MarchandG. Adnexal masses suspected to be benign treated with laparoscopy. J. Soc. Laparoendosc. Surg.16(1), 71–84 (2012).
- Farghaly S . Current diagnosis and management of ovarian cysts. Clin. Exp. Obstet. Gynecol.41(6), 609–612 (2014).
- Sadowski E , ParoderV, Patel-LippmannKet al. Indeterminate adnexal cysts at US: prevalence and characteristics of ovarian cancer. Radiology287(3), 1041–1049 (2018).
- Modesitt S , PavlikE, UelandFet al. Risk of malignancy in unilocular ovarian cystic tumors less than 10 centimeters in diameter. Obstet. Gynecol.102(3), 594–599 (2003).
- Ueland F , DesimoneC, SeamonLet al. Effectiveness of a multivariate index assay in the preoperative assessment of ovarian tumors. Obstet. Gynecol.117, 1289–1297 (2011).
- Bristow R , SmithA, ZhangZet al. Ovarian malignancy risk stratification of the adnexal mass using a multivariate index assay. Gynecol. Oncol.128, 252–259 (2013).
- Coleman R , HerzogT, ChanDet al. Validation of a second-generation multivariate index assay for malignancy risk of adnexal masses. Am. J. Obstet. Gynecol.215(1), 82.e1–82.e11 (2016).
- Molinaro A . Diagnostic tests: how to estimate the positive predictive value. Neuro Oncol. Practice2(4), 162–166 (2015).
- McGee S . Simplifying likelihood ratios. J. Gen. Intern. Med.17(8), 646–649 (2002).