
Abstract
The aim of the present study was to determine cell of origin (COO) from a platform using a DNA-based method, COO DNA classifier (COODC). A targeted exome-sequencing platform that applies the mutational profile of a sample was used to classify COO subtype. Two major mutational signatures associated with COO were identified: Catalogue of Somatic Mutations in Cancer (COSMIC) signature 23 enriched in activated B cell (ABC) and COSMIC signature 3, which suggested increased frequency in germinal center B cell (GCB). Differential mutation signatures linked oncogenesis to mutational processes during B-cell activation, confirming the putative origin of GCB and ABC subtypes. Integrating COO with comprehensive genomic profiling enabled identification of features associated with COO and demonstrated the feasibility of determining COO without RNA.
Lay abstract
To determine subtypes of diffuse large B-cell lymphoma (DLBCL), a cancer with poor survival, we aimed to identify DLBCL subtypes using DNA mutation-based tools. A targeted gene-sequencing platform, which measures the number and types of DNA mutations in a sample, was used to categorize DLBCL subtypes. Two major patterns of mutations associated with subtypes were identified: Catalogue of Somatic Mutations in Cancer (COSMIC) signature 23 and COSMIC signature 3. Differences in how the subtypes developed suggest a link between tumor developments and B cells being activated normally, confirming where the DLBCL subtypes came from. Combining this information with comprehensive genomic profiling, which determines all of the genes that a person has, allowed identification of features that are associated with DLBCL subtypes and showed that a DLBCL subtype can be determined without using RNA.
Diffuse large B-cell lymphoma (DLBCL) is the most common form of non-Hodgkin's lymphoma, accounting for more than 25,000 new cases per year in the United States [Citation1]. Five-year survival rates are 55–62% [Citation1], yet nonresponders to standard of care and relapsed patients have limited options, primarily consisting of autologous stem cell transplants or clinical trials. In addition, DLBCL can be further subdivided into activated B-cell (ABC) and germinal center B-cell (GCB) subtypes, with the GCB subtype having a significantly higher response rate to rituximab, cyclophosphamide, doxorubicin, vincristine and prednisone (R-CHOP). Due to these therapeutic implications, cell-of-origin (COO) classification was incorporated into the 2016 updated World Health Organization (WHO) lymphoid neoplasm classifications [Citation2].
COO subtyping was originally developed using RNA expression microarrays [Citation3] and is a recommended component of DLBCL clinical care [Citation2]. RNA-based classifiers commonly split DLBCL into the ABC and GCB subtypes. DLBCL that does not fall into either of these categories is called unclassified (14–18% [Citation4–6] by microarray). However, in most clinical settings, it is not feasible to perform microarray analyses for each patient. A simpler, more streamlined RNA-based method, NanoString Lymph2Cx, has been developed [Citation5]. This method uses RNA expression from 20 genes to determine COO with 98% concordance to microarray and 8.8% unclassified calls compared with 14.7% by the gold standard microarray. While this method holds great promise for clinical use, it requires RNA with 60% tumor purity to achieve this accuracy [Citation5], a purity that is not always routinely available. Immunohistochemistry (IHC)-based algorithms have also been developed to approximate COO. The most widely used of these is the Hans' algorithm [Citation7], which can classify GCB and non-GCB DLBCL, the latter of which includes both ABC and unclassified subtypes. Unfortunately, these algorithms do not reliably recapitulate the original prognostic findings, and in some cases, IHC-based algorithms show no significant survival difference between GCB and non-GCB [Citation8,Citation9]. Similar results were obtained in clinical trial populations using the Lymphy2Cx NanoString predictor [Citation10].
While COO subtyping is historically expression based, COO subtypes also have different mutational profiles. GCB is typically characterized by alterations such as short variants in EZH2 [Citation11] and IGH:BCL2 translocations [Citation12,Citation13], while ABC is dominated by NF-KB and BCR signaling pathway alterations such as MYD88 [Citation14] and CD79B [Citation13,Citation15]. Scherer and colleagues showed that it is possible to use mutations in these genes - along with features such as CREBBP and SGK1 mutations, double-hit status, and IGH V-gene usage - to classify patients into GCB and non-GCB subsets, and created a classifier based on circulating tumor DNA (ctDNA) profiles of tumor mutations [Citation16]. Additionally, Chapuy and colleagues (as well as other groups) recently showed distinct trinucleotide mutational signatures in DLBCL samples, including a canonical activation-induced cytidine deaminase (AID) signature [Citation17]. Although previous reports have not identified mutational signature differences between subtypes, the authors hypothesize that given the distinct histories of the precursor cells, there may be differences in mutational profiles of GCB and ABC tumors. GCB DLBCLs are thought to arise from germinal center (GC) B cells, while the ABC subtype is thought to arise from post-GC B cells. During the antibody maturation process, GC B cells are subject to class switch recombination (CSR) and somatic hypermutation (SHM) induced by AID protein that induces double-strand breaks (DSB) and single-base mutations. Recent studies have shown that certain genes in DLBCL tumors show frequent AID-induced alterations [Citation17,Citation18] and certain DLBCL-related genes, such as PIM1, are thought to be hotspots for off-target AID activity.
In previous reports [Citation13] the authors detailed the genomic landscape of DLBCL using the Foundation Medicine, Inc. (FMI) platform. In the current work, those results were extend to show that targeted exome sequencing can also be useful for determining COO status. A DNA-only classifier using FMI's FoundationOne® Heme platform, which uses the mutational profile of a sample to classify COO subtype, is presented.
Methods
Samples
Clinical and genomic data were available from patients treated in the GOYA (NCT01287741; R-CHOP vs G-CHOP) [Citation19] and MAIN (NCT00486759; R-CHOP +/- bevacizumab) [Citation20] clinical trials. The protocols of the original GOYA and MAIN clinical trials were approved by local or national ethics committees according to the laws of each country, and the studies were performed in accordance with the Declaration of Helsinki. Median follow-up durations were 24 months and 29 months for MAIN and GOYA, respectively (≈ 30% of progression-free survival [PFS] events in both cohorts). ABC, GCB and unclassified DLBCL subtypes were determined by the NanoString research-use-only Lymphoma Subtyping Test (LST) assay. Routine clinical care samples (hereafter referred to as FM-Clinical samples) were sequenced as part of routine clinical care, and clinical correlate data are not available. The use of clinical samples from FM-clinical in this study and the consent procedure were reviewed and approved by the Western Institutional Review Board. Patient consent was obtained at the time of testing.
DNA sequencing
All samples were sequenced using only the DNA component of the FoundationOne®Heme platform in a Clinical Laboratory Improvement Amendment–certified, College of American Pathologist-accredited, and New York State-approved laboratory (Foundation Medicine Inc., MA, USA). FoundationOne®Heme uses hybrid capture-based targeted DNA sequencing to evaluate all coding exons of 465 genes plus select introns from 31 genes frequently rearranged in cancer as described by He and colleagues [Citation21]. In brief, DNA was extracted from formalin-fixed paraffin-embedded (FFPE) specimens with at least 20% tumor content and sequencing was performed to at least 150x median coverage using Illumina sequencers (CA, USA). As matched normal tissue was not sequenced, known nonpathogenic germline variants were removed utilizing 1000 Genomes Project (dpSNP142), ExAC and an internally developed algorithm to remove recurrent variants of unknown significance predicted to be germline [Citation22]. In addition to validated [Citation21] base substitutions, indels, copy number alterations (high-level amplifications and deep deletions), rearrangements, tumor mutational burden (TMB) [Citation23] and microsatellite instability (MSI) status, research-use-only features were utilized, including chromosomal arm-level copy number and loss of heterozygosity metrics [Citation22].
Statistics
Feature enrichment was assessed using the NanoString-assigned COO. Binary feature enrichment was determined using a Fisher's exact test. Continuous feature enrichment was determined using a Wilcoxon-Mann-Whitney test. Univariate hazard ratios (HR) and p-values for the association of COO subtypes with PFS were calculated using Cox regression.
Machine learning
The cell-of-origin DNA classifier (COODC) model was developed using a penalized Lasso regression using 25-fold internal cross validation from the glmnet package (version 2.0–10) in R (version 3.3.2) and using RStudio (version 1.0.136). A total of 594 features were available in the model. Continuous features were z-scored to maintain a consistent scale between continuous and binary features. The final COODC model included 74 features with nonzero coefficients (Supplementary Table 1). Per-sample probabilities returned from the model were used to determine the ideal cutoffs. Receiver operating characteristic (ROC) curves were generated (Supplementary Figure 1), and a cutoff was chosen to optimize specificity and sensitivity. To generate an unclassified zone, 10% was added on either side of the optimal cutoff The probabilities were then extracted for the test set and for 44 validation samples from the MAIN clinical trial. These two test and validation sets were used to determine the accuracy of the model.
Mutational signatures
Mutational signatures were determined as described by Zehir and colleagues [Citation24] and involved trinucleotide matrices that were decomposed into the 30 Catalogue of Somatic Mutations in Cancer (COSMIC) signatures [Citation25]. Signatures were aggregated to APOBEC (signatures 2 and 13), smoking (signature 4), BRCA (signature 3), mismatch repair (MMR; signatures 6, 15, 20 and 26), aging (signature 1), UV (signature 7), POLE (signature 10) and alkylating (signature 11). All point mutations except driver alterations and predicted germline alterations were included. A sample was deemed to have a dominant signature if a mutational class reached a score of 0.4 or greater. Mutations were considered in all regions baited for short variant detection excluding regions with known sequencing artifacts. Samples were considered only if they had 20 or more assessable mutations.
Results
Cell-of-origin DNA classifier: a genomically defined model for cell of origin
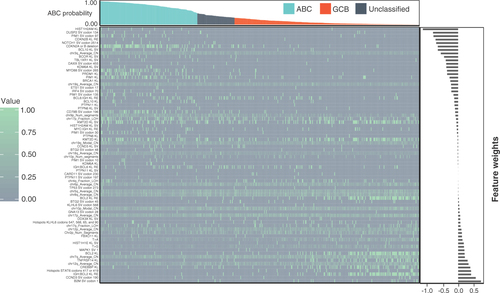
A total of 482 DLBCL samples from the GOYA study that had DNA sequenced with FoundationOne®Heme were split into two sets: 70% into a training set and 30% into a held-out test set. The held-out test set was used after the model was complete to determine concordance. The training set was further subdivided to include only samples with either an ABC or GCB call as determined by NanoString; unclassified samples or samples without a call were excluded. The training set data were used to train a penalized logistic regression model to identify ABC or GCB samples using DNA-based features without the need for RNA. A total of 594 features were available to train the model, including binary features of any alteration in a gene, specific alterations (codons) and hotspot alterations (any one of multiple codons) that occurred at least five times in the GOYA dataset as well as derived DNA-based features such as TMB, chromosome arm-level copy number and zygosity metrics, and frequency of alteration classes (e.g., T mutated to A). These features were selected to optimize the available data to train on while minimizing overfitting due to inclusion of rare features. The resulting model, COODC, contained a total of 74 genomic features and generated a continuous probability score ranging from 0 to 0.999, which reflected the probability of a sample being ABC (). The 74 genomic features included 18 arm-level alteration features, including copy number and loss of heterozygosity features, 32 gene short variant features, 6 rearrangement-based features, 13 gene-level features (including copy number, rearrangement and short variant alterations) and various other summary features (including T>A mutation prevalence).
Heatmap indicating the score for each nonzero feature for each sample. For binary features, a value of 1 (green) indicates presence while a value of 0 (grey) indicates absence. For continuous features, values are normalized within each feature so the maximum value is set to 1 and minimum to 0. Bar graph at top indicates ABC probability score assigned to sample from the cell-of-origin DNA classifier, with colors indicating cutoff for ABC (blue), unclassified (grey) and GCB (orange). Bar graph on right indicates the weight value for each nonzero feature.
KL: Known or likely pathogenic; RE: Rearrangement; SV: Short variant.
Biological significance of features included in the cell-of-origin DNA classifier model
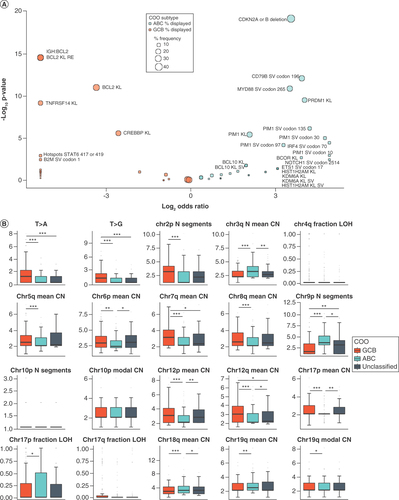
Many of the features included in the model were independently significantly enriched among the ABC or GCB subsets. These include previously reported alterations such as IGH:BCL2 rearrangements [Citation12,Citation13] and TNFRSF14 alterations [Citation6,Citation13] highly enriched in GCB samples and chromosome 3q copy number increase [Citation26], CDKN2A/B [Citation27] deletion, CD79B Y196 mutations [Citation13,Citation15] and MYD88 L265 mutations [Citation14] highly enriched in ABC samples (). New features of particular interest were also identified, including the frequency of T>A and T>G alterations, the average copy number of chromosome 6p and the number of copy number segments of chromosome 9p (). Both T>A and T>G alteration frequencies in nonpathogenic alterations were higher in GCB (p < 0.0001 for both; ). T>A and T>G frequencies excluded pathogenic alterations to prevent evolutionary selection from biasing the counts, and rather focus on underlying mutational mechanisms. A lower mean copy number of chromosome 6p, which encodes the HLA locus, was found in ABC (p = 0.0064). The number of modeled segments on chromosome 9p, which includes CD274 and PDCD1LG2, was higher in ABC (p < 0.0001), suggesting that regions of this arm are fractured, potentially leading to differences in gene copy number, which may contribute to observed differences in programmed death-ligand 1 (PD-L1) expression [Citation28–30]. In addition to features specifically enriched in ABC or GCB, the truly intermediate nature of unclassified samples was also shown. Analysis identified enrichment of novel features, such as IGH:BCL6 rearrangements (Supplementary Figure 2), as well as enrichment of ABC- or GCB-like features, such as the average copy number of chromosome 6p in which unclassified was similar to GCB, and the T>A alteration frequency in which unclassified was similar to ABC (). The authors have previously described [Citation13] IGH:BCL6 as enriched in non-GCB (as determined by Hans algorithm), which includes both ABC and unclassified samples. The current work furthers this observation and suggests the importance of treating ABC and unclassified samples as separate subsets of DLBCL. Interestingly, many of the features included in the model were not significantly enriched in ABC or GCB subtypes, which suggests that some features may be important aspects of prediction only in combination with or in the absence of other features, and highlights that these features generate a meaningful COO classification determination only when combined in the final model, and not in isolation.
Enrichment was assessed using NanoString-assessed cell of origin. (A) Enrichment for all binary features with nonzero weights in the model. Enrichment in ABC is indicated by blue dots (Log2 odds ratio >0), and enrichment in GCB is indicated by orange dots (Log2 odds ratio <0). Size of dot indicates the frequency of the feature in the enriched group. Labels indicate features with significant enrichment (p < 0.05). (B) Enrichment for continuous features with nonzero weights in the model. Horizontal line in each box represents the median of the feature while lower and upper bounds of the box represent 25th percentile and 75th percentile, respectively. Whiskers extend to extreme values no more than 1.5-times the interquartile range beyond the box. Points beyond whiskers are considered outliers and are plotted individually. N Segments indicates number of segments. T>A and T>G indicate a point mutation from T to A or G. *p < 0.05; **p < 0.01; ***p < 0.001.
ns: Not significant.
Cell-of-origin DNA classifier model performance
To define optimal cutoffs for the continuous probability score, an initial cutoff was set by maximizing Youden's J statistic (the point with the highest total sensitivity and specificity; Supplementary Figure 1A) in the training set and a 0.1 probability buffer was added on both sides of the initial cutoff to define the unclassified region (Supplementary Figure 1B). This parameter resulted in similar subtype breakdowns across the entire GOYA dataset, with 57.9% GCB, 30.3% ABC and 11.8% unclassified as determined by COODC, compared with 54.5% GCB, 26.5% ABC and 15.6% unclassified as determined by NanoString (3.4% of cases were not submitted to NanoString for COO typing; ). While the cutoff applied to the model output could be optimized in many ways, the authors chose to optimize the cutoff for maximum accuracy. However, an alternative approach would be to optimize accuracy within an individual subset, such as ABC. Overall, the accuracy for predicting GCB (versus non-GCB) within the held-out test set was 79.8%, with 79.1% accuracy for predicting ABC (versus non-ABC). Excluding samples considered unclassified by either method, the COODC and NanoString methods were 88.5% concordant (). Of 75 samples that NanoString considered GCB, 59 (78.7%) were also called GCB by COODC, 9 (12%) were called unclassified and 7 (9.3%) were incorrectly classified as ABC. Similarly, of 33 ABC calls by NanoString, 26 (78.8%) were called ABC by COODC, 3 (9.1%) were called unclassified and 4 (12.1%) were incorrectly classified as GCB ( and ). Of note, 12/13 double-hit (BCL2 and MYC translocations determined by FISH) samples in GOYA were classified by COODC as GCB and 1/13 as unclassified (p = 0.01). In addition, concordance was assessed with NanoString on an independent validation study cohort (MAIN clinical trial) of 44 samples. In this validation cohort, COODC demonstrated continued high concordance with 86.4% accuracy for predicting GCB and 84.1% accuracy for ABC (Supplementary Figures 3A & C & ). The COODC model was further applied to an independent set of 585 FM-clinical samples (Supplementary Figure 3B). Although a gold standard COO assessment was not available for comparison, similar breakdowns of COO type were found by COODC as in the GOYA samples, with 60% GCB, 29% ABC and 10% unclassified.
(A) Pie graphs showing the overall breakdown of COO for all GOYA samples as determined by NanoString or COODC. (B) Pie graphs showing the breakdown of COODC COO calls within each NanoString COO group. Survival curves indicating progression-free survival for (C) COODC-determined COO groups from (C) GOYA validation and (D) MAIN validation and (E) COODC-determined COO compared with NanoString determined COO.
COO: Cell of origin; COODC: Cell-of-origin DNA classifier.
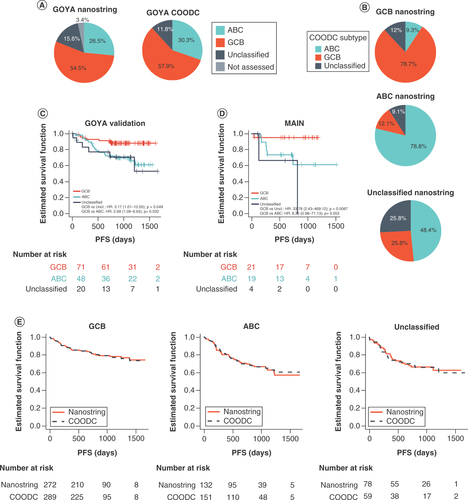
Table 1. ConcordanceTable Footnote† (count) of cell-of-origin DNA classifier algorithm with NanoString cell-of-origin calls.
The investigators next assessed the potential clinical utility of stratifying patients by COODC in the two validation cohorts. Significantly reduced PFS was observed among samples classified by COODC as ABC (GOYA validation HR: 2.69, 95% CI: 1.1–6.6; p = 0.032; MAIN HR: 8.35, 95% CI: 0.98–71; p = 0.052) or unclassified (GOYA validation HR: 3.17, 95% CI: 1.0–10.0; p = 0.049; MAIN HR: 33.8, 95% CI: 2.4–469.1; p = 0.008) when compared with GCB samples ( & D), with similar significant differences observed in the total GOYA population (Supplementary Figure 4). PFS was also compared when stratified by COODC versus NanoString, and PFS estimates were highly consistent across the two methodologies (), with a HR of 1.66 for NanoString-based ABC (1.64 for CCODC) and 1.74 for NanoString-based unclassified (1.88 for COODC) compared with NanoString-based GCB. These data indicated stratification of patients into prognostically meaningful COO subgroups that can be achieved by utilizing a DNA-only COO model, such as COODC.
Mutational signatures identified in diffuse large B-cell lymphoma
The observed difference in T>A and T>G alterations led the authors to investigate differences in mutational signatures. Given the role of AID in SHM and CSR in normal germinal center B cells, the proposed role in transformation to lymphoma, and recent data from Chapuy and colleagues [Citation17] showing distinct mutational signatures in DLBCL, we investigated whether there was evidence of AID mutational processes across all alterations. Using trinucleotide mutational signatures identified in COSMIC [Citation24,Citation25], 26% of COODC-GCB samples in GOYA and 25% in FM-clinical were found to have a dominant COSMIC signature 3 compared with 16% (GOYA) and 17% (FM-clinical) of ABC (combined datasets: p = 0.05). In contrast, 14% of COODC-ABC samples in GOYA and 27% in FM-clinical had a dominant COSMIC signature 23 compared with only 1.7% of GOYA and 1.1% of FM-clinical GCB (p < 0.0001; ).
(A) Plots of trinucleotide context for signatures 3 (top) and 23 (bottom). (B) Frequency of mutational signatures by cell-of-origin DNA classifier type in GOYA (left) and FM-clinical (right). Only samples with ≥20 assessable mutations were included. If no dominant signature (no signature with >0.4 score) was detected, signature is reported as none. (C) Box and whisker of all alterations assessed for trinucleotide context (left) and for tumor mutational burden (right) in GOYA indicating median by the horizontal line while lower and upper bounds of the box represent 25th percentile and 75th percentile, respectively. Whiskers extend to extreme values no more than 1.5-times the interquartile range beyond the box. Points beyond whiskers are considered outliers and are plotted individually. *p < 0.05; **p < 0.01; ***p < 0.001.
ns: Not significant.
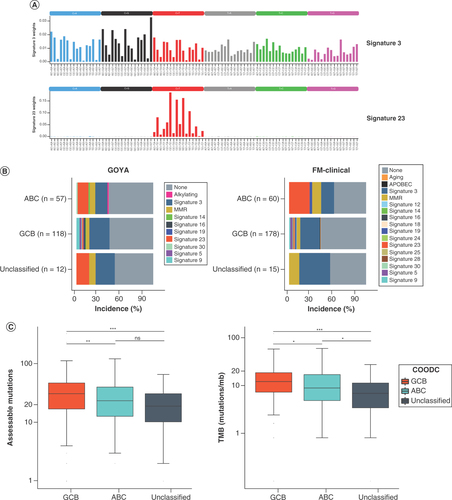
Signature 23 was dominated by the trinucleotide context in which C is altered to T (). Of the main trinucleotide contexts, three out of five were found in the R[C]Y context (). This signature was similar to WR[C]Y, a common context for AID targeting somatic hypermutation, suggesting a strong AID mutational signature in a subset of ABC. Notably, this was not the result of fewer overall mutations in the GCB subset; the total mutation count was higher on average in GCB subsets compared with ABC (31 in GCB vs 23.5 in ABC, p = 0.002; ). Therefore, it appears there were distinct mutational processes active within the different COO subsets.
Discussion
Here we present a clinically relevant method for determining the COO for DLBCL samples with as little as 20% tumor purity and without needing RNA or matched normal tissue. This method was approximately 80–86% concordant with NanoString expression-based assays compared with a test set as well as an independent validation cohort. Importantly, this method resulted in similar PFS for samples from the GOYA study compared with the NanoString-determined COO, showing a worse PFS for ABC and unclassified samples compared with GCB. We found copy number alterations of chromosome 6p and 9p as well as the frequency of T>A and T>G transversions to be distinct between ABC and GCB subtypes. In addition, the use of mutational features to identify COO allowed the determination of mutational subsets in DLBCL in parallel, including BCL2/EZH2 and MYD88/CD79B subsets. Finally, the mutational signatures underlying ABC were different from those found in GCB, suggesting differing roles of AID in development of these two subtypes.
Current WHO guidelines [Citation2] include COO determination for newly diagnosed DLBCLs, but it is clinically challenging to obtain a standardized, rigorous determination for most samples. IHC algorithms vary in both feasibility and utility of the results [Citation7–9]. The NanoString assay has begun to emerge as a more clinically feasible alternative that evaluates the expression of a small subset of genes. However, the published validation [Citation5] for this assay, which is 98% concordant with the microarray assay, requires >60% tumor content as well as high quality RNA, which is often not available in the clinical setting. Here we described a new classifier that was approximately 80–86% concordant with NanoString, required only 20% tumor content, and did not require RNA, an analyte which is more susceptible to degradation than DNA. Based on data from FM-clinical, an estimated 50% of DLBCL samples would not be eligible or results may be unreliable for expression-panel COO determination (such as NanoString) due to either missing RNA or having <60% tumor purity. This method, if applied clinically, could greatly increase the number of samples with a reliable COO determination. With further refinement or combination with IHC, a DNA-based approach to COO classification may achieve even higher concordance while continuing to maintain the attractive aspects that increase the assessable number of samples.
The COODC algorithm confirmed the feasibility of predicting COO subtypes from molecular features, first demonstrated with the ctDNA-based COO prediction algorithm from Scherer et al. [Citation16]. Both tests showed similar concordance with gene expression–based classification (80% for Scherer et al. vs 80–86% reported here), although the Scherer et al. method was only benchmarked against the IHC-based Hans algorithm, and does not predict an unclassified subset. Additionally, while both algorithms identified a common subset of important genomic features, the present results suggest there is a variety of high-level genetic differences that are useful for differentiating COO subsets. Ideally, methods for differentiating subtypes of DLBCL based on genomic data should consider all of these features.
By investigating the biological significance of some features used in this model, expected DNA alterations enriched in subtypes were identified, such as BCL2 rearrangements in GCB and MYD88 L265 and CD79B alterations in ABC. BCL6 rearrangements were confirmed to be uniquely enriched in the unclassified samples, which appeared to have a distinct, albeit intermediate, set of DNA alterations. In addition, we found new features related to potential immune evasion enriched in ABC, including a lower copy number of chromosome 6p, which encodes the HLA locus; and increased segmentation of chromosome 9p, which includes the genes that encode PD-L1 and PD-L2 proteins and the CDKN2A/B genes. This, coupled with the GCB enrichment of B2M nonstart alterations (B2M SV codon 1; ), which is a required component of the class I major histocompatibility complex and is therefore involved in neoantigen presentation, may point to a potential biological significance of immune evasion that would be worth investigating. This result is especially interesting considering the relatively high TMB (median = 10.5 mutations/mb in GOYA) found in all DLBCL subtypes (). Patients with TMB values over 10 have been reported to respond well to immune checkpoint inhibitor therapy in some disease types, such as non-small cell lung cancer [Citation31]. However, alterations such as B2M loss suggest potentially different immune evasion mechanisms that may not be amenable to therapies requiring neoantigen presentation, such as checkpoint inhibitors. Additionally, a recent trial of the checkpoint inhibitor nivolumab showed limited efficacy in patients with relapse and refractory DLBCL [Citation32].
Recent publications from Schmitz and colleagues [Citation18] and Chapuy and colleagues [Citation17] show that more granular classification of DLBCL utilizing genomic alterations can provide insight into prognosis. The present COO prediction model shared overlap with the mutations highlighted by these studies. Alterations in BCL2, EZH2, and TNFRSF14 were all found to be important predictors of the GCB phenotype, consistent with the enrichment of GCB samples among the EZB cluster in Schmitz et al. [Citation18] or C3 in Chapuy et al. [Citation17]. Similarly, mutations in MYD88 and CD79B were predictive of ABC phenotype. Interestingly, mutations in NOTCH1, NOTCH2, and BCL6 were all slightly predictive of ABC subtype, despite the mixed phenotype of the BN2, N1 (Schmitz [Citation18]) and C1 (Chapuy [Citation17]) groups. However, these alterations were given less weight than other ABC-specific alterations, meaning that mutated samples would be more likely to fall into the unclassified subgroup and the context in which these alterations occur may be important to determining subtype. These results suggested many of the genomic groups identified by Schmitz [Citation18] and Chapuy [Citation17] overlap with the genomically defined COODC groups, and that the COODC classifier could be extended to identify more specific mutational subsets of DLBCL.
In addition to these previously defined prognostic subgroups, DNA-based COO classification enabled identification of additional biomarkers for potential therapeutic value. For example, the BCR-dependent subgroup, defined by the presence of a CD79B predicted-deleterious alteration, was present in 24.5% of the ABC GOYA study samples (9.4% overall in GOYA) and 22.7% of the ABC FM-clinical samples (8.0% overall in FM-clinical samples), with potential predictive implications for ibrutinib as shown by Wilson and colleagues [Citation33]. TP53 wild type, EZH2 alterations and BCL2 alterations, all of which have potential as emerging biomarkers for therapeutic opportunities in DLBLC, were also identified. Given these potential new biomarkers, it is clear that adding COO calling capabilities to next-generation sequencing can provide both prognostic and potentially therapeutically relevant actionability information for patients with DLBCL.
Interestingly, we found some similarities in trinucleotide mutational signatures to those identified by Chapuy and colleagues [Citation17]. Two major mutational signatures were identified in DLBCL samples: COSMIC signature 3, annotated as a BRCA signature, and COSMIC signature 23. COSMIC signature 23, found primarily in the ABC subtype, has frequent alterations in the R[C]Y context, suggesting a canonical AID signature. Interestingly, COSMIC signature 3 is common among all DLBCL subtypes, found as the dominant signature in 26% of GCBs, 16% of ABCs and 33% of unclassified from COODC samples (GOYA + FM-clinical combined) when a signature could be determined. Given that COSMIC signature 3 appears to capture the effects of DSB resolved by non-homologous end joining (NHEJ) when BRCA1/2 is absent, this signature may be capturing the resolution of AID-induced DSB, which also uses NHEJ [Citation34], and is essential for CSR.
Although Chapuy and colleagues identify aging as the predominant mutational signature [Citation17], we identified only one sample (out of 443 total assessable samples) with a dominant aging-related signature in our datasets. This finding most likely relates to differences in signature calling algorithms. Chapuy and colleagues defined aging based on the frequency of CpG site deamination. MMR signatures (such as COSMIC signature 6) are distinguishable from aging in COSMIC but have many C-to-T alterations within a CpG context. Additionally, Arthur and colleagues [Citation35] recently performed de novo signature inference showing some mutational signature differences between ABC and GCB subtypes. Although these de novo signatures are mapped back to the 30 COSMIC signatures, none of the described de novo signatures mapped to COSMIC signature 23, and the de novo signature mapping to COSMIC signature 3 was not significantly different between ABC and GCB subtypes. Interestingly, a recent preclinical study from Pascual and colleagues [Citation36] suggests that AID may be continually expressed in ABC DLBCLs.
The current model of DLBCL oncogenesis hypothesizes that GCBs originate from an earlier germinal center B cell, while ABCs originate from a developmentally more advanced post or late germinal center cell. The support for this hypothesis has been primarily based on RNA expression similarities between activated peripheral blood B cells and ABC DLBCL, and germinal center B cells and GCB DLBCL [Citation3,Citation4,Citation12]. The COO-specific differences in mutational signatures further validate this model whereby GCBs originate from a cell that has experienced the mutational stress of AID-mediated DSB, while ABCs originate from a cell that has undergone mutational stress related to both AID-mediated DSB and AID-mediated single base alterations. This concept is especially interesting given that there is only a small difference in TMB between ABC and GCB subtypes (median ABC: 8.9, GCB: 12.1, p = 0.011), and that there is a slightly lower number of mutations assessable for mutational signature calling (including silent and noncoding alterations) in ABC than in GCB (median ABC: 23.5, GCB: 31, p = 0.0019). While some ABC samples experience both AID-mediated DSB and AID-mediated single base alterations, many GCB samples appear to mainly experience AID-mediated DSB, the mutational processes that lead to transformation, may result in similar overall mutational burden. The similar signature exposure between ABC and GCB for COSMIC signature 3 found by Arthur and colleagues [Citation35] supports this model where AID-mediated DSB (as represented by COSMIC signature 3) is a common process in both ABC and GCB subtypes. Thus, mutational signature analysis links mutations in DNA to the biological processes occurring in the cell of origin at the time of transformation.
Conclusion
We presented a method for determining COO using a clinically utilized next-generation sequencing platform for variant calling. The addition of COO calling capabilities to such a platform may provide enhanced value for clinical decision-making and biologic insights. Furthermore, combining next-generation sequencing data with the COODC calls enabled identification of potential avenues for further investigation, including the role of genomic alterations in immune evasion and the mutational signature differences across COO subtypes.
Summary points
This analysis used NanoString gene expression–based calls from clinical trial samples, including detection of common rearrangements and copy number alterations, for the classification of diffuse large B-cell lymphoma (DLBCL) into activated B cell (ABC), germinal center B cell (GCB), and unclassified subtypes.
The COODC calls confirmed the feasibility of predicting COO subtypes from molecular features with 80–86% concordance and required only 20% tumor content, which was comparable with IHC algorithms.
The COODC classifications reliably recapitulated the prognostic differences observed with NanoString-based COO classifications for samples from the GOYA study, showing a worse PFS for ABC and unclassified samples compared with GCB.
Copy number alterations of chromosome 6p and 9p as well as the frequency of T>A and T>G transversions were distinct between ABC and GCB subtypes.
The mutational signatures linked oncogenesis to natural mutational processes during B-cell activation, confirming the putative origin cell of GCB and ABC subtypes, and suggesting the differing roles of AID in development of these two subtypes.
Combining next-generation sequencing data with the COODC calls identified future avenues for investigation, including the role of genomic alterations in immune evasion and the mutational signature differences across COO subtypes.
Author contributions
Contribution: SET, ESS, JAM, GMF, LAA, LHS, MZO and CRB performed experiments and collected data; SET and CRB analyzed data and made the figures; SET, LAA and CRB designed the research; SET, ESS, JAM, SLM, LAA and CRB prepared the manuscript; and all authors approved the final manuscript.
Ethical conduct of research
The authors state that they have obtained appropriate institutional review board approval or have followed the principles outlined in the Declaration of Helsinki for all human or animal experimental investigations. In addition, for investigations involving human subjects, informed consent has been obtained from the participants involved.
Data sharing statement
The authors certify that this manuscript reports the secondary analysis of clinical trial data that have been shared with them, and that the use of this shared data is in accordance with the terms (if any) agreed upon their receipt. The source of this data is: NCT01287741 and NCT00486759. Model feature weight data can be found in the supplemental tables. Access to clinical trial data can be requested by contacting the lead author. Samples from the FM-clinical dataset are not consented for individual data release.
Additional file 1
Download PDF (842.4 KB)Additional file 1
Download PDF (84.7 KB)Additional file 1
Download PDF (813.8 KB)Additional file 1
Download PDF (101.4 KB)Additional file 1
Download MS Excel (11 KB)Supplemental Tables
Download MS Word (13.2 KB)Acknowledgments
The authors thank Vincent Miller and Rishard Salie for their critical insights and input.
Supplementary data
To view the supplementary data that accompany this paper please visit the journal website at: www.tandfonline.com/doi/suppl/10.2217/fon-2021-0370
Financial & competing interests disclosure
SET, ESS, JAM, GMF, LAA and JV are employees of Foundation Medicine, Inc. SLM and CRB are employees of Genentech, Inc. SET, ESS, SLM, JAM, GMF, LAA, MZO, JV and CRB have ownership interest in Roche. LHS holds consultancy and honoraria with Roche, Genentech, Abbie, Amgen, Celgene, Janssen, Lundbeck, Seattle Genetics, Merck, TG Therapeutics, Mophosys and Karyopharm. This study was supported by Foundation Medicine, Inc., Genentech, Inc., and F. Hoffmann-La Roche Ltd. The authors have no other relevant affiliations or financial involvement with any organization or entity with a financial interest in or financial conflict with the subject matter or materials discussed in the manuscript apart from those disclosed.
No writing assistance was utilized in the production of this manuscript.
Additional information
Funding
References
- TL R , DCE, CJR, MLM, AhmedinJ, FCR. 2016 US lymphoid malignancy statistics by World Health Organization subtypes. CA Cancer J. Clin.66(6), 443–459 (2016).
- Swerdlow SH , CampoE, PileriSAet al. The 2016 revision of the World Health Organization classification of lymphoid neoplasms. Blood127(20), 2375–2390 (2016).
- Alizadeh AA , EisenMB, DavisREet al. Distinct types of diffuse large B-cell lymphoma identified by gene expression profiling. Nature403, 503–511 (2000).
- Lenz G , WrightG, DaveSSet al. Stromal Gene Signatures in Large-B-Cell Lymphomas. N. Engl. J. Med.359(22), 2313–2323 (2008).
- Scott DW , WrightGW, WilliamsPMet al. Determining cell-of-origin subtypes of diffuse large B-cell lymphoma using gene expression in formalin-fixed paraffin-embedded tissue. Blood123(8), 1214–1217 (2014).
- Reddy A , ZhangJ, DavisNSet al. Genetic and functional drivers of diffuse large B-cell lymphoma. Cell171(2), 481–494 (2017).
- Hans CP , WeisenburgerDD, GreinerTCet al. Confirmation of the molecular classification of diffuse large B-cell lymphoma by immunohistochemistry using a tissue microarray. Blood103(1), 275–282 (2003).
- Gribben RC , AndrewJames C, AndrewOet al. Poor concordance among nine immunohistochemistry classifiers of cell-of-origin for diffuse large B-cell lymphoma: implications for therapeutic strategies. Clin. Cancer Res.19(24), 6686–6695 (2013).
- Meyer PN , FuK, GreinerTCet al. Immunohistochemical methods for predicting cell of origin and survival in patients with diffuse large B-cell lymphoma treated with rituximab. J. Clin. Oncol.29(2), 200–207 (2011).
- Staiger AM , ZiepertM, HornHet al. Clinical impact of the cell-of-origin classification and the MYC/ BCL2 dual expresser status in diffuse large B-cell lymphoma treated within prospective clinical trials of the German High-Grade Non-Hodgkin's Lymphoma Study Group. J. Clin. Oncol.35(22), 2515–2526 (2017).
- Morin RD , JohnsonNA, SeversonTMet al. Somatic mutations altering EZH2 (Tyr641) in follicular and diffuse large B-cell lymphomas of germinal-center origin. Nat. Genet.42, 181–185 (2010).
- Rosenwald A , WrightG, ChanWCet al. The use of molecular profiling to predict survival after chemotherapy for diffuse large-B-cell lymphoma. N. Engl. J. Med.346(25), 1937–1947 (2002).
- Intlekofer AM , JoffeE, BatleviCLet al. Integrated DNA/RNA targeted genomic profiling of diffuse large B-cell lymphoma using a clinical assay. Blood Cancer J.8(6), 60 (2018).
- Ngo VN , YoungRM, SchmitzRet al. Oncogenically active MYD88 mutations in human lymphoma. Nature470, 115–119 (2010).
- Davis RE , NgoVN, LenzGet al. Chronic active B-cell-receptor signaling in diffuse large B-cell lymphoma. Nature463, 88–92 (2010).
- Scherer F , KurtzDM, NewmanAMet al. Distinct biological subtypes and patterns of genome evolution in lymphoma revealed by circulating tumor DNA. Sci. Transl. Med.8(364), 364ra155 (2016).
- Chapuy B , StewartC, DunfordAJet al. Molecular subtypes of diffuse large B cell lymphoma are associated with distinct pathogenic mechanisms and outcomes. Nat. Med.24(5), 679–690 (2018).
- Schmitz R , WrightGW, HuangDWet al. Genetics and pathogenesis of diffuse large B-cell lymphoma. N. Engl. J. Med.378(15), 1396–1407 (2018).
- Vitolo U , TrnenyM, BeladaDet al. Obinutuzumab or rituximab plus cyclophosphamide, doxorubicin, vincristine, and prednisone in previously untreated diffuse large B-cell lymphoma. J. Clin. Oncol.35(31), 3529–3537 (2017).
- Seymour JF , PfreundschuhM, TrnenyMet al. R-CHOP with or without bevacizumab in patients with previously untreated diffuse large B-cell lymphoma: final MAIN study outcomes. Haematologica99(8), 1343–1349 (2014).
- He J , Abdel-WahabO, NahasMKet al. Integrated genomic DNA/RNA profiling of hematologic malignancies in the clinical setting. Blood127(24), 3004–3014 (2016).
- Sun JX , HeY, SanfordEet al. A computational approach to distinguish somatic vs. germline origin of genomic alterations from deep sequencing of cancer specimens without a matched normal. PLoS Comput. Biol.14(2), e1005965 (2018).
- Chalmers ZR , ConnellyCF, FabrizioDet al. Analysis of 100,000 human cancer genomes reveals the landscape of tumor mutational burden. Genome Med.9(1), 34 (2017).
- Zehir A , BenayedR, ShahRHet al. Mutational landscape of metastatic cancer revealed from prospective clinical sequencing of 10.000 patients. Nat. Med.23(6), 703–713 (2017).
- Alexandrov LB , Nik-ZainalS, WedgeDCet al. Signatures of mutational processes in human cancer. Nature500(7463), 415–421 (2013).
- Lenz G , WrightGW, EmreNCTet al. Molecular subtypes of diffuse large B-cell lymphoma arise by distinct genetic pathways. Proc. Natl Acad. Sci. USA105(36), 13520–13525 (2008).
- Jardin F , JaisJ-P, MolinaT-Jet al. Diffuse large B-cell lymphomas with CDKN2A deletion have a distinct gene expression signature and a poor prognosis under R-CHOP treatment: a GELA study. Blood116(7), 1092–1104 (2010).
- McCord R , BolenCR, KoeppenHet al. PD-L1 and tumor-associated macrophages in de novo DLBCL. Blood Adv.3(4), 531–540 (2019).
- Andorsky DJ , YamadaRE, SaidJ, PinkusGS, BettingDJ, TimmermanJM. Programmed death ligand 1 is expressed by non–Hodgkin lymphomas and inhibits the activity of tumor-associated T cells. Clin. Cancer Res.17(13), 4232 (2011).
- Chen BJ , ChapuyB, OuyangJet al. PD-L1 expression is characteristic of a subset of aggressive B-cell lymphomas and virus-associated malignancies. Clin.Cancer Res.19(13), 3462–3473 (2013).
- Hellmann MD , CiuleanuT-E, PluzanskiAet al. Nivolumab plus ipilimumab in lung cancer with a high tumor mutational burden. N. Engl. J. Med.378(22), 2093–2104 (2018).
- Ansell SM , MinnemaMC, JohnsonPet al. Nivolumab for relapsed/refractory diffuse large B-cell lymphoma in patients ineligible for or having failed autologous transplantation: a single-arm, phase II study. J. Clin. Oncol.37(6), 481–489 (2019).
- Wilson WH , YoungRM, SchmitzRet al. Targeting B cell receptor signaling with ibrutinib in diffuse large B cell lymphoma. Nat. Med.21(8), 922–926 (2015).
- Kotnis A , DuL, LiuC, PopovSW, Pan-HammarströmQ. Non-homologous end joining in class switch recombination: the beginning of the end. Philos. Trans. R. Soc. Lond. B. Biol. Sci.364(1517), 653–665 (2009).
- Arthur SE , JiangA, GrandeBMet al. Genome-wide discovery of somatic regulatory variants in diffuse large B-cell lymphoma. Nat.Commun.9(1), 4001 (2018).
- Pascual M , Mena-VarasM, RoblesEFet al. PD-1/PD-L1 immune checkpoint and p53 loss facilitate tumor progression in activated B cell diffuse large B-cell lymphomas. Blood133(22), 2401–2412 (2019).