
Abstract
Aim: To describe the treatment landscape and associated economic burden for myelodysplastic syndrome in Japan. Methods: We studied nationwide retrospective claims data from 2008 to 2019. The study cohort was categorized into patients receiving transfusion, erythropoiesis-stimulating agent, erythropoiesis-stimulating agent + transfusion, azacitidine, azacitidine + transfusion and others. Results: Our study found that the azacitidine + transfusion group had the highest medical cost and severity of disease compared with the other groups. In those patients, healthcare resource utilization and the costs of transfusions, including iron chelation therapy, increased medical costs. Conclusion: Our retrospective analysis provides a current snapshot of real-world treatment patterns and associated incremental economic costs of iron chelation therapy with the presence of transfusions that drive an increase in total costs.
Myelodysplastic syndromes (MDS) are groups of clonal hematopoietic malignancies that manifest as ineffective function of hematopoietic stem cells and anemia [Citation1]. MDS primarily affects the elderly, with 86% of patients being ≥60 years old at the time of diagnosis and a reported median age of 76 years [Citation2]. There is unmet medical need for transfusion-dependent (TD) MDS in which transfusion dependency is considered to be a negative prognostic factor; TD patients have a shorter median survival time than non-transfusion-dependent disease, and a primary goal of treatment is to maintain patient quality of life [Citation3]. While Japan is an aging society, an up-to-date Japanese treatment landscape for lower-risk TD and non-TD MDS, as well as related economic outcomes, remains largely undefined due to limited real-world data.
According to the most recent estimates, the crude incidence rate of MDS in Japan increased 12-fold from 0.2 cases per 100,000 patients in 1993 to 3.8 cases per 100,000 male (95% CI: 3.6–4.1) and 2.4 cases per 100,000 female (95% CI: 2.2–2.6) in 2008 [Citation4]. Analysis by the International Working Group for Prognosis of MDS showed that Japanese patients were younger with more severe cytopenia and unique genetic disease markers as compared with Caucasian patients [Citation5].
Recommendations for MDS treatments vary depending on the presence of risk factors such as age, cytogenetic abnormalities and comorbidities. Lower-risk patients may receive blood transfusion as standard supportive care for anemia [Citation6,Citation7]. Cytokine therapy (e.g., erythropoiesis-stimulating agent [ESA]) for anemia, or lenalidomide therapy for patients with chromosome 5q deletion, are recommended to improve transfusion independence [Citation8]. Patients with higher-risk disease are recommended to undergo allogeneic hematopoietic stem cell transplant (allo-HSCT) if possible, with a hypomethylating agent (HMA) such as azacitidine (AZA) or decitabine acting as a bridge to transplantation [Citation7]. Transplantation is the only durable cure for MDS, but less than 5% of MDS patients are reported to be eligible [Citation9].
Furthermore, clinical outcomes including overall survival (OS) marked a median survival of 55 months for patients who underwent allo-HSCT versus 26 months for patients who did not receive such treatment [Citation10]. Patients who are ineligible for transplantation are recommended to receive HMA therapy and continue as tolerated until disease progression, at which point other treatment options may be considered.
The economic burden of MDS treatment in terms of medical costs and healthcare resource utilization (HCRU) has been reported to be associated with therapies such as iron chelation therapy (ICT) [Citation3]. The economic burden of MDS patients who received therapy for higher-risk MDS includes emergency room visits, outpatient visits, chemotherapy and supportive care. Among MDS patients in the USA who were refractory to HMA, the mean total cost of care was US$76,945 (standard deviation [SD] $92,764) in the first 6 months after treatment failure, with MDS-specific healthcare cost making up 59% of that total [Citation11]. Overall, MDS patients in the USA had relatively high overall costs in their first and second years of treatment, at US$17,337 and US$12,976 per patient per month, respectively [Citation12].
When divided by specific MDS treatment regimens, studies have reported total medical costs per patient/year for TD-MDS at more than double those for transfusion-independent MDS (US$29,608–51,066 vs US$9,840–19,811, respectively) [Citation13]. Similarly, 3-year mean costs were significantly lower for MDS patients who did not require regular blood transfusions compared with those who required such treatment (US$29,519 vs US$88,824, respectively) [Citation14]. On average, patients who started MDS treatment with ESA (US$37,244) or immunotherapy (US$38,461) incurred a lower mean cost than patients who initially received chemotherapy (US$60,288) [Citation15].
To date, there is limited evidence on the real-world economic burden of patients with MDS treatment in Japan. Therefore the objective of this study was to characterize the treatment patterns and associated costs of MDS patients in Japan using hospital administrative claims data without risk of disease assessment, as no International Prognostic Scoring System (IPSS) data are available.
Materials & methods
Study design & study population
In this study we used an administrative retrospective claims database (2008–2019) provided by Medical Data Vision Co., Ltd (MDV; Tokyo, Japan). Covering approximately 24% of acute hospitals and 9% of the Japanese population, the MDV database is a large database of anonymized medical claims from over 400 hospitals in Japan. It is representative of the age distribution of the general Japanese population (35% over the age of 65 years) [Citation16,Citation17].
The identified patients were those with at least one MDS-related treatment claim between 1 October 2009 and 30 June 2018 [Citation18]. The index date was considered to be the date of the first MDS-related treatment during this period.
A list of MDS-related treatment types is presented in . We identified eligible patients who had at least three claims with International Classification of Diseases 10th revision (ICD-10) diagnosis code D46.9 from the index date throughout a 12-month look-back period. Each included patient also had at least 1 year of follow-up; patients who had a death record within 12 months after the index date were also included based on our study algorithm. Included patients were followed up from their index date until disease progression to acute myeloid leukemia (ICD-10: C92.0), death or end of the study period (30 June 2019), whichever occurred first. The MDV database does not contain IPSS scores and allocation to groups and regimens was performed based on the opinions of Japanese experts.
Table 1. Myelodysplastic syndrome-related treatments considered.
Treatment regimen groups
Patients were categorized by three major regimen components included in the first-line (1L) treatment regimen: transfusion, ESA or AZA. Lenalidomide was included in the ‘Others’ group. Subgroup analysis of components of the ‘Others’ group (chemotherapy with or without transfusion; G-CSF with or without transfusion; any combinations with other treatment categories), including allo-HSCT (n = 13; Supplementary Figure 3) and lenalidomide (n = 107), delivered limited impact on the overall group cost due to the low number of patients. Therefore, as the scope of this study was not risk based, these treatments remained in the ‘Others’ group. Decitabine is not reimbursed in Japan [Citation6,Citation7] and thus was not selected as a target regimen. The 1L regimen started from the index date to the first discontinuation. Discontinuation occurred when there was a gap of 30 days without any MDS-related treatment. According to their 1L therapy, patients in each treatment group were further categorized into one of the following subgroups by order of disease severity potential: transfusion, ESA, ESA + transfusion, AZA, AZA + transfusion; those who remained uncategorized above were classified in the ‘Others’ group. Each group was mutually exclusive for further statistical analysis.
Patient baseline characteristics
The patient demographics collected were gender, age and age group (0–19, 20–59, 60–79 and 80+ years). Clinical characteristics, including year of index date, baseline Charlson Comorbidity Index (CCI) score and its component comorbidities were analyzed to describe our study cohort.
HCRU & medical costs
The following healthcare resources were captured during the follow-up period (up to 3 years): number of outpatient visits, number of hospitalizations, length of hospital stay, number of intensive care unit (ICU) admissions, number of emergency room visits, number of ICTs and number of transfusions. The medical costs calculated were all-cause medical cost, outpatient cost, inpatient cost, ICU cost, MDS-related treatment cost, other medication cost, allo-HSCT cost, transfusion cost and ICT cost.
Overall survival
The OS of this population was defined as the time from index date until death or end of follow-up, and was capped at 3 years based on the assumption of a progression-free survival of 2.5 years [Citation19–22]. Patients were censored if they did not have a death record or the record ended in the database within 3 years.
Statistical analysis
Continuous variables were calculated as mean, SD, median, minimum and maximum. Categorical variables were summarized as a frequency and percentage. Patient demographics, clinical characteristics, medical cost and HCRU were tabulated by index treatment regimen group. For demographics and clinical characteristics, the differences between groups were statistically tested by one-way analysis of variance for continuous variables and by Pearson’s χ2 test or Fisher’s exact test for categorical variables. For costs and HCRU, results were analysed for 3 years of overall follow-up as well as being stratified into follow-up periods of 0–12, 13–24 and 25–36 months. Cost in Japanese yen was converted to US$ using the exchange rate on the first month of the corresponding calendar year. Additionally, as the cost occurred across different calendar years, the cost data were presented after being adjusted by the average Consumer Price Index in each corresponding calendar year [Citation23–25], taking 2019 as the reference year, as presented in Supplementary Table 1. To investigate the differences in costs between groups, a generalized linear model fitted with γ distribution and log-link function was applied for cost outcomes with and without adjustment for baseline comorbidities. Nominal costs for treatment regimens and allo-HSCT prior to adjustment with Consumer Price Index per each corresponding calendar year are presented in Supplementary Tables 2 & 3, respectively. To investigate HCRU outcomes, a generalized linear model with Poisson distribution was used (except for the length of hospital stay). In Supplementary Table 2, nominal cost outcomes up to 3-year follow-up using least squares means and p-values were adjusted for all baseline comorbidities.
A Sankey diagram was created to visualize treatment-switching patterns over the first three lines of therapy when applicable. OS estimates were calculated using Kaplan–Meier methods, and the estimates were stratified by age and treatment regimen groups. Log-rank test was used for the comparison of OS curves between groups. A p-value < 0.05 was considered statistically significant. All analyses were performed using SAS® version 9.4 or higher (https://support.sas.com/software/94/).
Results
Patient characteristics & clinical outcomes
A total of 5981 eligible patients were found in the identification period (). Patient baseline characteristics are shown in & Supplementary Table 4. In total, 62.2% of patients were male, which is consistent with previous research reporting gender differences in MDS incidence [Citation26]. Patients receiving only transfusion in their 1L of therapy made up the largest regimen group (n = 2844; 47.6%). Except for the ‘Others’ group, the next largest regimen groups were AZA + transfusion (n = 703; 11.8%), ESA (n = 294; 4.9%) and AZA (n = 288; 4.8%). The mean age of all participants was 73.2 years (SD: 12.9; median: 75.0). The youngest regimen group was AZA with a mean age of 70.2 years (SD: 10.9; median: 71.0) and the oldest group was ESA + transfusion at 77.8 years (SD: 10.4; median 79.0; p < 0.0001). The mean baseline CCI score was 2.5 (SD: 2.3; median 2.0) across the entire MDS population. The AZA and AZA + transfusion groups recorded mean CCI scores of 1.9 (SD: 1.9; median: 2.0) and 2.0 (SD: 2.0; median: 2.0), respectively, whereas the ESA and ESA + transfusion groups had mean CCI scores of 3.2 (SD: 2.4; median: 3.0) and 2.6 (SD: 2.3; median: 2.0), respectively (p < 0.0001). In total, 40.4% of patients (n = 2414) had another malignancy, and the most common malignancy was leukemia (n = 1339; 22.4%). Other prominent comorbidities were congestive heart failure (25.1%), mild liver disease (19.5%), chronic pulmonary disease (19.2%) and renal disease (17.5%).
ICD-10: International Classification of Diseases 10th Revision; MDS: Myelodysplastic syndrome.
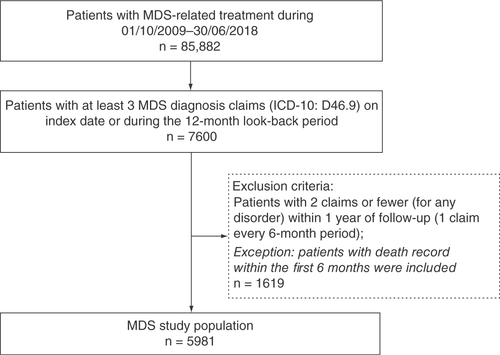
Table 2. Patient baseline characteristics overall and by treatment category.
Groups treated with an ESA-based regimen had a considerably larger proportion of patients with almost all types of comorbidities compared with AZA-based regimen groups. The widest variation in treatment groups was the difference between the prevalence of renal disease: in the ESA group the proportion was 73.8% while for the AZA group it was 4.9% (p < 0.0001). However, the prevalence of leukemia was greater in the AZA group than the ESA group (36.8 vs 8.2%; p < 0.0001). Mean follow-up time was 546.3 days (SD: 569.8) for all study patients; the ESA regimen group had the longest follow-up at 752.9 days (SD: 532.5; p < 0.0001). The highest proportion of patient deaths was observed in the ESA + transfusion group (38.9%; p < 0.0001).
Treatment patterns
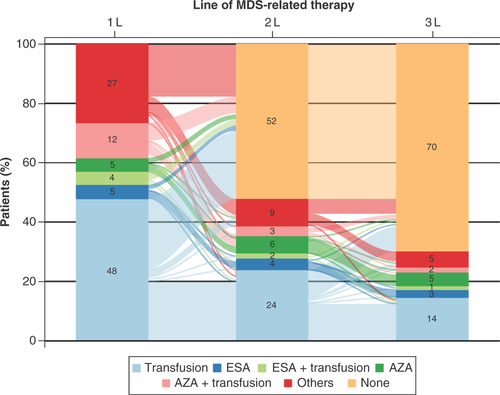
Changes in treatment regimens over the first three lines of MDS-related therapy are presented as the Sankey diagram in . The 1L therapy consisted of a transfusion regimen for the largest proportion of MDS patients (48%), followed by other regimens (27%) and AZA + transfusion (12%). The proportion of patients receiving AZA, ESA and ESA + transfusion regimens were similar to each other at 5, 4 and 5%, respectively. Most patients did not receive a second or third line of therapy (52 and 70%, respectively). The two largest 1L therapy groups decreased considerably in each subsequent line of therapy. The transfusion group shrank to 24% in the second line (2L) and 14% in the third line (3L). Only a small proportion of patients received lenalidomide as their 1L (1.8%; n = 107).
Patients were categorized by treatment regimen received in the 1L of therapy.
AZA: Azacitidine; ESA: Erythropoiesis-stimulating agents; MDS: Myelodysplastic syndromes.
Time to transfusion for AZA & ESA subgroups
In total, 18.7% (n = 55) of patients in the ESA group and 27.1% (n = 78) in the AZA group received transfusions (with means of 5.4 and 11.0 times, respectively) after the end of their 1L within 12 months of follow-up. For these subgroups, mean time to first transfusion was 195.7 days (SD: 93.5) for ESA and 169.1 days (SD: 92.1) for AZA. The ESA group had a higher mean age (79.3 years) and CCI score (3.2) than the AZA group (70.1 years and 1.5, respectively). Baseline characteristics for patient subgroups who had transfusions within the first year of follow-up can be found as Supplementary Table 5.
Costs by treatment types
The overall costs per patient in each 1L group were analyzed over the 3-year follow-up period. Medical costs were analyzed by departments, which revealed the variation between groups (). Excluding the ‘others’ regimen group, the AZA-based regimen group had the highest 3-year mean total costs, inpatient cost and outpatient costs while the ESA group had the lowest mean total costs and inpatient costs. The mean total costs were observed to be the highest for the AZA + transfusion regimen group (US$87,830) and lowest for the ESA group (US$32,987; p < 0.0001). Receiving an incremental transfusion therapy associated with ICT led to increase in total costs. Inpatient costs were one of the biggest drivers of total costs and were closely related with the burden from an HCRU perspective, which will be described below. For the ESA group, inpatient costs rose from US$23,221 to US$40,907 for the ESA + transfusion group. The ESA + transfusion regimen group also had the highest ICU costs (US$6,656), with the transfusion group having the lowest ICU costs (US$4,248; p = 0.1356). The highest outpatient costs were for the AZA group, while the lowest outpatient costs were observed in the transfusion group (US$34,685 vs US$17,910; p < 0.0001).
(A) Total costs and department costs. (B) Treatment-related costs. Cost in US$.
Error bars indicate 95% Cl. Patients were categorized by treatment regimen received in the 1L of therapy.
Allo-HSCT: Allogenic hematopoietic stem cell transplant; AZA: Azacitidine; ESA: Erythropoiesis-stimulating agents; ICT: Iron chelation therapy; ICU: Intensive care unit; MDS: Myelodysplastic syndromes.
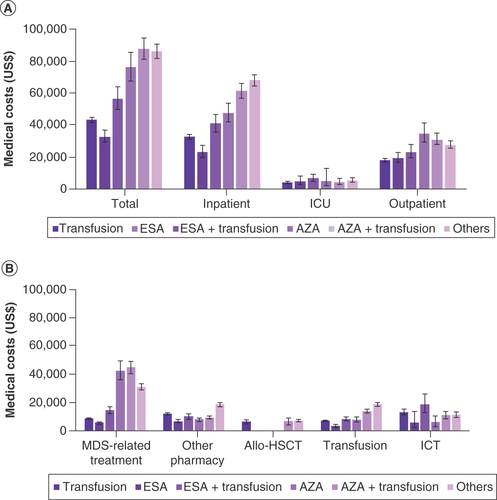
Treatment-related costs are presented by regimen type in . MDS-related treatment costs were the highest in the AZA + transfusion regimen group and the lowest in the ESA group (US$44,499 vs US$5,284; p < 0.0001). With other regimens excluded, the transfusion group had the highest other pharmacy costs (US$11,520). Cost for ICT was the highest for the ESA + transfusion group (US$18,468) and the lowest for the AZA group (US$5,506; p = 0.006).
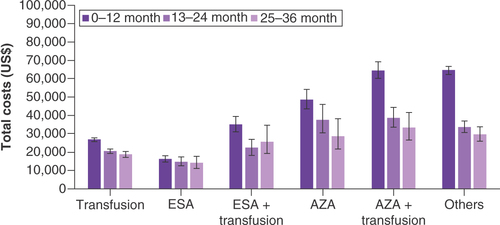
Total costs for each regimen group were further broken down by follow-up period (0–12, 13–24 and 25–36 months) and are presented in . Costs tended to decrease over time, with the 0–12 months period having the highest costs, followed by the 13–24 months period and the 25–36 months period, except for the ESA + transfusion group. For the AZA + transfusion group, the total costs declined from US$64,680 in the 0–12 months period to US$38,655 in the 13–24 months period, a reduction of 40.2%. The most stable total costs over time were for patients in the ESA group, where the cost in the 0–12 months period (US$16,217) declined by less than 14% in the 25–36 months period (US$14,065). Further adjustment of yearly total and department costs showed that baseline comorbidities did not bias these results (Supplementary Figure 2). Median cost for each treatment group over the 3-year period and stratified by follow-up month can be found in Supplementary Table 6.
Cost in US$.
Error bars indicate 95% Cl. Patients are categorized by treatment regimen received in the 1L therapy.
AZA: Azactidine; ESA: Erythropoiesis-stimulating agents.
Delay of initiation in TD patients
There were seven patients who, although they were treated with a ‘drug + transfusion’ as 1L, received their first transfusion more than 12 months after their index date (ESA + transfusion, n = 4; AZA + transfusion, n = 3). All seven patients had a low CCI score and most of them were male (71.4%). Baseline characteristics of these patients can be found in Supplementary Table 7.
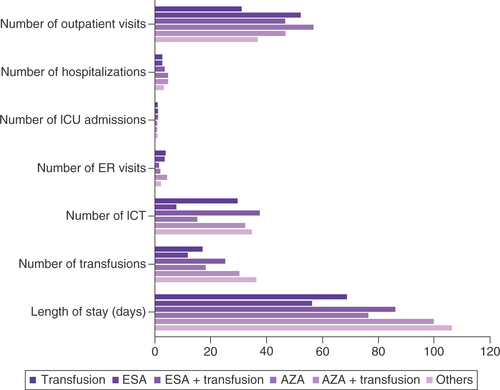
Healthcare resource utilization
The results for HCRU were calculated for the entire 3-year follow-up period () and divided into 12-month periods (Supplementary Table 8). The AZA regimen group had the highest 3-year mean number of outpatient visits, while the transfusion regimen group had the lowest (56.9 vs 31.3; p < 0.0001). The AZA group and the AZA + transfusion group had the highest mean numbers of hospitalizations at 4.8 and 4.9, respectively. Among these hospitalized patients, the AZA + transfusion group had the highest mean length of stay (100.1 days) besides the ‘other regimen’ group (p < 0.0001). The ESA + transfusion group and the AZA + transfusion group had longer lengths of stay than the ESA (86.3 vs 56.3 days) and AZA groups (100.1 vs 76.5 days; p < 0.0001). The ESA + transfusion group had the lowest number of emergency room visits and the AZA + transfusion group had the highest (1.6 vs 4.6; p < 0.0001). Utilization of ICT increased with inclusion of transfusion in the 1L.
AZA: Azacitidine; ER: Emergency room; ESA: Erythropoiesis-stimulating agents; ICT: Iron chelation therapy; ICU: Intensive cure unit.
Overall survival by age & 1L regimen
Kaplan–Meier curve analyses for OS outcomes are presented in Supplementary Figure 1A–C. Overall, there were 1966 deaths (32.9%) recorded within 3 years of follow-up, and the median OS was not reached (Supplementary Figure 1A) When stratified by age group, only the >80 group reached median OS (777 days; Supplementary Figure 1B).
Discussion
To our knowledge, this is the first report of treatment patterns to direct medical costs on patients with MDS in Japan in a real-world setting. While not directly comparable with other MDS disease registry data, our study revealed that the majority of treatment patterns in 1L included a transfusions-only regimen, followed by a smaller proportion of ESA- and AZA-based regimens. Treatment patterns for MDS in Japan may differ from those of other health systems due to the demographics of Japan – an aging society with increasing prevalence of MDS due to longer life expectancy, with a male-to-female ratio of 1:1.06 (as of Jan 2019) [Citation25]. Most patients in all treatment groups were male, which is a gender disparity noted by previous research on MDS incidence [Citation25]. The largest proportion of patients in our analysis received transfusions in 1L (47.6%), at a median age of 78.0 years.
More frequent usage of transfusions for lower-risk MDS has been reported as a cost driver of treatment. A US study found significantly higher spending in terms of healthcare costs for patients with lower-risk MDS who received transfusion versus those who did not (US$88,824 vs US$29,529) [Citation14]. Transfusion dependency in MDS can also lead to iron overload, which is associated with increased prevalence of complications and mortality compared with nontransfused patients [Citation27]. In this analysis, when transfusions were added to ESA or AZA 1L therapy costs, HCRU increased considerably. AZA + transfusion regimens also carried the highest HCRU in terms of number of outpatient visits, hospitalizations and length of stay. Transfusion dependency – defined as requiring more than two transfusions per month – among Canadian patients treated with AZA also increased costs beyond the cost of AZA compared with transfusion-independent patients with AZA treatment [Citation28]. In our analysis, those MDS patients who received ESA + transfusion and AZA + transfusion regimens generally had higher economic burden compared with those patients who received transfusion alone in 1L. Differences in direct medical costs per claim and HCRU between transfusions and other treatments were statistically significant. This could be explained by the hidden cost driver of ICT that MDS patients required as additional treatment to transfusion. ICT treatment is used to alleviate treatment effect in the majority of patients who require transfusions that may further develop to secondary iron overload associated with organ impairment [Citation3]. ICT was found to be one of the cost drivers within the medication cost category in one analysis of a German claims database [Citation29]. Our study showed that the cost of ICT in the ESA + transfusion group was over three-times higher than in the ESA group.
Cogle et al. reported in a database analysis that 3.9% of MDS patients received some chemotherapy, 18.6% received supportive care (including ESA or transfusions) with a chemotherapy option, and 80.1% received a watch-and-wait approach with neither chemotherapy nor supportive treatment. If 1L HMA failed, 61.4% of patients were found to receive supportive care [Citation11]. Our analysis found that most patients did not receive 2L or 3L therapy, which may also be due to clinical decisions favoring a watch-and-wait approach for MDS in Japan. Additionally in our study, the median age of our patient cohort was 75 years, which may explain the low number of allo-HSCT patients observed; this is aligned with the Japanese Society for Transplantation and Cellular Therapy guideline of a median age of 64–76 years [Citation30].
HMA treatments like AZA can potentially increase the economic burden of annual cost for MDS care. The estimated total cost of AZA per patient for MDS treatment varies across different countries. One of the economic impacts of HMAs for Medicare patients with MDS was that the 2-year cost of care after diagnosis was considerably higher in HMA users compared with non-users (US$92,102 vs US$40,111) [Citation31]. Separately, the estimated annual cost of AZA alone was US$55,332 in the initial year of treatment [Citation32]. A study using a commercial drug pricing database reported the estimated total cost of AZA per patient was <US$10,001 in Australia, >US$110,000 in the UK and US$70,001–90,000 in France [Citation33].
Noting that it is not directly comparable, relatively higher MDS-related costs were reported to be not associated with improved survival outcomes according to a database study of 16 Medicare registries [Citation34] and AZA is used for treating patients with relatively higher-risk MDS [Citation28].
This study included some of the limitations inherent in a retrospective database study design. The MDV database is based on patient data from participating hospitals exclusively, so care received beyond these sites by the included patients could not be assessed. This database also only includes data on treatments that can be reimbursed; therefore it may underestimate the full scope of the healthcare burden in some cases. For example, clinical scoring of MDS disease status (IPSS) was not available in the dataset. In order to minimize selection bias for disease status groupings, classification of lower/higher risk was validated based on multiple factors, including patients’ degree of transfusion dependence [Citation3] and the characteristics of the Japanese MDS population; we based our study on clinical experts’ opinions. In addition, patients’ 1L may differ from their classification in the database because prior treatments in another hospital were not traceable. Finally, treatments may not be directly comparable due to the heterogeneity of this patient population, but age and CCI condition may be suggestive of patients’ baseline condition.
Conclusion
In conclusion, our study found that the AZA + transfusion group had the highest medical cost and severity of disease compared with other treatment groups. In those patients, HCRU and the costs of transfusions (including ICT) increased medical costs. Our retrospective analysis provides a current snapshot of real-world treatment patterns and the associated incremental economic costs of ICTs with transfusions that drive an increase in total costs.
Except for the ‘other regimens’ group, the next largest treatment groups were azacitidine (AZA) + transfusion (n = 703, 11.8%); erythropoiesis-stimulating agent (ESA; n = 294, 4.9%); and AZA (n = 288, 4.8%).
The mean age of all participants was 73.2 years (standard deviation: 12.9; median: 75.0).
The first-line therapies included a transfusion regimen (48%) for the largest proportion of MDS patients, followed by other regimens (27%) and AZA + transfusion (12%).
The mean total costs were observed to be the highest for the AZA + transfusion regimen group (US$87,830) and lowest for the ESA group (US$32,987; p < 0.0001). Receiving an incremental transfusion therapy associated with iron chelation therapy led to an increase in total costs.
MDS-related treatment costs were the highest in the AZA + transfusion group and the lowest in the ESA group (US$44,499 vs US$5,284; p < 0.0001).
Cost for iron chelation therapy was the highest for the ESA + transfusion group (US$18,468) and the lowest for the AZA group (US$5,506; p = 0.006).
In terms of mean number of hospitalizations, the AZA group and AZA + transfusion group had the highest, at 4.8 and 4.9, respectively.
Costs tended to decrease over time with the 0–12 months period having the highest costs, followed by the 13–24 months period and 25–36 months period, except for the ESA + transfusion group.
There were seven patients who, although they were treated with a ‘drug + transfusion’ regimen as their first line, received their first transfusion more than 12 months after their index date (ESA + transfusion, n = 4; AZA + transfusion, n = 3).
Author contributions
S Tsutsué conceived and designed this study. S Tsutsué, T Suzuki, H Kim and B Crawford analyzed the data and wrote the manuscript. S Tsutsué, T Suzuki, H Kim and B Crawford reviewed and approved the manuscript.
Ethical conduct of research
This study was a retrospective study utilizing an existing hospital claims database, with no primary data collection involved. Inclusion of patient records in the database was conditional upon notification to patients that their inpatient/outpatient claims data would be used for research via an opt-out system. All data in this database were deidentified prior to addition, and patient records were only linked within each unique facility. As such, with all data anonymized, the Ethical Guidelines for Epidemiological Research in Japan are not applicable to this study (www.nitrd.nic.in/WriteReadData/userfiles/file/Ethical%20Guidelines.pdf). In addition, the Ethical Guidelines on Biomedical Research Involving Human Subjects ascertain that written informed consent from patients is not required for such pharmacoepidemiological studies conducted using medical databases, as the use of pre-existing data does not require any interaction with patients (https://cioms.ch/publications/product/international-ethical-guidelines-for-biomedical-research-involving-human-subjects-2/#:~:text=The%20Guidelines%20relate%20mainly%20to,control%20in%20clinical%20trials%3B%20confidentiality%3B).
Additional file 1
Download PNG Image (301.6 KB)
Additional file 2
Download PNG Image (189.4 KB)
Supplementary Table 3. Nominal cost outcomes up to 3-year follow-up among allo-HSCT groups
Download MS Excel (58.5 KB)Additional file 3
Download Zip (531.3 KB)Supplementary data
To view the supplementary data that accompany this paper please visit the journal website at: www.tandfonline.com/doi/suppl/10.2217/fon-2021-0988
Financial & competing interests disclosure
This study was funded by Bristol Myers Squibb. S Tsutsué is an employee of Bristol Myers Squibb. T Suzuki received honoraria from Bristol Myers Squibb, Novartis Pharmaceuticals, Kyowa Hakko Kirin Co. Ltd and Nippon Shinyaku Co. Ltd and received research funding from Kyowa Hakko Kirin Co. Ltd outside of this work. H Kim and B Crawford are employees of Syneos Health. The authors have no other relevant affiliations or financial involvement with any organization or entity with a financial interest in or financial conflict with the subject matter or materials discussed in the manuscript apart from those disclosed.
No writing assistance was utilized in the production of this manuscript.
Additional information
Funding
References
- Zeidan AM , ShallisRM, WangR, DavidoffA, MaX. Epidemiology of myelodysplastic syndromes: why characterizing the beast is a prerequisite to taming it. Blood Rev.34, 1–15 (2019).
- Ma X . Epidemiology of myelodysplastic syndromes. Am. J. Med.125(Suppl. 7), S2–S5 (2012).
- Germing U , OlivaEN, HiwaseD, AlmeidaA. Treatment of anemia in transfusion-dependent and non-transfusion-dependent lower-risk MDS: current and emerging strategies. Hemasphere3(6), e314 (2019).
- Chihara D , ItoH, KatanodaKet al. Incidence of myelodysplastic syndrome in Japan. J. Epidemiol.24(6), 469–473 (2014).
- Miyazaki Y , TuechlerH, SanzGet al. Differing clinical features between Japanese and Caucasian patients with myelodysplastic syndromes: analysis from the International Working Group for Prognosis of MDS. Leuk. Res.73, 51–57 (2018).
- Japanese Society of Hematology . Hematologic malignancy treatment guidelines: myelodysplastic syndromes. (2018).
- Steensma D . Myelodysplastic syndromes current treatment algorithm 2018. Blood Cancer J.8(5), 47 (2018).
- Santini V . Treatment of low-risk myelodysplastic syndromes. Hematol. Am. Soc. Hematol. Educ. Program2(1), 462–469 (2016).
- Steensma D . Graphical representation of clinical outcomes for patients with myelodysplastic syndromes. Leuk. Lymphoma57(1), 17–20 (2016).
- Gangat N , PatnaikMM, BegnaKet al. Survival trends in primary myelodysplastic syndromes: a comparative analysis of 1000 patients by year of diagnosis and treatment. Blood Cancer J.6(4), e414 (2016).
- Cogle CR , KurtinSE, BentleyTGet al. The incidence and health care resource burden of the myelodysplastic syndromes in patients in whom first-line hypomethylating agents fail. Oncologist22(4), 379–385 (2017).
- Bell JA , GalaznikA, BlazerMet al. Economic burden of patients treated for higher-risk myelodysplastic syndromes (HR-MDS) in routine clinical care in the United States. Pharmacoecon. Open3(2), 237–245 (2019).
- Lucioni C , FinelliC, MazziS, OlivaE. Costs and quality of life in patients with myelodysplastic syndromes. Am. J. Blood Res.3(3), 246–259 (2013).
- Goldberg SL , ChenE, SasaneM, PaleyC, GuoA, LaouriM. Economic impact on US Medicare of a new diagnosis of myelodysplastic syndromes and the incremental costs associated with blood transfusion need. Transfusion52(10), 2131–2138 (2012).
- Clark O , FaleirosJF. Cost of the treatment of myelodisplastic syndrome in Brazil. Rev. Bras. Hematol. Hemoter.33(1), 31–34 (2010).
- Japanese Society for Pharmacoepidemiology . Databases available for pharmacoepidemiology researches in Japan (information obtained from survey answers as of August 2020) (2020). www.jspe.jp/mt-static/FileUpload/files/JSPE_DB_TF_E.pdf
- Tsutsué S , TobinaiK, YiJ, CrawfordB. Nationwide claims database analysis of treatment patterns, costs and survival of Japanese patients with diffuse large B-cell lymphoma. PLoS ONE15, 1–18 (2020).
- Tsutsué S , SuzukiT, KimH, KuanWY, CrawfordB. Real-world assessment of nationwide health economic burden and treatment-based survival for current myelodysplastic syndromes treatment practice in Japan. Blood136(Suppl. 1), 36–37 (2020).
- Bell JA , GalaznikA, BlazerMet al. Transfusion-free interval is associated with improved survival in patients with higher-risk myelodysplastic syndromes engaged in routine care. Leuk. Lymphoma60(1), 49–59 (2019).
- Bell JA , GalaznikA, HuelinRet al. Systematic literature review of treatment options and clinical outcomes for patients with higher-risk myelodysplastic syndromes and chronic myelomonocytic leukemia. Clin. Lymphoma Myeloma Leuk.18(4), e157–e166 (2018).
- Kurumaddali A , SalemAH, AgarwalSK. A meta-analysis of higher-risk myelodysplastic syndrome trials to evaluate the relationship between short-term endpoints and overall survival. J. Cancer10(22), 5427 (2019).
- Wang N , XuH, LiQet al. Patients of myelodysplastic syndrome with mild/moderate myelofibrosis and a monosomal karyotype are independently associated with an adverse prognosis: long-term follow-up data. Cancer Manag. Res.12, 5881 (2020).
- Tsutsué S , TobinaiK, YiJ, CrawfordB. Comparative effectiveness study of chemotherapy in follicular lymphoma patients in the rituximab era: a Japanese claims database study. Future Oncol.17(4), 455–469 (2021).
- Consumer Price Index 2015 – Base Consumer Price Index Annual Report Yearly (2019). www.e-stat.go.jp/en/stat-search/files?page=1&layout=datalist&toukei=00200573&tstat=000001084976&cycle=7&year=20190&month=0&tclass1=000001085975
- Population inference (2019). www.stat.go.jp/data/jinsui/pdf/201901.pdf
- Wang F , NiJ, WuL, WangY, HeB, YuD. Gender disparity in the survival of patients with primary myelodysplastic syndrome. J. Cancer10(5), 1325–1332 (2019).
- Cogle CR . Incidence and burden of the myelodysplastic syndromes. Curr. Hematol. Malig. Rep.10(3), 272–281 (2015).
- Mozessohn L , CheungM, MittmannN, EarleCC, LiuN, BucksteinR. High healthcare utilization and costs in patients with higher-risk MDS/low blast count AML treated with azacitidine in Ontario, Canada. Blood132(Suppl. 1), 834 (2018).
- KÜhne F , MittendorfT, GermingUet al. Cost of transfusion-dependent myelodysplastic syndrome (MDS) from a German payer’s perspective. Ann. Hematol.89, 1239–1247 (2010).
- Japanese Society for Hematopoietic Cell Transplantation . Guideline for hematopoietic cell transplantation in adult myelodysplastic syndromes and myeloproliferative neoplasms, third edition (2021). www.jshct.com/uploads/files/guideline/03_05_mds-mpn03.pdf
- Wang R , GrossCP, FrickKet al. The impact of hypomethylating agents on the cost of care and survival of elderly patients with myelodysplastic syndromes. Leuk. Res.36(11), 1370–1375 (2012).
- Greenberg PL , CoslerLE, FerroSA, LymanGH. The costs of drugs used to treat myelodysplastic syndromes following National Comprehensive Cancer Network Guidelines. J. Natl Compr. Cancer Netw.6(9), 942–953 (2008).
- Salas-Vega S , ShearerE, MossialosE. Relationship between costs and clinical benefits of new cancer medicines in Australia, France, the UK, and the US. Soc. Sci. Med.258(113042), (2020).
- Zeidan AM , WangR, DavidoffAJet al. Disease-related costs of care and survival among Medicare-enrolled patients with myelodysplastic syndromes. Cancer122(10), 1598–1607 (2016).