
Abstract
Aims: To compare clinical trial results for crizotinib and entrectinib in ROS1-positive non-small-cell lung cancer and compare clinical trial data and real-world outcomes for crizotinib. Patients & methods: We analyzed four phase I–II studies using a simulated treatment comparison (STC). A STC of clinical trial versus real-world evidence compared crizotinib clinical data to real-world outcomes. Results: Adjusted STC found nonsignificant trends favoring crizotinib over entrectinib: objective response rate, risk ratio = 1.04 (95% CI: 0.85–1.28); median duration of response, mean difference = 16.11 months (95% CI: -1.57– 33.69); median progression-free survival, mean difference = 3.99 months (95% CI: -6.27–14.25); 12-month overall survival, risk ratio = 1.01 (95% CI: 0.90–1.12). Nonsignificant differences were observed between the trial end point values and the real-world evidence for crizotinib. Conclusions: Crizotinib and entrectinib have comparable efficacy in ROS1-positive non-small-cell lung cancer.
The treatment of non-small-cell lung cancer (NSCLC) has been transformed by the advent of personalized therapy, with many patients receiving treatments designed to target specific genetic anomalies in their tumors [Citation1]. The ROS1 gene rearrangement is estimated to occur in 2–4.69% of all patients with NSCLC, with an incidence of approximately 4000 cases in the USA, annually [Citation2–4]. The US FDA and EMA have approved two treatments specifically for ROS1-positive metastatic NSCLC: crizotinib (approved by the EMA in 2016 and by the FDA in 2016) and entrectinib (approved by the FDA in 2019 and by the EMA in 2020) [Citation5–8]. Crizotinib and entrectinib are oral multikinase inhibitors that target ROS1 receptor tyrosine kinases; both have been evaluated in advanced ROS1-positive NSCLC in single-arm phase I–II clinical trials that supported regulatory approvals [Citation9,Citation10].
PROFILE 1001 (NCT00585195) enrolled patients with ROS1-positive NSCLC (n = 53) to receive crizotinib 250 mg orally twice daily in 28-day cycles until the Response Evaluation Criteria in Solid Tumors defined disease progression or clinical deterioration, unacceptable toxicity effects, study withdrawal or death [Citation9]. Entrectinib phase I (ALKA-372-001 [EudraCT 2012-000148-88], STARTRK-1 [NCT02097810]) trials enrolled ROS1-positive NSCLC patients to receive entrectinib orally (dose escalation ranging from 100 mg to maximum tolerated dose; the efficacy population represents patients who received at least 600 mg once daily with at least 12 months follow-up). In the phase II (STARTRK-2 [NCT02568267]) trial, patients received 600 mg entrectinib orally once daily in 28-day cycles until documented radiographic progression, unacceptable toxicity or withdrawal of consent [Citation11–13]. Dziadziuszko et al. included aggregate patient data from the entrectinib phase I–II trials ALKA-372-001, STARTRK-1 and STARTRK-2 (n = 161) with at least 6 months of follow-up [Citation10].
There is an ongoing randomized clinical trial directly comparing crizotinib with entrectinib (NCT04603807), but currently no data are available; we therefore sought to evaluate the comparative effectiveness of the two therapies to support clinical and health economic decision-making using indirect treatment comparison techniques. The studies compared in this analysis were two regulatory approval-supporting single-arm, open-label, international studies for crizotinib (PROFILE 1001) and entrectinib (ALKA-372-001, STARTRK-1 and STARTRK-2), described above (‘clinical trial-to-clinical trial’) [Citation9,Citation10]. These two studies represent the pivotal clinical trial for crizotinib and entrectinib in treatment of ROS1-rearranged NSCLC in western patients and used in a former matching-adjusted indirect comparison (MAIC), setting precedent for further analysis with the publication of an updated data-cut [Citation10,Citation14].
There is a growing interest in real-world evidence (RWE) to demonstrate the effectiveness and safety of treatments administered outside of carefully controlled clinical trials [Citation15]. The magnitude of difference between results seen in clinical trials versus the real world is not well established, with some studies finding that RWE confirms randomized controlled trial efficacy results [Citation16] and others finding variations in reporting among certain types of RWE that complicate comparisons with randomized controlled trials [Citation17]. One study found that only 15% of clinical trials published in high-impact journals in 2017 could feasibly be replicated using observational RWE, underscoring the challenges inherent in comparing clinical and RWE efficacy results [Citation18].
While there are some published oncology studies in which clinical trial results are compared with a real-world control arm [Citation16], there are few examples of indirect comparisons of the performance of the same drug in a clinical trial setting versus the real world. Therefore, as a secondary objective, this analysis uses simulated treatment comparison (STC) techniques to compare clinical trial results for crizotinib with crizotinib in RWE (i.e., ‘clinical trial-to-RWE’ comparison). As with the clinical trial-to-clinical trial analysis, PROFILE 1001 was the source of data for crizotinib trial data; RWE for crizotinib was obtained from published data analyses that used Flatiron Health and Oncology Insights & Technology (Ontada, NC, USA) [Citation19-Citation20].
Patients & methods
An indirect treatment comparison (ITC) is one way of comparing results of different healthcare interventions using data from separate studies when there are no head-to-head trials available [Citation21]. The crizotinib trial and the entrectinib trial are single-arm trials with no controls. Given the lack of a common comparator or control such as placebo or standard-of-care, indirect comparisons must be conducted on the absolute scale as an unanchored comparison (comparing rates of outcomes directly), as opposed to the relative scale as an anchored comparison. Therefore an unanchored approach was appropriate for this indirect comparison between single-arm trials. When there are substantial differences in patient baseline characteristics between trials, interpretation relevant to a specific population may be limited [Citation22]. The validity of a standard ITC relies on three main assumptions – similarity, homogeneity and consistency – to ensure indirect measures of treatment effect are not biased by differences between studies in the distribution of effect-modifying covariates [Citation23,Citation24]. Similarity, otherwise referred to as transitivity, is the notion that all included trials are comparable in terms of potential effect modifiers and is evaluated by assessing whether the clinical study population, study design and clinical inclusion/exclusion criteria are similar enough that the relative effects are generalizable and valid [Citation24]. The current study satisfied this assumption using pairwise comparison of each respective trial’s population, intervention, comparators, outcomes and study design. Second, there should be homogeneity of treatment effect between two treatments directly compared (head-to-head), which can be assessed using measures of heterogeneity that are standard in pairwise meta-analysis. Finally, there must be consistency of effect between direct and indirect evidence. Consistency can only be examined if direct evidence is available for comparison. When there is significant variation in the distributions of treatment effect modifiers between sets of trials, the similarity assumption will be violated, and researchers cannot expect consistency of absolute or relative effects in the outcome. In this case, researchers should not proceed with the standard indirect comparison, which would therefore be biased and invalid, but instead should examine the feasibility of population-adjustment methodologies, which can account for between-trial imbalances in observed covariates.
MAIC and STC can be used to reweight or estimate the effect of mismatched treatment effect modifiers to make comparisons feasible and generalizable from the study of the treatment of interest to the comparator study. A conditional constancy of relative effect is assumed in anchored studies and of absolute effect in unanchored studies. These effects are estimated through adjustment of the mean values for the treatment effect modifiers for the treatment of interest to match those of the comparators [Citation25,Citation26]. In STC, the conditional mean prediction is estimated (given treatment and observed covariates) and then entered into an ITC for comparison [Citation25,Citation26].
An STC adjusts for differences in patient baseline characteristics between trials before performing the ITC to provide population-adjusted estimates of comparative effectiveness [Citation27,Citation28]. Effect-modifying and prognostic covariates were examined for significant differences between trials using the standardized differences for continuous and categorical variables statistical test [Citation29]. Significant differences in these covariates between studies demonstrated violation of the similarity assumption and supported the necessity of population adjustment. With STC techniques, individual patient data (IPD) from the crizotinib trial were adjusted for the entrectinib trial population covariates using regression analysis, modeling trial end points as the outcomes. The result adjusts for between-trial differences in baseline characteristics and provides an estimate of the relative treatment effect.
Note that there was a recently published comparative effectiveness analysis of crizotinib and entrectinib [Citation14]. This MAIC analysis incorporated evidence from patients with ROS1-positive NSCLC. Our analysis, in addition to focusing exclusively on ROS1-positive NSCLC, applied STC rather than MAIC, a method similar to the propensity score weighting used to balance prognostic variables or treatment effect modifiers between studies. These methods have been described in greater depth elsewhere [Citation30]. Another rationale for using STC analysis is that STC uses regression-based adjustment and incorporates the entire patient dataset, without any reduction in sample size. This is important when comparing trials with small patient cohorts. Recent literature has shown that STC is less prone to bias, especially in cases where the sample sizes in the index trial are small (i.e., <500 observations), and there is extrapolation of covariate effects when there is not complete overlap in the range of the covariate distributions [Citation31]. In addition, our analysis makes use of the updated integrated analysis reported by Dziadziuszko et al. [Citation10], which incorporates an additional 108 entrectinib-treated patients (n = 161) with longer follow-up relative to the data cut utilized by Chu et al. [Citation14].
Clinical trial-to-clinical trial comparison: entrectinib versus crizotinib
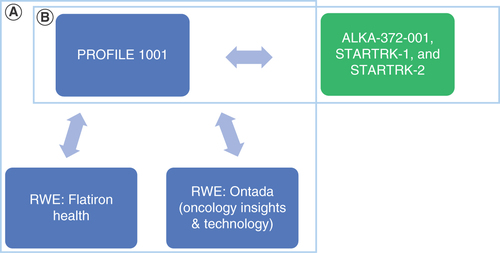
Single-arm studies employing similar designs allow comparisons of key patient baseline characteristics. To assess the appropriateness of comparative effectiveness analyses with respect to these assumptions, we compared populations between PROFILE 1001, using IPD, and aggregate data from ALKA-372-001, STARTRK-1 and STARTRK-2, using data from Dziadziuszko et al. [Citation10] in the clinical trial-to-clinical trial analysis ().
(A) Comparison of crizotinib clinical trial data versus crizotinib real-world evidence. (B) Comparison of crizotinib clinical trial data versus entrectinib clinical trial data. Blue denotes crizotinib evidence; green denotes entrectinib evidence.
RWE: Real-world evidence.
Mutually available prognostic variables and effect modifiers for adjustment were selected based on the known epidemiological factors associated with outcomes in NSCLC using the methods described by Phillippo et al. [Citation26] for unanchored analyses and then evaluated for imbalances between studies, including age, sex, Eastern Cooperative Oncology Group performance status (ECOG PS) and smoking status [Citation32,Citation33]. Due to too few observations of patients with ECOG PS 2, the prognostic variable was collapsed and analyzed using two levels: 0 and 1, and higher.
End points considered in this STC analysis include objective response rate (ORR), median duration of response (mDOR), median progression-free survival (mPFS) and overall survival (OS). A 12-month landmark was used for OS, as the median OS in Dziadziuszko et al. [Citation10] was not reached at the time of publication.
An indirect comparison of unadjusted efficacy data was conducted. Then regression models were fitted with unique sets of effect modifiers and prognostic variables for each outcome to predict the transformed outcomes of crizotinib treatment in the entrectinib trial population by adjusting for differences in baseline characteristics. We then indirectly compared the transformed outcomes of crizotinib treatment with those of entrectinib.
Clinical trial-to-RWE comparison: crizotinib versus crizotinib
In addition to the clinical trial-to-clinical trial STC, a clinical trial-to-RWE analysis was conducted, comparing crizotinib clinical data from PROFILE 1001 to real-world outcomes in patients receiving crizotinib. Patient data were obtained from two published crizotinib RWE studies, Flatiron Health and Ontada (Oncology Insights & Technology) data, and used to evaluate the generalizability of the real-world outcomes to clinical trial data in the clinical trial-to-RWE analysis () [Citation19,Citation20,Citation34]. The statistical methods outlined above were employed for a primary analysis and then a sensitivity analysis.
Results
Clinical trial-to-clinical trial comparison: entrectinib versus crizotinib
The crizotinib and entrectinib study populations were similar in many trial inclusion/exclusion criteria (). Of note, PROFILE 1001 included patients with ECOG PS 0–1. Those with ECOG PS 2 were only included under special circumstances (n = 1). By contrast, the entrectinib trials included patients with ECOG PS of 0–2, meaning that those trials may have included patients of poorer performance status. Higher ECOG PS was estimated in the IPD to be significantly associated with worse outcomes. In addition, the PROFILE 1001 trial had a considerably longer follow-up period.
Table 1. Key inclusion and exclusion criteria for included clinical studies.
There were key differences in patient baseline characteristics between PROFILE 1001 and the aggregate population for STARTRK-1, STARTRK-2 and ALKA-372-001, including imbalances in sex, ECOG PS and smoking history (). The CNS metastasis rate in the PROFILE 1001 trial was not reported, and therefore we could not assess balance between the studies in this key variable.
Table 2. Key differences in patient baseline characteristics and efficacy outcomes for included clinical studies.
In the clinical trial-to-clinical trial analysis, an unadjusted comparison evaluated unadjusted outcomes from the crizotinib trial versus outcomes from the entrectinib trial (). IPD from PROFILE 1001 were then adjusted to match the aggregate summary baseline characteristics from the entrectinib trials. Efficacy data from the crizotinib trial were adjusted for baseline characteristics that were also available for the entrectinib trials (age, sex, ECOG PS and smoking status). Once the efficacy data were adjusted, they were indirectly compared with entrectinib in the STC.
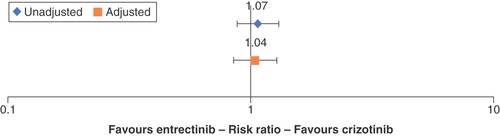
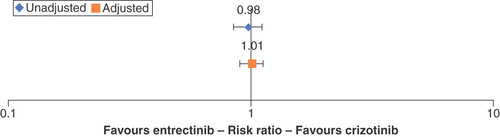
Crizotinib-treated patients had a higher but nonsignificant likelihood of responding to the treatment (ORR) relative to entrectinib (risk ratio [RR]: 1.07; 95% CI: 0.88–1.31) in the unadjusted comparison (). After adjustment for age, sex, ECOG PS and smoking status, the STC models estimated the ORR of crizotinib relative to entrectinib to be RR = 1.04 (95% CI: 0.85–1.28).
Bars represent 95% CIs.
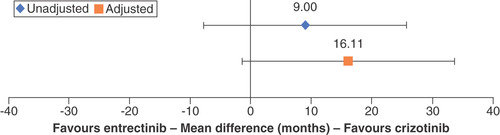
The comparative effectiveness of DOR in the unadjusted comparison showed a nonsignificant 9.00-month gain in mDOR for crizotinib patients relative to entrectinib patients (95% CI: -7.75–25.75; ). The STC adjustment model fitted the covariates of sex and smoking status. After adjustment, the mean difference (MD) of mDOR shifted in favor of crizotinib to 16.11 months (95% CI: -1.57–33.69), which remained nonsignificant ().
Bars represent 95% CIs.
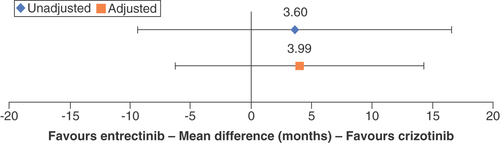
The unadjusted comparison found a favorable but nonsignificant mPFS MD of 3.60 months (95% CI: -9.37–16.57) for crizotinib versus entrectinib. After adjustment for age, sex, ECOG PS and smoking status, the results of the STC still favored crizotinib mPFS, with a nonsignificant mean difference of 3.99 months (95% CI: -6.27–14.25; ).
Bars represent 95% CIs.
Finally, the 12-month landmark OS difference for crizotinib in the unadjusted comparison estimated a nonsignificant 2% increased risk of death (RR: 0.98; 95% CI: 0.85–1.11; ). The STC model fitted the covariate age, sex, ECOG PS and smoking status for adjustment and estimated a nonsignificant 1% treatment advantage of crizotinib (RR: 1.01; 95% CI: 0.90–1.12).
Bars represent 95% CIs.
Clinical trial-to-RWE comparison: crizotinib versus crizotinib
A separate clinical trial-to-RWE analysis compared crizotinib clinical efficacy data from the PROFILE 1001 trial versus RWE data for crizotinib from the Flatiron Health and Ontada (Oncology Insights & Technology) data analyses. Key differences between PROFILE 1001 and the RWE studies included age, sex, ECOG PS and smoking history ().
Table 3. Key differences in patient baseline characteristics and efficacy outcomes for PROFILE 1001 and real-world data.
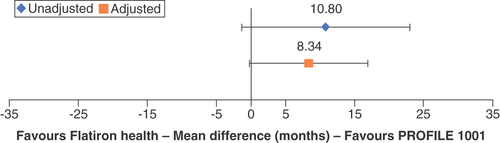
The PROFILE 1001 clinical trial reported longer median PFS than the Flatiron Health study: 19.3 versus 8.5 months, a difference of 10.8 months. Following adjustment for ECOG PS and smoking status, the MD in mPFS was attenuated to 8.3 months (95% CI: 0.26–16.94; ). Similarly, PROFILE 1001 reported longer median OS than the Flatiron Health study: 51.4 versus 19.9 months, a difference of 31.5 months. Following adjustment for ECOG PS and smoking status, the MD in median OS decreased to 23.0 months (95% CI: not estimable [NE]). The upper bound of median OS was not reached (<50% of the patients had died) in the Flatiron Health and Ontada (Oncology Insights & Technology) analysis; therefore CIs of the STC could not be estimated, and statistical significance could not be assessed (data not shown).
Bars represent 95% CIs.
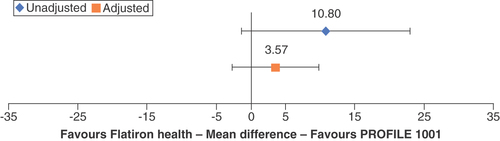
A substantial proportion (55%) of patients in the Flatiron Health study lacked ECOG PS information. A sensitivity analysis demonstrated the potential impact of missing ECOG PS values on population-adjusted outcomes. This exploratory sensitivity analysis assumed the Ontada population, in which 80% of patients had an ECOG PS of 1 or 2 after rebalancing for unreported ECOG status, was representative. The analysis thus utilized this ECOG PS distribution to observe the PFS and OS comparisons between PROFILE 1001 and the Flatiron Health RWE study and calculate population-adjusted estimates of clinical trial efficacy in the real-world population. This exploratory analysis led to smaller calculated differences in PFS and OS between the clinical trial and real-world data. After adjustment, the 10.8-month MD in PFS decreased to 3.6 months (95% CI: -2.69–9.84; ), and the 31.5-month MD in median OS decreased to 9.6 months (95% CI: NE; data not shown).
Error bars represent 95% CIs.
When comparing the PROFILE 1001 clinical data with the Ontada data, the unadjusted difference in median OS was calculated to be 15.2 months (in favor of PROFILE 1001), suggesting higher median OS in the clinical trial setting than the real-world population. However, strong imbalances in patient characteristics were noted with respect to sex, age (≤65 years), ECOG PS and smoking status. Following adjustment, the MD changed to -10.5 months (95% CI: NE) in favor of Ontada (data not shown), suggesting that the real-world median OS was higher than in the clinical trial after accounting for differences in patient populations. Comparisons of mPFS could not be completed as Ontada did not provide PFS data.
Discussion
In this analysis we undertook two categories of STC: clinical trial-to-clinical trial data (crizotinib vs entrectinib, to gain insight on the comparative effectiveness of the two drugs as demonstrated in clinical studies), and clinical trial-to-RWE (clinical and RWE data for crizotinib, to determine the comparative effectiveness of the same treatment in a clinical study vs the real world).
In the clinical trial-to-clinical trial STC using data from the regulatory approval-supporting trials for crizotinib and entrectinib, crizotinib was associated with nonsignificant but longer mPFS and mDOR both before and after adjustment compared with entrectinib. Crizotinib showed nonsignificant ORR advantages over entrectinib both before and after adjustment. The 12-month OS landmark for crizotinib increased, with nonsignificant differences, relative to entrectinib following adjustment, though the unadjusted analysis showed nonsignificant increased risk of death for crizotinib.
There were several limitations to the clinical trial-to-clinical trial portion of the STC. The studies enrolled relatively small patient numbers, and outcomes were assessed differently: via investigator in PROFILE 1001 and via blinded independent central review in the comparators. Analyses had to be unanchored due to the single-arm study designs, leading to high variability and potential selection bias. Moreover, the between-trial difference of inclusion criteria for ECOG PS could be nullified through matching. However, these limitations were otherwise mitigated through similar trial designs, patient criteria and limited sample of patients with ECOG PS 2 (<10%) in the Dziadziuszko et al. study [Citation10]. Another limitation of this comparative effectiveness analysis was the inability to adjust for presence of CNS metastases at baseline; although patients may have had CNS metastases at study entry of PROFILE 1001, these data were not collected at baseline, in contrast to the entrectinib registrational study.
In the clinical trial-to-clinical trial comparison, data from the pivotal registrational trials were included. For crizotinib, which was first approved by the FDA in 2016, several other prospective trials, including those conducted by cooperative groups, have been reported [Citation35–38]. The mPFS of crizotinib in these trials has shown a wide variation. A 2020 systematic review and meta-analysis of efficacy and safety data of crizotinib in patients with ROS1-positive NSCLC found that mPFS ranged from 5.5 to 22.8 months, with a pooled mPFS of 14.3 months [Citation39]. Possible explanations include variations in baseline characteristics, including differences in ECOG PS and presence of baseline CNS metastases [Citation40]. A similar recently published clinical trial-to-clinical trial comparison by Chu et al. included MAIC of the pivotal data of crizotinib from PROFILE 1001 and IPD for entrectinib, including from the ALKA-372-001, STARTRK-1 and STARTRK-2 studies in ROS1-positive NSCLC [Citation14]. That analysis, like ours, found no significant difference in PFS or OS outcomes for crizotinib versus entrectinib, and it found that ORR results may favor entrectinib. The ORR benefit for entrectinib was significant in the Chu et al. analysis but not in this analysis. One key difference between the previous analysis and ours is that Chu et al. developed three scenarios for adjusting the PROFILE 1001 results based on different assumptions of the frequency of brain metastases in the study, whereas our analysis did not adjust for brain metastases at baseline as these data were not captured on entry into the crizotinib PROFILE 1001 study. Additionally, the MAIC used an earlier crizotinib and entrectinib data cut [Citation41,Citation42], whereas our STC applies the updated OS from PROFILE 1001 and a larger sample size with at least 6 months’ follow-up from the integrated entrectinib analysis [Citation9,Citation10].
Furthermore, our analysis applied STC as the population adjustment methodology. Support for STC as an alternative to MAIC is gaining momentum due to its potential to reduce bias in nearly all instances of population adjustment, particularly when sample sizes are small (i.e., <500 observations) or when covariate distributions do not fully overlap between studies, as demonstrated in simulation studies [Citation31]. MAIC is incapable of extrapolating covariate effects beyond the limits seen in the index trial [Citation31]. For these reasons, we expect that the methods pursued in this analysis were less prone to bias during population adjustment than the MAIC performed in the study of Chu et al. [Citation14].
Notably, a phase III randomized controlled trial (NCT04603807) which is expected to begin enrollment in 2021 is undertaking a head-to-head comparison of crizotinib and entrectinib in ROS1-positive NSCLC, including patients with brain metastases [Citation43]. This study will provide direct evidence for the comparative efficacy and safety of the two drugs in a clinical trial setting.
In the clinical trial-to-RWE STC, the point estimate differences were nonsignificant between the trial end point values and the RWE. Population-adjusted analyses suggest that a portion of the difference was attributable to imbalances in patient and disease characteristics between the clinical trial and real-world populations. In a sensitivity analysis, the difference between the PROFILE 1001 and Flatiron Health RWE end points was further reduced, suggesting that the estimated efficacy was strongly dependent on the distribution of ECOG PS.
Limitations to the clinical trial-to-RWE STC reflect the challenges inherent in attempting to generalize clinical trial outcomes to the real world. The end points and outcomes reported in RWE were variable, and there was a lack of consistent data on response rates in real-world data sets, which complicated attempts to compare clinical data with RWE.
Population-adjusted comparisons with RWE are an area of ongoing research. In the absence of a common comparator, these can take the form of unanchored analyses for which an assumption of conditional constancy of absolute effects is necessary. The assumption can be difficult to validate due to differences in study designs, incomplete reporting and/or retrospective ascertainment of patient characteristics and clinical end points in RWE.
Notable differences were seen with and without adjustment for baseline ECOG PS scores. As missing data are common in RWE analyses, strong assumptions (i.e., that the Ontada ECOG PS distribution was representative despite being under-reported) must be made about the ECOG PS scores in the RWE groups to be able to perform STC and assume constancy. This led to an overadjustment attributable to ECOG PS in the PROFILE 1001-to-Ontada comparison of mPFS, where a difference of 25.7 months between the unadjusted and adjusted analyses was observed. This inability to match RWE efficacy indicates that considerable caution should be exercised when there is under-reporting of key clinical characteristics. As this is a crizotinib-to-crizotinib comparison, the ascertained difference between clinical trial and RWE is implicitly a demonstration of how the sensitive the results are to the limitations of clinical trial-to-RWE comparisons. It could be expected that the result of an STC comparing the same drug in these contexts would be close to null if all analytical limitations were removed. Given a correct assumption concerning the distribution of ECOG PS in Ontada, this indicates that there is extensive unmeasured confounding bias common to observational studies, demonstrating that the clinical STC models were unable to estimate a generalizable outcome when matched to RWE sources.
These considerations represent the limitations associated with using RWE in comparative effectiveness. Differences in populations, interventions, comparators, outcomes and study designs increase the probability that the assumptions of indirect comparisons (similarity, homogeneity and consistency) will be violated. Ascertainment of retrospective outcomes and patient characteristics may hinder the ability to overcome population differences using methods like STC and/MAIC.
Conclusion
Overall, we concluded that crizotinib and entrectinib have comparable or similar efficacy in ROS1-positive NSCLC, or at least found no firm evidence that one treatment should be favored over the other. However, the details on several key variables that would permit appropriate comparisons, most notably CNS disease, were lacking. A direct head-to-head comparison of the two drugs is planned, which may permit these predictions to be validated or refuted. Opportunities for additional research include conducting an observational study on patients with ROS1-positive NSCLC with similar baseline characteristics receiving either crizotinib or entrectinib, derived from the same RWE data source, to better understand the relative effectiveness of these drugs in the real world.
Large differences in efficacy results for crizotinib in clinical trials versus RWE were mostly attenuated after adjustment for baseline characteristics, suggesting that imbalances in patient characteristics, rather than treatment setting, impact study outcomes. There may be opportunities to develop additional statistical methods to improve matching from clinical trials to RWE and to increase education about the variation in RWE between different sources.
Overall, the findings of this analysis add to the body of evidence on the relative effectiveness of currently approved targeted therapies in NSCLC in the absence of head-to-head trials.
Gene-specific cancer treatments are gaining traction worldwide. Since 2010, two treatments for ROS1-positive metastatic non-small cell lung cancer (NSCLC) have been approved in the USA: crizotinib and entrectinib. There are no published data on the head-to-head clinical efficacy of these drugs.
In this analysis, indirect comparisons of efficacy data from single-arm open-label studies in both drugs (clinical trial-to-clinical trial; PROFILE 1001 in crizotinib vs ALKA-372-001/STARTRK-1/STARTRK-2 in entrectinib) and of clinical data on crizotinib versus real-world evidence (RWE) of crizotinib efficacy (clinical trial-to-RWE; PROFILE 1001 vs Flatiron Health and Ontada RWE) were carried out.
Simulated treatment comparisons of the results were conducted by adjusting for differences in baseline patient characteristics, including age, sex, Eastern Cooperative Oncology Group performance status (ECOG PS) and smoking status. Primary and sensitivity analyses were employed.
In the clinical trial-to-clinical trial comparison, after adjustment for population differences, crizotinib was associated with nonsignificant but numeric advantages in overall response rate (risk ratio: 1.04), median duration of response (increase of 16.11 months) and median progression-free survival (mPFS; increase of 3.99 months). The adjusted comparison of 12-month landmark overall survival (OS) estimated a nonsignificant 1% treatment advantage for crizotinib (risk ratio: 1.01).
After adjustment in the clinical trial-to-RWE comparison for crizotinib versus Flatiron RWE, the clinical mPFS was 8.3 months longer than in the RWE (nonsignificant). The clinical median OS was 23.0 months longer than in the RWE (significance could not be estimated). Missing ECOG PS information in the RWE required an exploratory sensitivity analysis, in which mean differences in mPFS decreased to 3.6 months and median OS decreased to 9.6 months (significance could not be estimated). Versus Ontada RWE, the difference in median OS favored RWE by 10.5 months (significance could not be estimated) as compared with clinical data.
Limitations of the clinical trial-to-clinical trial analysis included comparison of unanchored phase II clinical studies and differences in study inclusion criteria, specifically ECOG PS and brain metastasis. The clinical trial-to-RWE analysis was complicated by unmeasured confounding inherent to observational studies, with limited information available to control for these differences analytically.
In the absence of a direct head-to-head clinical comparison, simulated treatment comparisons can adjust for differences in patient and disease characteristics between clinical studies to make comparisons more valid. These comparisons become complicated when comparing against RWE cohorts.
Author contributions
M Groff and P Daniele were responsible for data analysis and interpretation. M Groff, G Tremblay and L Iadeluca participated in the study conception and initial drafting. All authors participated in data interpretation, revising and review of the manuscript.
Financial & competing interests disclosure
This study was sponsored by Pfizer. L Iadeluca, K Wilner, R Wiltshire, L Bartolome, T Usari and J Cappelleri are employees of Pfizer. M Groff, G Tremblay and P Daniele are employees of Cytel, which was a paid consultant to Pfizer in connection with the development of this manuscript. DR Camidge served as a consultant and advisory board member to Abbvie, Amgen, Anchiarno (SAB), Anheart, Apollomics(SRC), AstraZeneca (SRC/SC), AstraZeneca/Daiichi (ILD adjudication committee), Beigene (DSMB, DSMC), Bio-Thera (DSMB), Blueprint, BMS, Daiichi-Sankyo (ILD adjudication committee), Eisai, Elevation (SRC), Eli Lilly (DSMB and NCCN), EMD Serono, GSK, Helsinn (DSMB), Hengrui (DSMC), Janssen, Kestrel (SAB, Shares), Medtronic, Mersana, Mirati, Nuvalent (SAB), Onkure, Pfizer, Puma (NCCN), Qilu, Ribon, Roche, Roche/Genentech, Sanofi, Seattle Genetics, Takeda, Turning Point, and has received research funding from Inivata. DR Camidge is an employee of the University of Colorado Cancer Center. DR Camidge served as the principal investigator on company sponsored clinical trials, including Abbvie, AstraZeneca, Blueprint, Dizal, Inhibrx, Karyopharm, Pfizer, Phosplatin, Psioxus, Rain, Roche/Genentech, Seattle Genetics, Takeda, Turning Point, Verastem. The authors have no other relevant affiliations or financial involvement with any organization or entity with a financial interest in or financial conflict with the subject matter or materials discussed in the manuscript apart from those disclosed.
Editorial support was funded by Pfizer; assistance was provided by D Cooperson Vieweg of Cytel.
Data sharing statement
The authors certify that this manuscript reports the secondary analysis of clinical trial data that have been shared with them, and that the use of this shared data is in accordance with the terms (if any) agreed upon their receipt. The source of this data is: PROFILE 1001 (NCT00585195); ALKA-372-001 (EudraCT 2012-000148-88); STARTRK-1 (NCT02097810); STARTRK-2 (NCT02568267); ongoing trial (no data available for this manuscript): NCT04603807. Upon request, and subject to review, Pfizer will provide the data that support the findings of this study. Subject to certain criteria, conditions, and exceptions, Pfizer may also provide access to the related individual anonymized participant data. See https://www.pfizer.com/science/clinical-trials/trial-data-and-results for more information.
Additional information
Funding
References
- König D , SavicPrince S, RothschildSI. Targeted therapy in advanced and metastatic non-small cell lung cancer. an update on treatment of the most important actionable oncogenic driver alterations. Cancers13(4), 804 (2021).
- Bergethon K , ShawAT, OuSHIet al. ROS1 rearrangements define a unique molecular class of lung cancers. J. Clin. Oncol.30(8), 863–870 (2012).
- Rikova K , GuoA, ZengQet al. Global survey of phosphotyrosine signaling identifies oncogenic kinases in lung cancer. Cell131(6), 1190–1203 (2007).
- AACR Project GENIE Consortium . AACR Project GENIE: powering precision medicine through an international consortium. Cancer Discov.7(8), 818–831 (2017).
- European Medicines Agency . Xalkori (2018). www.ema.europa.eu/en/medicines/human/EPAR/xalkori
- European Medicines Agency . Rozlytrek (2020). www.ema.europa.eu/en/medicines/human/EPAR/rozlytrek
- FDA . FDA approves crizotinib capsules (2016). www.fda.gov/drugs/resources-information-approved-drugs/fda-approves-crizotinib-capsules
- FDA . FDA approves entrectinib for NTRK solid tumors and ROS-1 NSCLC (2019). www.fda.gov/drugs/resources-information-approved-drugs/fda-approves-entrectinib-ntrk-solid-tumors-and-ros-1-nsclc
- Shaw Riely GJ , BangYJet al. Crizotinib in ROS1-rearranged advanced non-small-cell lung cancer (NSCLC): updated results, including overall survival, from PROFILE 1001. Ann. Oncol.30(7), 1121–1126 (2019).
- Dziadziuszko R , KrebsMG, DeBraud Fet al. Updated integrated analysis of the efficacy and safety of entrectinib in locally advanced or metastatic ROS1 fusion-positive non-small-cell lung cancer. J. Clin. Oncol.39(11), 1253–1263 (2021).
- Clinicaltrials.gov . A phase 1, multicenter, open-label study of oral entrectinib (RXDX-101) in adult patients with locally advanced or metastatic cancer confirmed to be positive for NTRK1, NTRK2, NTRK3, ROS1, or ALK molecular alterations (2020). www.clinicaltrials.gov/ct2/show/NCT02097810
- Clinicaltrials.gov . An open-label, multicenter, global phase 2 basket study of entrectinib for the treatment of patients with locally advanced or metastatic solid tumors that harbor NTRK1/2/3, ROS1, or ALK gene rearrangements (2021). www.clinicaltrials.gov/ct2/show/NCT02568267
- European Medicines Agency . Clinical trials for eudract_number:2012-004053-88. www.clinicaltrialsregister.eu/ctr-search/search?query=eudract_number:2012-004053-88
- Chu P , AntoniouM, BhutaniMK, AziezA, DaiglM. Matching-adjusted indirect comparison: entrectinib versus crizotinib in ROS1 fusion-positive non-small cell lung cancer. J. Comp. Eff. Res.9(12), 861–876 (2020).
- Burcu M , DreyerNA, FranklinJMet al. Real-world evidence to support regulatory decision-making for medicines: considerations for external control arms. Pharmacoepidemiol. Drug Saf.29(10), 1228–1235 (2020).
- Salles G , BachyE, SmolejLet al. Single-agent ibrutinib in RESONATE-2™ and RESONATE™ versus treatments in the real-world PHEDRA databases for patients with chronic lymphocytic leukemia. Ann. Hematol.98(12), 2749–2760 (2019).
- Feinberg BA , ZettlerME, KlinkAJ, LeeCH, GajraA, KishJK. Comparison of solid tumor treatment response observed in clinical practice with response reported in clinical trials. JAMA Netw. Open4(2), e2036741 (2021).
- Bartlett VL , DhruvaSS, ShahND, RyanP, RossJS. Feasibility of using real-world data to replicate clinical trial evidence. JAMA Netw. Open2(10), e1912869 (2019).
- Doebele RC , PerezL, TrinhHet al. Time-to-treatment discontinuation (TTD) and real-world progression-free survival (rwPFS) as endpoints for comparative efficacy analysis between entrectinib trial and crizotinib real-world ROS1 fusion-positive (ROS1+) NSCLC patients. J. Clin. Oncol.37(Suppl. 15), 9070 (2019).
- Doebele RC , PerezL, TrinhHet al. Comparative effectiveness analysis between entrectinib clinical trial and crizotinib real-world data in ROS1+ NSCLC. J. Comp. Eff. Res.10(17), 1271–1282 (2021).
- Bucher HC , GuyattGH, GriffithLE, WalterSD. The results of direct and indirect treatment comparisons in meta-analysis of randomized controlled trials. J. Clin. Epidemiol.50(6), 683–691 (1997).
- Jansen JP , NaciH. Is network meta-analysis as valid as standard pairwise meta-analysis? It all depends on the distribution of effect modifiers. BMC Med.11(1), 159 (2013).
- Donegan S , WilliamsonP, GambleC, Tudur-SmithC. Indirect comparisons: a review of reporting and methodological quality. PLoS ONE5(11), e11054 (2010).
- Kiefer C , SturtzS, BenderR. Indirect comparisons and network meta-analyses. Dtsch. Arzteblatt Int.112(47), 803–808 (2015).
- Phillippo D , AdesT, DiasS, PalmerS, AbramsKR, WeltonN. NICE DSU Technical Support Document 18: methods for population-adjusted indirect comparisons in submissions to NICE (2016). https://research-information.bris.ac.uk/en/publications/nice-dsu-technical-support-document-18-methods-for-population-adj
- Phillippo DM , AdesAE, DiasS, PalmerS, AbramsKR, WeltonNJ. Methods for population-adjusted indirect comparisons in health technology appraisal. Med. Decis. Making38(2), 200–211 (2018).
- Ishak K , ProskorovskyI, BenedictA. Simulation and matching-based approaches for indirect comparison of treatments. Pharmacoeconomics33(6), 537–549 (2015).
- Caro JJ , IshakK. No head-to-head trial? Simulate the missing arms. Pharmacoeconomics28(10), 957–967 (2010).
- Austin PC . Using the standardized difference to compare the prevalence of a binary variable between two groups in observational research. Commun. Stat. Simul. Comput.38(6), 1228–1234 (2009).
- Signorovitch JE , SikiricaV, ErderMHet al. Matching-adjusted indirect comparisons: a new tool for timely comparative effectiveness research. Value Health15(6), 940–947 (2012).
- Phillippo DM , DiasS, AdesAE, WeltonNJ. Assessing the performance of population adjustment methods for anchored indirect comparisons: a simulation study. Stat. Med.39(30), 4885–4911 (2020).
- Putila J , RemickSC, GuoNL. Combining clinical, pathological, and demographic factors refines prognosis of lung cancer: a population-based study. PLoS ONE6(2), e17493 (2011).
- Alexander M , WolfeR, BallDLet al. Lung cancer prognostic index: a risk score to predict overall survival after the diagnosis of non-small-cell lung cancer. Br. J. Cancer117(5), 744–751 (2017).
- Waterhouse D , IadelucaL, SuraSet al. Real-world outcomes among crizotinib-treated patients with ROS1-positive advanced non-small-cell lung cancer: a community oncology-based observational study. Target. Oncol.17(1), 25–33 (2021).
- Landi L , ChiariR, TiseoMet al. Crizotinib in MET-deregulated or ROS1-rearranged pretreated non-small cell lung cancer (METROS): a phase II, prospective, multicenter, two-arms trial. Clin. Cancer Res.25(24), 7312–7319 (2019).
- Michels S , MassutíB, SchildhausHUet al. Safety and efficacy of crizotinib in patients with advanced or metastatic ROS1-rearranged lung cancer (EUCROSS): a European phase II clinical trial. J. Thorac. Oncol.14(7), 1266–1276 (2019).
- Moro-Sibilot D , CozicN, PérolMet al. Crizotinib in c-MET- or ROS1-positive NSCLC: results of the AcSé phase II trial. Ann. Oncol.30(12), 1985–1991 (2019).
- Wu YL , YangJCH, KimDWet al. Phase II study of crizotinib in East Asian patients with ROS1-positive advanced non-small-cell lung cancer. J. Clin. Oncol.36(14), 1405–1411 (2018).
- Vuong HG , NguyenTQ, NguyenHC, NguyenPT, HoATN, HassellL. Efficacy and safety of crizotinib in the treatment of advanced non-small-cell lung cancer with ROS1 rearrangement or MET alteration: a systematic review and meta-analysis. Target. Oncol.15(5), 589–598 (2020).
- Landi L , CappuzzoF. How selecting best upfront therapy for metastatic disease? Focus on ROS1-rearranged disease. Transl. Lung Cancer Res.9(6), 2686–2695 (2020).
- Shaw AT , OuSHI, BangYJet al. Crizotinib in ROS1-rearranged non-small-cell lung cancer. N. Engl. J. Med.371(21), 1963–1971 (2014).
- Drilon A , SienaS, DziadziuszkoRet al. Entrectinib in ROS1 fusion-positive non-small-cell lung cancer: integrated analysis of three phase 1–2 trials. Lancet Oncol.21(2), 261–270 (2020).
- Clinicaltrials.gov . Randomized, open label, multicenter, phase III study of entrectinib versus crizotinib in patients with locally-advanced or metastatic non-small cell lung cancer harboring ROS1 gene rearrangements with and without central nervous system metastases (2021). www.clinicaltrials.gov/ct2/show/NCT04603807