
Abstract
Aim: The RAISE project assessed whether deep learning could improve early progression-free survival (PFS) prediction in patients with neuroendocrine tumors. Patients & methods: Deep learning models extracted features from CT scans from patients in CLARINET (NCT00353496) (n = 138/204). A Cox model assessed PFS prediction when combining deep learning with the sum of longest diameter ratio (SLDr) and logarithmically transformed CgA concentration (logCgA), versus SLDr and logCgA alone. Results: Deep learning models extracted features other than lesion shape to predict PFS at week 72. No increase in performance was achieved with deep learning versus SLDr and logCgA models alone. Conclusion: Deep learning models extracted relevant features to predict PFS, but did not improve early prediction based on SLDr and logCgA.
Plain language summary
The use of deep learning models to predict progression-free survival in patients with neuroendocrine tumors: Neuroendocrine tumors (NET) are slow-growing cancers. How well cancers respond to treatment is usually measured using ‘Response Evaluation Criteria in Solid Tumors (RECIST)’, which is based on measuring the size of tumors. RECIST is not well suited for assessing NETs as these tumors often grow slowly and rarely shrink significantly, so it is difficult to tell whether a treatment has any effect. A better way of measuring how well NETs are responding to treatment is needed, to ensure that patients receive the right treatment as early as possible.
The RAISE project aimed to use a type of artificial intelligence (AI) called ‘deep learning’ to examine images of NETs, taken from patients in a clinical trial of treatment with lanreotide, to help predict how they might respond to treatment. These images were analyzed by the deep learning AI to see if there are any features of tumors, other than shape or size, that may help to predict response to treatment.
The project showed that this technology can detect features in images of NETs, other than the shape and size of tumors, that are useful for predicting how well a treatment might work for an individual patient. However, this technology could not improve prediction of how well a treatment would work at an earlier stage compared with other currently used indicators.
Overall, further research and work is needed to improve this technology. However, these results show that deep learning may have the potential to improve prediction of treatment response in patients with NETs.
Neuroendocrine tumors (NET), a subset of neuroendocrine neoplasms, are rare. However, incidences of NETs appear to be rising, partly due to improvements in diagnosis through increased use of endoscopic and imaging procedures in clinical practice, and increased awareness [Citation1]. Appropriate diagnosis and management of NETs demands a multidisciplinary approach using pathological, biochemical, radiologic and nuclear and surgical clinical methods [Citation2–4].
Ki-67 is considered a key prognostic factor in gastroenteropancreatic NETs and is a major component for their classification [Citation5,Citation6], with there being a positive correlation between Ki-67 and disease stage [Citation5,Citation7]. However, Ki-67 assessment still suffers from intra- and inter-observer variability, especially for differentiating Grade 1 NETs from Grade 2 [Citation8]. Ki-67 has also been reported to vary during the course of the disease and between primary and metastatic sites [Citation9,Citation10]. Therefore, its value in predicting NET grades and associated progression may be limited. Biochemical markers for NETs also include elevated chromogranin A (CgA) levels; decreases in this biomarker have been associated with longer progression-free survival (PFS) in patients receiving somatostatin analogs (SSA) or other targeted therapies [Citation11,Citation12]. However, CgA is limited as a marker of NETs due to its non-specificity [Citation13].
Advances in imaging techniques over the past 15 years have considerably improved effective diagnosis and clinical management of NETs [Citation14,Citation15]. Radiologic methods for NET assessment include conventional, cross-sectional imaging to determine physical tissue characteristics. Functional imaging of somatostatin receptor expression with 68Ga-SSA PET/CT plays a key role in diagnosis, staging and treatment selection in NETs [Citation15].
Imaging is also key to assessing tumor response, and Response Evaluation Criteria in Solid Tumors (RECIST) represents an established method to assess tumor response to systemic therapies in NETs. RECIST uses the sum of the longest diameter (SLD) of lesions to estimate the change in tumor burden in patients over a course of treatment [Citation16–18]. The SLD, together with the appearance of new lesions, is used to compute a categorical variable (complete response, partial response, stable disease, or progressive disease) to define PFS, which is often used as a primary end point in clinical trials in patients with NETs [Citation16,Citation17].
However, in patients with NETs, tumor response to therapies is often reflected by disease stabilization rather than significant tumor shrinkage [Citation19]; therefore, classifying a successful treatment response in terms of tumor shrinkage, according to RECIST, may be an oversimplification [Citation20]. In NETs, which are slow-growing, an earlier indication of treatment benefit than is provided by PFS and RECIST would aid the assessment of therapies and may improve outcomes for patients.
CLARINET (NCT00353496) was a pivotal, phase III, placebo-controlled trial, designed using response assessment with RECIST criteria, that evaluated the efficacy and safety of the SSA lanreotide for tumor control in patients with enteropancreatic NETs [Citation21]. Post-hoc analyses of data from CLARINET revealed the prognostic value of tumor growth rate (TGR) in patients with NETs; further validation of TGR as a potential marker of progression is ongoing [Citation20].
Other clinical and imaging features that do not rely on tumor size for estimating treatment response have been identified using CT texture analysis and may hold value in identifying patients with NETs who are at risk of early disease progression [Citation22]. Utilizing complex data to demonstrate the value of precision and personalized medicine will rely on emerging advances in deep learning concepts and artificial intelligence [Citation23]. These techniques may aid in the identification and segmentation of tumors, thereby improving diagnoses [Citation24]. Convolutional neural networks are the most commonly applied deep learning algorithms, and are capable of modelling complex relationships within imaging data to provide quantitative assessments of radiologic characteristics [Citation25]. One major limitation of deep learning algorithms is the high number of observations required for training [Citation23], which recently has been overcome using either generative adversarial networks to generate synthetic images from magnetic resonance imaging (MRI) [Citation26], or transfer learning techniques [Citation27]. The value of deep learning models in improving the accuracy of tumor grading in NETs has been demonstrated [Citation8,Citation26,Citation28], but their potential in the prediction of treatment response in patients with NETs is yet to be explored.
The Research for Artificial Intelligence-Based Surrogate Endpoint (RAISE) project aimed to leverage the potential of machine learning to create a multimodal surrogate end point for RECIST based on biochemical data and imaging biomarkers, allowing earlier prediction of treatment efficacy and PFS.
Materials & methods
Study design & included patients
The study design of CLARINET has been described previously [Citation21]. Briefly, CLARINET was a randomized, double-blind, placebo-controlled, multinational study that assessed the efficacy and safety of lanreotide in tumor control in patients with enteropancreatic NETs (N = 204; placebo: n = 103; lanreotide: n = 101). The CLARINET study was approved by all relevant local ethical committees. Consent was obtained from each patient after a full explanation of the purpose and nature of all procedures used.
Patients with advanced, well- or moderately-differentiated, non-functioning, somatostatin receptor-positive enteropancreatic NETs of Grade 1 or low Grade 2 (defined as a tumor proliferation index on staining for the Ki-67 antigen of <10%) and with documented disease-progression status on study were evaluated in CLARINET [Citation21]. Disease progression, and hence PFS, was evaluated using CT scans according to RECIST 1.0 in CLARINET. CT imaging was performed twice during screening, 12 weeks apart, to determine the baseline disease progression status of patients; the second image scan was used to determine target lesion sizes and was considered the baseline assessment in CLARINET.
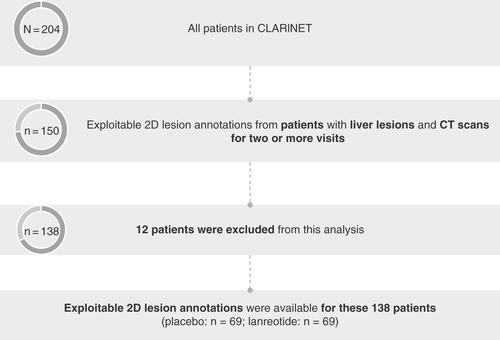
Patients from CLARINET were selected for analysis in RAISE as described in . Analysis was restricted to the subset of patients with liver lesions (77% of patients in CLARINET) and available CT scans for multiple visits (n = 150); patients were required to have CT scans for two or more visits to assess which patients had progressed at each timepoint relative to their last scan. Lesions examined were restricted to the liver for the following reasons: the liver is thought to be the most common site for NET metastasis [Citation29]; 67% of target lesions in CLARINET were in the liver; and there was concordance between overall SLD ratio (SLDr) and liver SLDr. In these patients, CgA was measured at each patient visit.
Patients enrolled in CLARINET with liver lesions and CT scans for multiple visits were selected for the RAISE analysis. 12 patients were excluded from this analysis during the annotation process due to the lack of targets or readable examinations.
CT: Computerized tomography.
Imaging data acquisition
The imaging data analyzed in RAISE consisted of 1690 annotated CT scans. Four types of CT scanners were used (GE, Philips, Siemens, Toshiba), with 25 different reconstruction kernels. Slice thickness ranged from 0.6–0.8 mm and images were acquired under four different contrast enhancement phases: non-enhanced, arterial, portal and delayed. Not every patient had all four phases of image acquisition across visits (number of scans, non-enhanced: n = 204; arterial: n = 434; portal: n = 607; delayed n = 166). Images acquired under the arterial and portal contrast enhancement phases were analyzed for the prediction of PFS, given that both enhancements were acquired at the majority of patient visits.
Annotation & masking
The annotation process involved identifying liver target lesions; target lesions were selected according to RECIST 1.0, which specified up to 10 target lesions per patient, with a maximum of five per organ, using available 1D annotations from the initial RECIST assessment in CLARINET (which was carried out by Bioclinica). For patients with no available annotations, the lesions were selected by a radiologist. Only one CT image slice was annotated per target tumor and annotations included any type of input provided by radiologists on the image, including manual delineation of the lesions in 2D. There was no consideration of 3D tumors in this analysis. Patients without readable examinations were excluded during the annotation process (n = 12); exploitable 2D lesion annotations were therefore available from 138 (placebo: n = 69; lanreotide: n = 69) of the 204 patients enrolled in CLARINET, representing 68% of the entire group.
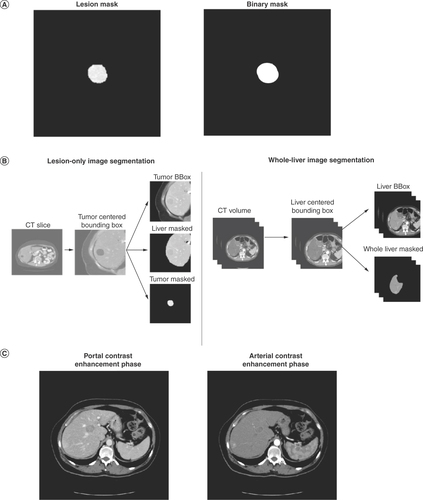
For liver images acquired under arterial and portal contrast enhancement phases, an artificial intelligence model, LiverNet, was developed to segment the liver on CT images. LiverNet has been trained on the liver tumor segmentation dataset and achieved a DICE coefficient of 0.95 on an external validation cohort. Segmenting the liver of patients using this ‘unsupervised’ approach allowed for the extraction of features from the liver itself, without focusing solely on the lesions.
For lesion images acquired under arterial and portal contrast enhancement phases, CT slices were extrapolated to the lowest pixel spacing. For each CT slice of an annotated tumor, a Hounsfield Unit windowing was applied for selection of specific ranges of intensities. The CT slice was then cropped on the center of the tumor and both a liver mask and tumor mask were applied to the slice.
Extraction of features from imaging via deep learning models
The deep learning methodology used to obtain the prediction of PFS at the patient level from imaging data in these patients is summarized in . To compensate for the low quantity of data available, transfer learning methodology was applied. This technique uses features learned for a different task on a larger dataset (dataset A), and assumes that the features learned from the larger dataset are relevant enough to be applied to a smaller dataset of interest (dataset B). For this study, deep learning algorithms were trained on data from ImageNet, a large dataset of 3.2 million natural images with more than 80,000 classes [Citation30,Citation31].
In the case of limited data availability for training a model (task B on dataset B), it is possible to use features learned for a different task (task A) on a larger dataset (dataset A). It is assumed that the features learned on task A can be applied to task B. The RAISE project trained deep learning algorithms on ImageNet data (dataset A) and then used them to extract features from CT scan images.
†Deep learning features were aggregated using average pooling.
CT: Computerized tomography; NET: Neuroendocrine tumor; PCA: Principal component analysis; PFS: Progression-free survival.
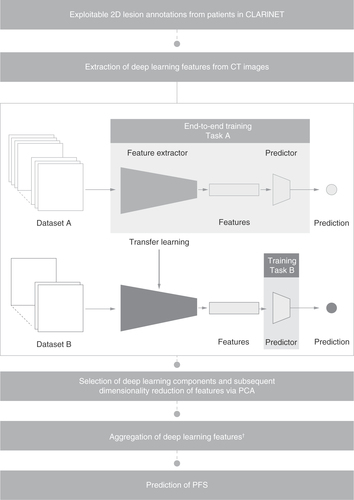
Deep learning features were extracted from lesion-only and whole-liver images using ResNet50 architecture, a convolutional neural networks trained on data from the ImageNet database, via transfer learning methodology (). Principal component analysis (PCA) is a multivariate technique that aims to extract important information and represent these extracted data as a set of new variables, called principal components, to highlight the pattern of similarity between the observations and variables [Citation32]. PCA was used to reduce the feature dimensionality from 2048 deep learning features, leading to the selection of 20 deep learning components (). A multi-layer perceptron, which is a feedforward artificial neural network consisting of three dense layers, was then used to predict PFS using these 20 components, aggregated via average pooling. Features were aggregated to account for the varying number of lesions per patient and to enable PFS prediction at the patient level.
Assessment of deep learning model performance
Six models were used to assess the features captured by deep learning. Deep learning model performance was compared when using a binary mask, representing the contour of the lesion (with all pixels within the lesion boundary set to 1 and all the pixels outside the lesion boundary set to 0), versus a lesion mask, representing the entirety of the lesion (with all pixels outside the lesion’s contour set to 0; A). Deep learning model performance was also compared using lesion-only versus whole-liver image inputs (B) and using images obtained in the portal versus arterial contrast enhancement phase (C). For evaluation of deep learning performance using portal versus arterial phase inputs, features were extracted from lesion-only images.
Deep learning model performance was compared using various CT liver image inputs. (A) Application of a binary mask and lesion mask to CT liver images. The binary mask represents the contour of the lesion (with all pixels within the lesion boundary set to 1 and all the pixels outside the lesion boundary set to 0). A lesion mask represents the entirety of the lesion (with all pixels outside of the lesion’s contour set to 0). (B) Segmentation of lesion-only and whole-liver image inputs. (C) Liver CT images obtained in the portal and arterial contrast enhancement phases.
CT: Computerized tomography
The performance of a three-variable Cox model was then compared with that of a two-variable Cox model to assess the additional value of deep learning in the prediction of PFS compared with currently available markers of progression. The three-variable model combined the deep learning output (using features extracted from lesion-only images) with the SLDr (defined as the ratio of the SLD at a given patient visit to the SLD at baseline) and change from baseline in logarithmically transformed CgA concentration (logCgA) at weeks 12, 24, 36, 48 and 72. The two-variable model was based on the SLDr and change in logCgA only. The performance of the two Cox models was assessed using c-index values for the prediction of PFS.
All models used for the assessment of deep learning performance were based on inputs per patient at each patient visit.
Statistical analysis
The performance of deep learning models was evaluated using Cox models, which were trained on samples of available data at each patient visit (week 12: n = 116; week 24: n = 105; week 36: n = 90; week 48: n = 78; week 72: n = 54), to assess PFS prediction in patients with NETs. The total number of patients at risk or censored and the number of events in the lanreotide and placebo arms are shown in . Performances of the models at week 12, 24, 36, 48 and 72 patient visits were compared using c-index values.
Table 1. Numbers of patients at risk and who had progressed or were censored at each visit in the RAISE analysis.
Each model was trained and tested using a Monte Carlo cross validation scheme with 100 splits. Monte Carlo cross validation is used to estimate the prediction ability of a selected model by leaving out a major part of the sample for validation; this enhances the impact of validation on modelling and increases the probability of selecting the best model, as compared with leave-one-out cross validation [Citation33]. C-index values reported for each model represent the mean from these 100 splits. Standard errors of the mean values are also presented. Assessment of the significance of model comparisons using other test coefficients was not possible due to the cross-validation evaluation.
Results
Patient disposition & baseline characteristics
Exploitable 2D lesion annotations were available from 138/204 patients who were enrolled in CLARINET and randomized to lanreotide (n = 69/101) or placebo (n = 69/103). Baseline characteristics were similar across treatment groups (). Four patients (6%) receiving lanreotide had progressive disease at baseline, compared with three patients (4%) receiving placebo. In the lanreotide arm, 67% of patients had a Grade 1 tumor (Ki-67 0–2%) versus 72% in the placebo arm; 33% versus 25% had a low Grade 2 tumor (Ki-67 3–10%).
Table 2. Baseline demographics and patient disease characteristics for the patients in the RAISE analysis.
Lesion versus binary mask model
Deep learning models with features computed using normal pixel values (lesion mask model) and those with features computed using binarized images (binary mask model) demonstrated similar performance at week 12 (A). This similar performance of the lesion mask model versus the binary mask model for the prediction of PFS was maintained to week 24 (0.70 vs 0.66; A). The performance gap then increased at each visit through to week 72: at this visit, the lesion mask model yielded a c-index value of 0.70 for PFS prediction, compared with a value of 0.58 for the binary mask model.
C-index values are reported for the prediction of PFS of deep learning models at the patient visits at weeks 12, 24, 36, 48 and 72. (A) Comparison of the performance of a lesion mask model versus a binary mask model. (B) Comparison of model performance using lesion-only image versus whole-liver image inputs. (C) Comparison of model performance using lesion images acquired in the portal versus arterial contrast enhancement phase. Reported c-index values represent the mean average from 100 models using a Monte Carlo cross validation scheme. Error bars represent standard error.
PFS: Progression-free survival.
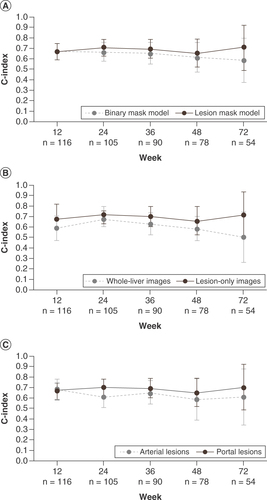
Lesion-only versus whole-liver image inputs
C-index values for PFS prediction were generally greater for models using lesion-only images compared with whole-liver image inputs (B). At week 12, the model using lesion-only images achieved a c-index value of 0.66 for the prediction of PFS versus a c-index value of 0.58 using whole-liver images. The performance of the models was similar at week 24 (model using lesion-only images: 0.70; model using whole-liver images: 0.67). By week 72, the performance gap had increased, with the model using lesion-only images reaching a c-index value of 0.70 compared with a c-index value of 0.49 for the model using whole-liver images.
Portal versus arterial contrast enhancement phase image inputs
At week 12, the performances of the models using images obtained in the portal (c-index: 0.66) versus arterial (c-index: 0.69) contrast enhancement phase were similar (C).
However, at subsequent visits, models using lesion-only images obtained in the portal contrast enhancement phase generally yielded better performance for the prediction of PFS than models using images obtained in the arterial phase. By week 24, models using portal contrast enhancement phase images yielded a c-index value of 0.70 versus a c-index value of 0.61 using images obtained in the arterial contrast enhancement phase. This increased performance was maintained to week 72 (portal phase model: 0.70; arterial phase model: 0.61).
Model performance using deep learning models, SLDr & logCgA
At week 12, the two-variable Cox model, based on SLDr and logCgA, achieved a c-index value of 0.78 for the prediction of PFS. The three-variable model, which added the deep learning model output to the two-variable model, did not show notably improved performance compared with the two-variable model, achieving a c-index value of 0.80 for the prediction of PFS at week 12 ().
C-index values are reported for the prediction of PFS for a three-variable model incorporating the deep learning model output with SLDr and change from baseline in logCgA and the two-variable model combining SLDr and change from baseline in logCgA at the patient visits at weeks 12, 24, 36, 48 and 72. Reported c-index values represent the mean average from 100 models using a Monte Carlo cross validation scheme. Error bars represent standard error.
CgA: Chromogranin A; PFS: Progression-free survival; SLDr: Sum of longest diameter ratio.
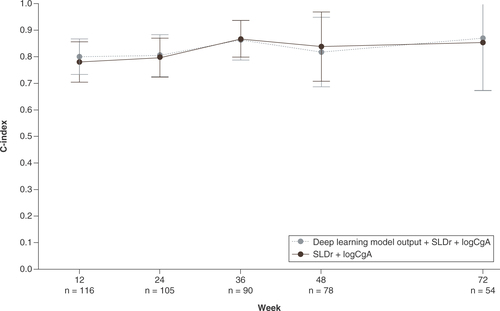
No differences in the performances of the two models were reported at each patient visit through 72 weeks. At week 72, the two-variable Cox model and the three-variable Cox model with the additional deep learning model output achieved c-index values of 0.86 and 0.87, respectively, for the prediction of PFS.
Discussion
The value of deep learning models in reflecting tumor grading in NETs is becoming increasingly recognized due to recent studies demonstrating the application of these techniques in predicting grades of NETs from tumor images [Citation8,Citation26,Citation28]. However, exploration of their value in improving the prediction of treatment response has been limited to date. The RAISE project aimed to assess the value of deep learning models in the prediction of PFS in patients with well- or moderately-differentiated NETs, with Ki-67 index of up to 10%, treated with lanreotide or placebo.
This study found that deep learning models can be trained to capture and model information from CT images, complementary to the lesion shape and size, that may be relevant to the prediction of PFS. This finding was demonstrated by the improved performance of a lesion mask model, in which all pixels outside of the lesion’s contour are set to 0 (black pixels, hence masking any information that could be extracted from the surrounding area), compared with a binary mask model. In a binary mask model, all pixels within the lesion boundary are set to 1 (white pixels) and all the pixels outside the lesion boundary are set to 0, meaning that a signal can only be generated from the lesion’s contours. The performances of the lesion mask and binary mask models were similar at week 12, indicating that the additional signal in the lesion image that was captured by the deep learning model is not useful for the prediction of PFS at earlier visits. By week 24, the difference in model performance could be established, suggesting that deep learning models could have value in predicting treatment response and PFS from 6 months of treatment onwards. It must be noted, however, that the prediction of PFS made at later stages was based on a significantly smaller dataset (n = 54 at week 72 compared with n = 116 at week 12) due to study discontinuations, which may have contributed to the variability in performance.
Models using lesion images obtained in the portal contrast enhancement phase yielded greater predictive performance than those obtained in the arterial phase. This performance gap may be partially explained by lesion segmentation being more accurate in the portal versus arterial contrast enhancement phase, allowing the model to better determine the lesion size and more accurately predict PFS. Hence, this finding may highlight the need for expert-defined segmentations to attain improved performance of deep learning models, which have previously been reported to be robust against undesired variation, such as inter-reader variability [Citation25]. Additionally, the number of patients who had images evaluated in the arterial phase was nearly 30 fewer than the number of patients with images evaluated in the portal phase, which may have contributed to the difference seen in model performance. The extensive datasets required for training deep learning algorithms may limit their widespread application in clinical practice [Citation34].
Deep learning models were not able to improve the prediction of PFS of a model based on SLDr and logCgA alone in the study population, consistent with findings of greater model performance using lesion-only images compared with whole-liver image inputs. Lesion shape, defined by the SLD, may therefore provide the most easily accessible signal for PFS prediction. Combined, these results confirm the pertinence of the SLDr of target lesions in defining tumor response in patients with NETs, as outlined within RECIST [Citation16]. The weak signal generated by the deep learning output, which failed to improve performance when included in the three-variable model, may be partly due to the small dataset in this study and lack of consistent annotations within this dataset.
The sensitivity and specificity of CgA reportedly ranges from 60 to 90% [Citation35]. This limited specificity of the CgA biomarker may limit its role in assessing treatment response in NETs. New biomarkers are emerging, such as the NETest, which is reportedly approximately tenfold more accurate compared with CgA for monitoring disease progression [Citation36]. Combining the deep learning output with more recently developed biomarkers that have improved specificity, such as the NETest, may increase the value of deep learning in predicting treatment response in patients with NETs. This approach has been utilized recently to achieve a sensitivity of 89% and a specificity of 91% via machine learning technology [Citation37]. TGR and response heterogeneity have also recently been identified as new markers of treatment response. In RAISE, response heterogeneity was identified and analyzed as a potential predictive biomarker, and has been reported separately [Citation38]. Future work assessing the value of deep learning in PFS prediction when combined with emerging biomarkers that do not have the usual limitations of RECIST, such as selection of target and potential heterogeneity of tumor response, may advance the application of deep learning methods into clinical practice.
The results from RAISE also produced numerous findings from a machine learning standpoint. The utility of transfer learning methods demonstrated here may improve the application of deep learning techniques in NET assessment, which was previously limited by the low availability of standardized radiological images due to the rarity of these tumors [Citation26].
ResNet50 architecture was also shown to be effective in the transfer of features from the CT scan domain, aligning with other recent studies showing the growing implementation of these deep learning techniques in imaging practices [Citation39]. Other studies investigating the value of deep learning models in predicting the grades of NETs have utilized contrast-enhanced MRI [Citation26]. Further work investigating the effectiveness of ResNet50 architecture in transferring features from the MRI domain may improve the signal of the deep learning output.
While the results presented here demonstrate that deep learning algorithms are capable of capturing information which may be relevant to the prediction of PFS, an inherent limitation of deep learning algorithms is that they are unable to explain which features their predictions are based upon [Citation40]. Future clarification of the lesion features that are valuable in determining tumor response may improve the understanding of the relationship between tumor kinetics and treatment response in patients with NETs.
It must also be noted that this analysis only included a subset of patients from the CLARINET trial, who had stable disease and substantially greater homogeneity than the general NETs population. Even in this patient subset, the radiologists participating in the RAISE project noted a relatively low quality of the data (due to inappropriate filters or slice thickness) and a high heterogeneity of contrast enhancement phases. The different types of CT scanners and different reconstruction kernels used to obtain the images may have contributed further to the heterogeneity of the data. Consistent lesion annotations may be even more difficult to obtain in the wider NETs patient population, where patients typically have disease that varies in its clinical presentation and extent of progression [Citation41]. Furthermore, median overall survival in patients with NETs reportedly varies between tumor site, grade and stage [Citation1]. Our study is limited by the lack of subgroup analyses to investigate the potential of deep learning for PFS prediction in patients with NETs of varying location, grade, and stage and by the low number of patients included in this study, which limited the approach to building the deep learning models. Further analyses to determine the potential of deep learning in a larger group of patients with NETs of varying site, grade and stage are encouraged.
Furthermore, in RAISE, no sensitivity analysis was performed to compare the prediction of PFS in the 138 included patients from CLARINET to the 66 who were not included in the RAISE analysis. Such analysis may have improved support for the reproducibility of these findings in other patient populations.
Conclusion
Overall, it was found that deep learning algorithms are capable of capturing information from lesion images which may be relevant to the prediction of PFS, while highlighting the key requirement of extensive annotations for training deep learning models. The significantly reduced dataset and absence of consistent annotations may have contributed to the lack of improved performance of deep learning models, compared with models based on SLDr and logCgA alone, which also confirms the pertinence of SLDr in defining tumor response in patients with NETs. Further work assessing the predictive power of different deep learning models in a larger dataset and in different subgroups of patients, possibly utilizing the ResNet50 architecture and transfer learning approaches which showed promise in this study, is needed. These approaches may optimize the performance of deep learning models in the prediction of treatment response in patients with NETs.
Response Evaluation Criteria in Solid Tumors (RECIST) uses the sum of the longest diameter (SLD) of lesions to estimate the change in tumor burden in patients over a course of treatment and represents an established method to assess tumor response to systemic therapies in neuroendocrine tumors (NET).
However, in patients with NETs, tumor response to therapy is often reflected by disease stabilization rather than significant tumor shrinkage; therefore, classifying a successful treatment response in terms of tumor shrinkage using RECIST may be an oversimplification.
An earlier indication of treatment benefit than is provided by RECIST would aid assessment of therapies and may improve outcomes for patients with NETs.
The value of deep learning models in improving the accuracy of tumor grading in NETs has been demonstrated, but their potential in the prediction of treatment response in patients with NETs is yet to be explored.
The RAISE project aimed to leverage the potential of machine learning to create a multimodal surrogate end point for RECIST based on biochemical data and imaging biomarkers, to allow earlier prediction of treatment efficacy and progression-free survival (PFS).
In this study, deep learning models extracted features from 1690 CT scans from patients from the CLARINET phase III trial (NCT00353496) with liver lesions and scans for multiple visits over 72 weeks (n = 138/204).
This study found that deep learning models can be trained to capture and model information from CT images, complementary to lesion shape and size, that is relevant to the prediction of PFS. This finding was shown by the improved performance of a lesion mask model (c-index: 0.70) compared with a binary mask model (c-index: 0.58) at week 72.
However, no differences were found in the performance of a model combining the deep learning model output with the SLD ratio (SLDr) and change from baseline in logarithmically transformed CgA concentration (logCgA), as compared with a model based on SLDr and logCgA alone.
Overall, it was found that deep learning algorithms are capable of capturing information from lesion images which may be relevant to the prediction of PFS, while highlighting the key requirement of extensive annotations for training these models.
Author contributions
Substantial contributions to study conception and design: M Pavel, C Dromain, M Ronot, N Schaefer, D Mandair, D Gueguen, D Elvira, S Jégou, F Balazard, O Dehaene & K Schutte; substantial contributions to analysis and interpretation of the data: M Pavel, C Dromain, M Ronot, N Schaefer, D Mandair, D Gueguen, D Elvira, S Jégou, F Balazard, O Dehaene & K Schutte; drafting the article or revising it critically for important intellectual content: M Pavel, C Dromain, M Ronot, N Schaefer, D Mandair, D Gueguen, D Elvira, S Jégou, F Balazard, O Dehaene & K Schutte; final approval of the version of the article to be published: M Pavel, C Dromain, M Ronot, N Schaefer, D Mandair, D Gueguen, D Elvira, S Jégou, F Balazard, O Dehaene & K Schutte.
Financial & competing interests disclosure
This study was sponsored by Ipsen. The collaboration between Ipsen and Owkin was funded by Ipsen. M Pavel: participated in advisory boards for, and received honoraria from AAA, Amgen, Boehringer Ingelheim, Eli Lilly, Ipsen, Lexicon, Novartis, Pfizer, Riemser; C Dromain: received consultancy fees and honoraria from Ipsen; M Ronot: received honoraria from Alexion Pharmaceuticals, Canon-Toshiba, GE Healthcare, Guerbet, Ipsen, Servier, Sirtex; N Schaefer, D Mandair: none to declare; D Gueguen: Former employee of Ipsen; D Elvira: employee of Ipsen; S Jégou, O Dehaene: former employees of Owkin; F Balazard & K Schutte: employees of Owkin. The authors have no other relevant affiliations or financial involvement with any organization or entity with a financial interest in or financial conflict with the subject matter or materials discussed in the manuscript apart from those disclosed.
The authors thank Izzy Hawkes of Costello Medical, UK, for medical writing support and editorial assistance, which was sponsored by Ipsen in accordance with Good Publication Practice guidelines.
Ethical conduct of research
Data are from the CLARINET study. The CLARINET study was approved by all relevant local ethical committees. Consent was obtained from each patient after full explanation of the purpose and nature of all procedures used.
Data sharing statement
The authors certify that this manuscript reports the secondary analysis of clinical trial data that have been shared with them, and that the use of this shared data is in accordance with the terms (if any) agreed upon their receipt. The source of this data is: CLARINET phase III trial (NCT00353496)
Qualified researchers may request access to patient-level study data that underlie the results reported in this publication. Additional relevant study documents, including the clinical study report, study protocol with any amendments, annotated case report form, statistical analysis plan and dataset specifications may also be made available. Patient level data will be anonymized, and study documents will be redacted to protect the privacy of study participants.
Where applicable, data from eligible studies are available 6 months after the studied medicine and indication have been approved in the US and EU or after the primary manuscript describing the results has been accepted for publication, whichever is later.
Further details on Ipsen’s sharing criteria, eligible studies and process for sharing are available here (https://vivli.org/members/ourmembers/).
Any requests should be submitted to www.vivli.org for assessment by an independent scientific review board.
Restrictions apply to the availability of these data since the data underlying this publication were provided by Owkin under contract to Ipsen.
Acknowledgements
The authors thank all patients involved in the study, as well as their caregivers, care team, investigators, and research staff in participating institutions. The authors also thank Julie Benzimra, Thibaut Emorine, Lise Minssen, and Ilan Obadia for the annotation of images in the study.
Additional information
Funding
References
- Dasari A , ShenC, HalperinDet al. Trends in the Incidence, Prevalence, and Survival Outcomes in Patients With Neuroendocrine Tumors in the United States. JAMA Oncol.3(10), 1335–1342 (2017).
- Turaga KK , KvolsLK. Recent progress in the understanding, diagnosis, and treatment of gastroenteropancreatic neuroendocrine tumors. CA Cancer J. Clin.61(2), 113–132 (2011).
- Díez M , TeuléA, SalazarR. Gastroenteropancreatic neuroendocrine tumors: diagnosis and treatment. Ann Gastroenterol26(1), 29–36 (2013).
- Cives M , StrosbergJ. Treatment Strategies for Metastatic Neuroendocrine Tumors of the Gastrointestinal Tract. Curr Treat Options Oncol18(3), 14 (2017).
- Foltyn W , ZajęckiW, MarekBet al. The value of the Ki-67 proliferation marker as a prognostic factor in gastroenteropancreatic neuroendocrine tumours. Endokrynol Pol63(5), 362–366 (2012).
- Yamaguchi T , FujimoriT, TomitaSet al. Clinical validation of the gastrointestinal NET grading system: Ki67 index criteria of the WHO 2010 classification is appropriate to predict metastasis or recurrence. Diagn Pathol8, 65 (2013).
- Nadler A , CukierM, RowsellCet al. Ki-67 is a reliable pathological grading marker for neuroendocrine tumors. Virchows Arch462(5), 501–505 (2013).
- Govind D , JenKY, MatsukumaKet al. Improving the accuracy of gastrointestinal neuroendocrine tumor grading with deep learning. Sci Rep10(1), 11064 (2020).
- Singh S , HalletJ, RowsellC, LawCH. Variability of Ki67 labeling index in multiple neuroendocrine tumors specimens over the course of the disease. Eur. J. Surg. Oncol.40(11), 1517–1522 (2014).
- Grillo F , AlbertelliM, BrisigottiMPet al. Grade Increases in Gastroenteropancreatic Neuroendocrine Tumor Metastases Compared to the Primary Tumor. Neuroendocrinology103(5), 452–459 (2016).
- Yao JC , PavelM, PhanATet al. Chromogranin A and Neuron-Specific Enolase as Prognostic Markers in Patients with Advanced pNET Treated with Everolimus. J Clin Endocrinol Metab96(12), 3741–3749 (2011).
- Mirakhur B , PavelME, PommierRFet al. Biochemical Responses in Symptomatic and Asymptomatic Patients with Neuroendocrine Tumors: Pooled Analysis of 2 Phase 3 Trials. Endocr Pract24(11), 948–962 (2018).
- Gut P , CzarnywojtekA, FischbachJet al. Chromogranin A - unspecific neuroendocrine marker. Clinical utility and potential diagnostic pitfalls. Arch Med Sci12(1), 1–9 (2016).
- Hofland J , KaltsasG, DeHerder WW. Advances in the Diagnosis and Management of Well-Differentiated Neuroendocrine Neoplasms. Endocr. Rev.41(2), 371–403 (2020).
- Granata V , FuscoR, SetolaSVet al. The multidisciplinary team for gastroenteropancreatic neuroendocrine tumours: the radiologist’s challenge. Radiol Oncol53(4), 373–387 (2019).
- Therasse P , ArbuckSG, EisenhauerEAet al. New guidelines to evaluate the response to treatment in solid tumors. European Organization for Research and Treatment of Cancer, National Cancer Institute of the United States, National Cancer Institute of Canada. J. Natl Cancer Inst.92(3), 205–216 (2000).
- Eisenhauer EA , TherasseP, BogaertsJet al. New response evaluation criteria in solid tumours: revised RECIST guideline (version 1.1). Eur J Cancer45(2), 228–247 (2009).
- Cervera Deval J . [RECIST and the radiologist]. Radiologia56(3), 193–205 (2014).
- De Mestier L , DromainC, D’assigniesGet al. Evaluating digestive neuroendocrine tumor progression and therapeutic responses in the era of targeted therapies: state of the art. Endocr Relat Cancer21(3), R105–120 (2014).
- Dromain C , PavelME, RuszniewskiPet al. Tumor growth rate as a metric of progression, response, and prognosis in pancreatic and intestinal neuroendocrine tumors. BMC Cancer19(1), 66 (2019).
- Caplin ME , PavelM, ĆwikłaJBet al. Lanreotide in metastatic enteropancreatic neuroendocrine tumors. N Engl J Med371(3), 224–233 (2014).
- Canellas R , BurkKS, ParakhA, SahaniDV. Prediction of Pancreatic Neuroendocrine Tumor Grade Based on CT Features and Texture Analysis. AJR Am. J. Roentgenol.210(2), 341–346 (2018).
- Gatta R , DepeursingeA, RatibO, MichielinO, LeimgruberA. Integrating radiomics into holomics for personalised oncology: from algorithms to bedside. Eur Radiol Exp4(1), 11 (2020).
- Parekh VS , JacobsMA. Deep learning and radiomics in precision medicine. Expert Rev Precis Med Drug Dev4(2), 59–72 (2019).
- Hosny A , ParmarC, QuackenbushJ, SchwartzLH, AertsH. Artificial intelligence in radiology. Nat Rev Cancer18(8), 500–510 (2018).
- Gao X , WangX. Deep learning for World Health Organization grades of pancreatic neuroendocrine tumors on contrast-enhanced magnetic resonance images: a preliminary study. Int J Comput Assist Radiol Surg14(11), 1981–1991 (2019).
- Niazi MKK , TavolaraTE, AroleV, HartmanDJ, PantanowitzL, GurcanMN. Identifying tumor in pancreatic neuroendocrine neoplasms from Ki67 images using transfer learning. PLOS One13(4), e0195621 (2018).
- Luo Y , ChenX, ChenJet al. Preoperative Prediction of Pancreatic Neuroendocrine Neoplasms Grading Based on Enhanced Computed Tomography Imaging: Validation of Deep Learning with a Convolutional Neural Network. Neuroendocrinology110(5), 338–350 (2020).
- Riihimäki M , HemminkiA, SundquistK, SundquistJ, HemminkiK. The epidemiology of metastases in neuroendocrine tumors. Int. J. Cancer139(12), 2679–2686 (2016).
- Fei-Fei L , DengJ, LiK. ImageNet: constructing a large-scale image database. J Vis9(8), 1037 (2009).
- Deng J , DongW, SocherR, LiL-J, LiK, Fei-FeiL. Imagenet: a large-scale hierarchical image database. Presented at: 2009 IEEE Conference on Computer Vision and Pattern Recognition.Miami, FL, USA, 20–25 June 2009.
- Abdi H , WilliamsLJ. Principal component analysis. Wiley Interdisciplinary Reviews: Computational Statistics2(4), 433–459 (2010).
- Xu QS , LiangYZ, DuYP. Monte Carlo cross-validation for selecting a model and estimating the prediction error in multivariate calibration. J Chemom18(2), 112–120 (2004).
- Lee J-G , JunS, ChoY-Wet al. Deep Learning in Medical Imaging: General Overview. Korean J Radiol18(4), 570 (2017).
- Oberg K , CouvelardA, DelleFave Get al. ENETS Consensus Guidelines for Standard of Care in Neuroendocrine Tumours: Biochemical Markers. Neuroendocrinology105(3), 201–211 (2017).
- Modlin IM , KiddM, MalczewskaAet al. The NETest: The Clinical Utility of Multigene Blood Analysis in the Diagnosis and Management of Neuroendocrine Tumors. Endocrinol. Metab. Clin. North Am.47(3), 485–504 (2018).
- Kjellman M , KniggeU, WelinSet al. A Plasma Protein Biomarker Strategy for Detection of Small Intestinal Neuroendocrine Tumors. Neuroendocrinology111(9), 840–849 (2021).
- Dromain C , PavelM, RonotMet al. Response heterogeneity as a new biomarker of treatment response in patients with neuroendocrine tumors. Future Oncology (2023).
- Gifani P , ShalbafA, VafaeezadehM. Automated detection of COVID-19 using ensemble of transfer learning with deep convolutional neural network based on CT scans. Int J Comput Assist Radiol Surg16(1), 115–123 (2021).
- Gorris M , HoogenboomSA, WallaceMB, Van HooftJE. Artificial intelligence for the management of pancreatic diseases. Dig Endosc33(2), 231–241 (2021).
- Kunz PL , Reidy-LagunesD, AnthonyLBet al. Consensus Guidelines for the Management and Treatment of Neuroendocrine Tumors. Pancreas42(4), 557–577 (2013).