
Abstract
Rap proteins regulate liver physiopathology. For example, Rap2B promotes hepatocarcinoma (HCC) growth, while Rap1 might play a dual role. The RapGEF, Epac1, activates Rap upon cAMP binding, regulating metabolism, survival, and liver regeneration. A liver specific Epac2 isoform lacking cAMP-binding domain also activates Rap1, promoting fibrosis in alcoholic liver disease. C3G (RapGEF1) is also present in the liver, but mainly as shorter isoforms. Its function in the liver remains unknown. Information from different public genetic databases revealed that C3G mRNA levels increase in HCC, although they decrease in metastatic stages. In addition, several mutations in RapGEF1 gene are present, associated with a reduced patient survival. Based on this, C3G might represent a new HCC diagnostic and prognostic marker, and a therapeutic target.
Keywords::
Rap & C3G
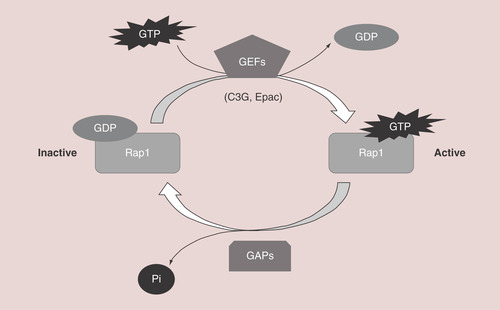
Rap is a member of the Ras family of small GTPases, with five different isoforms: Rap1A, Rap1B, Rap2A, Rap2B and Rap2C expressed in mammalian cells [Citation1]. Rap proteins play a relevant role in cell adhesion [Citation2,Citation3], junction formation [Citation4–6], migration, invasion [Citation7], cell polarity [Citation8,Citation9], exocytosis [Citation10], apoptosis [Citation11] and proliferation [Citation12]. As a consequence, they are important for carcinogenesis [Citation13,Citation14] and cardiovascular function [Citation15]. Rap switches from an inactive conformation, bound to GDP, to an active conformation, bound to GTP. This activation is regulated by different GEFs that mediate the dissociation of GDP from Rap, favoring the binding of GTP, which is much more abundant than GDP within the cell. On the other hand, GAPs activate Rap GTPase activity, promoting GTP hydrolysis leading to the inactive, GDP-bound, form [Citation1]. Therefore, the activation and inactivation of Rap proteins by specific GEFs and GAPs regulates the duration of Rap activation and its localization ().
Rap switches from an inactive form, bound to GDP, to an active conformation, bound to GTP. GEFs, such as C3G or Epac, mediate GDP dissociation, favoring GTP binding to Rap. To inactivate it, GAPs activate Rap intrinsic GTPase activity, promoting GTP hydrolysis.
The main GEF for Rap1 is C3G, also known as RapGEF1 [Citation2]. C3G is a 140kDa protein, although several other isoforms, generated by alternative splicing, has been described in human and other species [Citation16]. In particular, a truncated isoform, called p87C3G, that lacks the first 305 amino acids from the N-terminus, has been associated with myeloid leukemia [Citation17]. C3G structure is composed by three well differentiated modules. A GEF-catalytic unit at the C-terminal region that includes the Ras exchange motif domain and a Cdc25 homologous domain [Citation16]. A central proline rich (or SH3-binding) domain that interacts with SH3 domains from other proteins, such as Crk, p130Cas, Grb2, c-Abl or Hck, and harbors a tyrosine residue (Tyr504) susceptible of being phosphorylated by different kinases, leading to C3G activation [Citation18]. Finally, an N-terminal region with an E-cadherin binding domain, which negatively regulates the GEF activity (B) [Citation6,Citation19]. C3G is ubiquitously expressed, although there are some tissue-specific differences. In humans, C3G levels are higher in adult skeletal muscle, brain, heart, kidney, lung and liver, as well as in placenta, fetal heart, and brain [Citation20,Citation21]. C3G is essential for embryonic development [Citation2], due to its role in integrin-mediated adhesion [Citation5,Citation22–24] and migration [Citation25]. It regulates several cellular functions such as cytoskeleton remodeling [Citation16], vesicle traffic [Citation26], differentiation [Citation27], death [Citation28–31], proliferation [Citation29,Citation32], and platelet clotting [Citation33]. However, the role of C3G in cancer remains uncertain as it can act either as a tumor suppressor or promoter [Citation16,17,Citation34,35]. C3G inhibits migration of highly invasive breast carcinoma cells [Citation36] and its expression is reduced in cervical squamous cell carcinoma [Citation37]. In HCT116 colon carcinoma cells, C3G knockdown promotes migration and invasion through Rap1-mediated p38α hyperactivation, while it favors in vitro and in vivo tumor growth [Citation7]. C3G expression increases in human non-small-cell lung cancer [Citation38] and in the papillary thyroid carcinoma, C3G is also implicated [Citation39]. In addition, transgenic expression of C3G in platelets promotes tumor angiogenesis and metastasis [Citation40]. Finally, chronic myeloid leukemia is associated with a high expression of the p87C3G isoform [Citation17].
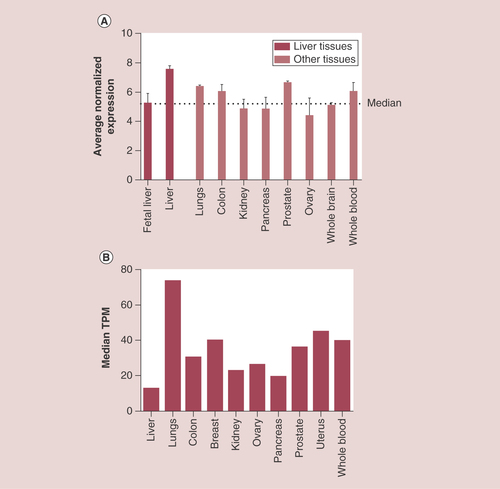
(A) Histogram showing RapGEF1 mRNA expression in fetal liver, adult liver, lung, colon, kidney, pancreas, prostate, ovary, whole brain and whole blood, expressed as the average normalized expression. The dotted line marks the median. These data were extracted from BioGPS platform using GeneAtlas U133A datasets composed of 176 samples of different human tissues. (B) Histogram showing RapGEF1 mRNA expression in liver, lung, colon, breast, kidney, ovary, pancreas, prostate, uterus and whole blood, expressed as the median TPM. These data were extracted from GTExportal (GTEx Analysis Release V6P), with a dataset composed of 175 liver samples.
TPM:Transcript per kilobase million.
Another Rap-GEF family is Epac, consisting of three members: Epac1 (cAMP-GEFI or RapGEF3), Epac2 (cAMP-GEFII or RapGEF4) and Repac (Related to Epac, also known as RapGEF5). Like C3G, Epac proteins have its GEF-catalytic domain in the C-terminus, although its structure differs by the presence of a cyclic nucleotide-binding domain, a docking site for cAMP, in the N-terminal region, which is necessary for its allosteric regulation [Citation1]. Epac family members play relevant functions related to cell adhesion and junction formation [Citation41] such as in the vascular endothelial barrier [Citation42–44] or for neuronal polarization [Citation45].
The liver & the hepatocarcinogenesis
The liver is the organ in charge of important physiological functions such as the homeostasis of energetic metabolism (controlling the synthesis and distribution of nutrients), detoxification of metabolites and other substances. In addition, it acts as an endocrine and paracrine gland. Hence, the importance of its proper functioning.
In response to damage, including partial hepatectomy, the liver has the property to regenerate. Initially, hepatocytes restore liver mass. However, during more extensive and severe liver damage, bipotential progenitor cells (hepatoblasts) are activated and expanded from the portal area through the liver parenchyma and contribute to regenerate the liver leading to hepatocytes and cholangiocytes. Hepatoblasts are the stem cells of the liver that retain the ability to self-renew and proliferate to provide hepatic progenitor cells. Malignant transformation of hepatoblasts could generate liver cancer stem cells (CSCs). Liver cancer is the sixth most common malignancy (the fifth in men and the ninth in women), the second in mortality, and its prognosis is very poor [Citation46] according to the International Agency for Research on Cancer from the WHO. Hepatocellular carcinoma (HCC) is the major pathological type accounting for around 80% of liver cancers. Emerging evidence indicate that CSCs, also termed tumor-initiating cells, are present in solid tumors, including HCC [Citation47] and are responsible for cancer relapse, metastasis, and chemoresistance, although the origin of liver CSCs remains controversial. One possible origin is the transformation of liver stem/progenitor cells [Citation46]. However, they can also derive from transformed hepatocytes. In fact, transformed murine hepatoblasts, hepatic progenitor cells and adult hepatocytes can all acquire stem cell properties and can be converted into CSCs after genetic/epigenetic alterations [Citation48]. Thus, the etiology of HCC remains to be fully characterized, as well as the understanding of which signaling pathways and mechanisms are implicated. This is a complex issue as HCC involves multiple genetic aberrations [Citation49]. In a normal liver, environmental factors as hepatitis virus B or C infection or alcoholism, as well as autoimmune disorders can initiate a process of chronic inflammation and angiogenesis, which can lead to liver fibrosis. When inflammation and fibrosis persists, a liver loss of function is produced, resulting in cirrhosis, which can further progress to the irreversible development of HCC. Nowadays, there are few therapies available to treat HCC, which includes liver resection or transplantation, sorafenib treatment or local-regional therapies such as chemoembolization or radiofrequency ablation [Citation50]. The limited knowledge of molecular pathogenesis and treatment of HCC supports the great effort made by the researchers to create liver cancer models in rodents [Citation51]. Moreover, thanks to the bioinformatic tools and gene array studies that allow a large scale analysis of a big number of samples and targets, we are now closer to uncovering the molecular biomarkers of HCC generation and progression [Citation52].
In this brief review we will first explore the literature in search for information about Rap family members and its GEFs in liver physiology and pathology such as hepatocarcinoma (HCC). Then, we will use different databases in order to compare C3G mRNA levels and mutations in HCC. Finally, we will discuss these data and get conclusions, proposing some future research perspectives.
Results
Role of Rap family members & its GEFs in liver physiology
Data available in the literature point out to some members of the Rap small GTPase family and its GEFs as important players in liver physiology through regulation of metabolism, proliferation, survival, and other cellular processes. A liver specific Epac2 (cAMP-GEFII) isoform of 79kDa, lacking the first cAMP-binding domain, has been detected in mouse liver lysates, which is different from the 110kDa isoform, present in the brain [Citation53]. The presence of a shorter Epac2 mRNA of 3.5kb was confirmed both in human and mouse liver tissue by northern blot. This liver specific Epac2 isoform presents GEF activity toward Rap1 and may have a distinctive role in liver [Citation53]. In addition, another RapGEF, C3G, is expressed in E16.5 mouse embryonic liver. Although the C3G full-length isoform showed a major enrichment in the brain as compared with liver [Citation54], other shorter isoforms are present in the liver. Specifically, data from both RNAseq and protein analysis uncovered a great representation of C3G variants in embryonic liver as compared with brain. These liver isoforms harbor the C-terminal GEF catalytic domain, but lack the N-terminal E-cadherin binding region. This suggests that C3G differences in RNA processing would confer different tissue-specific functional capabilities. For example, in embryonic liver C3G could be important for the regulation of Rap1 signaling and the recruitment of CrkL or other SH3 binding proteins, whereas in embryonic brain it could be more implicated in E-cadherin binding and focal adhesion localization [Citation54].
In fasted mouse primary hepatocytes, glucagon-dependent cAMP generation induces Epac-mediated Rap1 activation, which leads to the induction of SOCS3. SOCS3 negatively regulates the JAK/STAT cascade and other signal transduction pathways such as PKA [Citation55], preventing CREB phosphorylation in the nucleus. Therefore, it acts as an inhibitory feedback loop for the cAMP/PKA/CREB pathway, which induces the transcription of gluconeogenic genes. Therefore, the cAMP/Epac/Rap1/SOCS3 pathway would be a mechanism to prevent hyperglycemia in fasted mice through inhibition of gluconeogenesis [Citation56].
In primary rat hepatocytes, the activation of the cAMP/Epac/Rap1/PI3K/Akt pathway confers a survival effect against Fas/bile acid-induced apoptosis. On the other hand, the cAMP/Epac/Rap1 cascade protects from TNF-α induced apoptosis through a PI3K independent pathway [Citation57]. In addition, in rats Epac/Rap activation leads to hepatocyte cytoprotection through two pathways: cAMP/Epac/Rap1–2/Src/EGFR/PI3Kα/Akt pathway and a cAMP/Epac/Rap1–2/Src/PI3Kβ/Akt pathway [Citation58]. Ulterior studies showed us that the cAMP/Epac/Rap1/PI3K/Akt/GSKβ pathway also protects rat hepatocytes and human Huh7-NTPC cells against bile acid-induced apoptosis [Citation59]. Therefore, cAMP/Epac/Rap constitute an important pro-survival signaling pathway in the liver, and its further characterization could lead to the identification of potential novel therapeutic targets to slow down the progression of chronic hepatopathies [Citation58]. These findings indicate that the Epac/Rap cascade plays a relevant role in liver physiology, although it remains to be better characterized. Thus, deeper functional and mechanistic studies are required to further understand the distinctive role played by this pathway in liver.
Relevance of Rap proteins & its GEFs in liver pathologies & HCC
The nature of rap genes as oncogenes or tumor suppressors is controversial, with different groups finding paradoxical results, which may be dependent on the cellular context. In human Hep3B cells, Rap1 expression reduces saturation density at confluence. Moreover, in nude mice xenograft assays, Rap1 suppresses their intrinsic tumorigenic capacity [Citation59]. Rap1 also acts as a suppressor of tumorigenesis by inhibiting TPA-(phorbol ester) or insulin-induced Ras/Raf/MEK/ERK activation and cell proliferation in Hep3B cells [Citation60]. In contrast, experiments developed in other human liver cancer cell lines (HepG2, HepG2.2.15 and SMMC-7721) support the involvement of Rap1 in hepatitis B virus (HBV)-related HCC pathogenesis. In particular, HBV increases Rap1b expression through the inhibition of miR-101-3p, which leads to an enhanced growth and migration of HCC cells. miR-101-3p is known to be downregulated in HCC, impairing its proapoptotic and antitumorigenic activities [Citation61]. Thus, miR-101-3p would be a potential therapeutic target in HBV-related HCC [Citation62].
On the other hand, Rap2B is upregulated in HCC samples and in some human HCC lines such as HepG2, MHCC97H and HCCLM3, favoring cell proliferation, migration and invasion through mechanisms involving FAK activation and increased levels of matrix metalloproteases MMP2 and MMP9. Accordingly, in vivo xenograft assays in nude mice using HepG2 cells showed a reduced tumor growth and weight upon Rap2B silencing. This indicates that Rap2B acts as an oncogene promoting the development and progression of HCC and it could be a potential therapeutic target for the treatment of HCC [Citation63].
Rap1 also plays a role during liver regeneration. The compensatory hyperplasia of rat liver following two-thirds partial hepatectomy is a well-known paradigm of coordinated DNA synthesis. During the regenerative growth response, the levels of rap1A mRNA and Rap1A protein in liver membranes decreased at 24 h, which corresponds to the peak of DNA synthesis. This effect is reverted after 48 h, which indicates thatrap1A transcription and/or transcript stability is cell-cycle regulated. Moreover, rap1A expression would be inversely correlated with DNA synthesis, as well as with ras and raf expression [Citation64]. More recently, a study dissected the proliferative response during liver regeneration in the different liver cell types in adult rats. At the priming stage (2–6 h after partial hepatectomy), two proliferative promoting pathways, initiated with the engagement of G protein-coupled receptor, (GPCR)/Gsα/AC/cAMP/Epac/Rap1/Raf/MEK/ERK and GPCR/Gsα/AC/cAMP/PKA/Rap1/Raf/MEK/ERK were activated in hepatic stellate cells (HSCs). During the progression phase of liver regeneration (6–72 h after partial hepatectomy), GPCR/Gsα/Epac/Rap1/Raf/MEK/ERK cascade activation increased, being implicated in biliary epithelial cell proliferation [Citation65]. In the late phase of liver regeneration, (120 h after hepatectomy), in hepatocytes, the Gαs/AC/Epac/Rap1 pathway was less active, which reduces the expression of genes involved in hepatocyte proliferation by decreasing ERK1/2 activity [Citation66].
Epac may be also involved in the regulation of liver fibrosis. Thus, pentoxifylline (an Epac activator) has shown in vitro hepatic antifibrotic actions by increasing cAMP levels in HSCs [Citation67]. In agreement with this, TGF-β1, a profibrotic signal, decreases Epac1 mRNA levels in mouse and human HSCs [Citation68]. Taking all this into account, potential liver antifibrotic therapies could be focused on increasing cAMP levels or Epac expression and/or its activation [Citation69].
Epac and Rap also play a role in alcoholic liver disease, which is one of the most common etiologies involved in the generation of liver disorders, including alcoholic hepatitis, fibrosis, cirrhosis and HCC. HSCs are activated by acetaldehyde, the main metabolite of ethanol [Citation70], inducing a change from quiescent vitamin A-storing cells to proliferating activated myofibroblast-like cells that stimulate the deposition of extracellular matrix [Citation71]. In a rat model of alcoholic liver fibrosis, where acetaldehyde activated HSCs, an increase in the levels of Epac2 and GTP-bound Rap1 and a decrease of Epac1 was produced [Citation72]. It was proven that Epac1/Rap1 had a protective effect by suppressing the activation and proliferation of HSCs, while Epac2/Rap1 promoted a profibrotic response. These results support the potential use of an Epac-based therapy for alcohol-induced liver fibrosis.
Changes in C3G expression & genetic alterations in human HCC
There is no information in the literature supporting a role for C3G in liver cancer. However, based on genomic and mRNA data from public access databases, we can hypothesize that C3G might play a relevant function in this pathology. Here we will briefly describe and discuss some interesting findings on the subject.
When searching for information about RapGEF1 (C3G), the first problem is the great number of databases available with different results. This might be in part due to a limited number of samples, which does not allow reliable conclusions to be established.
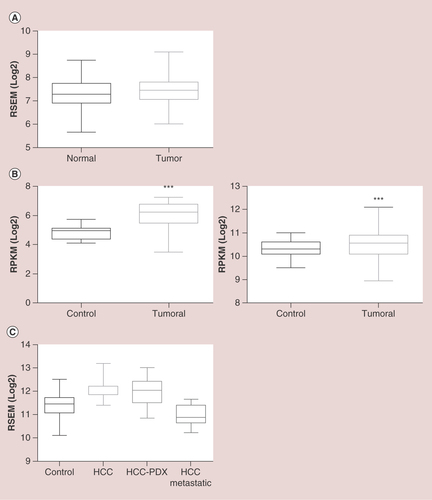
The BioGPS platform uses GeneAtlas U133A datasets, composed of 176 samples from different human tissues, to generate a graphic showing the tissue-specific pattern of mRNA expression [Citation73]. In A, we observe that the average normalized expression of C3G mRNA in the liver is 7.5 (relative units), which is above the median value, as compared with other representative organs and tissues such as the lungs, colon, kidney, pancreas, prostate, ovary, whole brain, or whole blood. In contrast, C3G mRNA levels are lower in fetal than in adult liver, which could be indicative of the functional differences between fetal and adult liver. On the other hand, data from GTExportal (GTEx Analysis Release V6P) [Citation74] indicate that RapGEF1 gene expression in liver appears to be lower than in other tissue samples coming from lungs, colon, breast, kidney, ovary, prostate, uterus or whole blood. Thus, the 175 liver samples have a median transcript per kilobase million (TPM) value of 12.96, while the value for the rest of the tissues was higher (B). The most closed TPM (19.62) was that of the pancreas, but it is still higher than that of the liver. Although this database allows to apply a sex filter, no significant difference between female and male liver samples can be detected, the median TPM being 13.21 for females and 12.76 for males. In contrast, when comparing normal versus tumorous liver samples from different databases, it seems to be a consensus in the C3G mRNA expression results. The overall data indicate that C3G mRNA expression is slightly higher in tumoral liver tissue as compared with normal liver samples, although the fold change between these two conditions depends on the database, owing to the different origins and number of samples, among others factors. In A, data from GENT (Gene Expression across Normal and Tumoral Tissue) platform [Citation75], derived from the analysis of 50 normal liver samples and 194 liver tumor samples using the Affymetrix GeneChip Human Genome U133 Plus 2.0 Array, indicate that C3G mRNA expression slightly increases in liver tumor samples as compared with normal liver tissue. Using the Firebrowse platform, which uses many datasets from TCGA (The Cancer Genome Atlas) to create differential plots of gene expression from normal and tumor samples from the overall human anatomy, a similar tendency was found [Citation76]. As shown in B, left graph, a 2.42-fold increase in C3G mRNA levels is observed in HCC tumor samples as compared with control liver samples using a Firebrowse analysis. To do it, a dataset of nine control liver samples and 17 HCC tumor samples is used and the results are expressed in RPKM (log2; Reads Per Kilobase per Million). In contrast, as shown in B, right graph, when the same platform uses a dataset of 50 control liver samples and 373 HCC tumor samples and the results are expressed in RSEM(log2) (accurate transcript quantification for RNA-Seq data) [Citation77], the increase in C3G mRNA levels in HCC tumor samples versus control liver samples is quite limited (with a fold change of 1.18). On the other hand, the Gene Investigator Software [Citation78], which uses the gene expression information from multiple samples datasets derived from Affymetrix Human Genome U133 Plus 2.0 Array analyses, give different results. As we can see in C, using this software to compare control liver samples versus different sets of HCC samples derived directly from patients or from patient-derived xenografts (HCC-PDX), higher C3G mRNA levels are found in HCC samples. In contrast, HCC samples classified as metastatic express considerably lower levels of C3G mRNA as compared with both normal liver and HCC samples. This suggests that low levels of C3G mRNA in liver might favor migration and invasion of HCC cells, promoting metastasis to secondary organs.
(A) Boxplot showing RapGEF1 mRNA expression in normal and tumoral liver tissue, expressed as log2 of RSEM (accurate transcript quantification for RNA-Seq data). These data were extracted from GENT platform, derived from the analysis of 50 normal liver samples and 194 liver tumor samples using the Affymetrix GeneChip Human Genome U133 Plus 2.0 Array. (B) Boxplots showing RapGEF1 expression in normal and tumoral liver tissues, expressed as log2 RSEM (right panel) or log2 RPKM (left panel). These data come from Firebrowse platform, using TCGA datasets, with 50 control liver samples and 373 hepatocellular carcinoma (HCC) tumor samples (right panel) or nine control liver samples and 17 HCC tumor samples (left panel). A t-test statistical analysis using Graphpad 6.01 software revealed a significant difference between tumor samples and controls (***p<0.0001; left panel). (C) Boxplot showing RapGEF1 mRNA expression in control (normal) liver, HCC, HCC-PDX and HCC metastatic samples, expressed as log2 RSEM. These data were obtained from Gene Investigator software using Affymetrix Human Genome U133 Plus 2.0 Array analysis, with a dataset of 535 control liver samples, 232 HCC samples, 30 HCC-PDX samples and 15 HCC-metastatic samples.
GENT:Gene expression across normal and tumoral tissue;PDX:Patient-derived xenograft; RPKM:Reads per kilobase per million; RSEM:Accurate transcript quantification from RNA-Seq data with or without a reference genome.
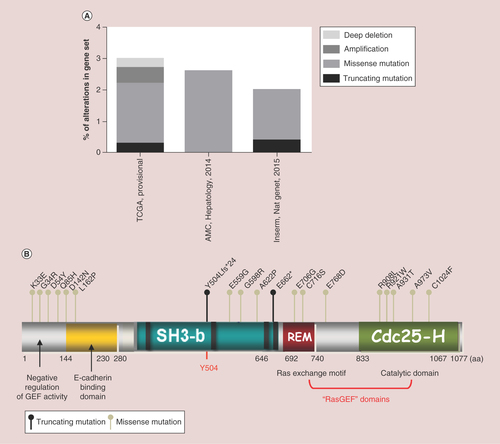
We also looked for somatic mutations and other genetic alteration data. In the cBioportal database [Citation79], three gene sets of HCC samples are available (A). The TCGA set comprises 366cases, where 3% present alterations in the RapGEF1 gene (11cases), either mutations, amplifications, or deep deletions. The AMC (Asian Medical Centre, Seoul, South Korea; Hepatology, 2014) set is composed by 231cases, where 2.6% present missense mutations (six cases) in RapGEF1 gene. Finally, the Inserm (Nat. Genet., 2015) set comprises 243cases with2.1% of them presenting either nonsense (truncating) or missense mutations in RapGEF1. The localization of specific mutated amino acids in the RapGEF1 protein is shown in B. We can observe a high concentration of known missense mutations in the N-terminal region, which negatively regulates the GEF catalytic activity of C3G. Thus, we could hypothesize that loss of function mutations within this region could lead to a sustained GEF activity and a subsequent hyperactivation of the Rap1 pathway and/or other Ras GTPases. However, the greatest number of potential missense mutations is found in the catalytic domain, located at the C-terminal region. Presumably, a missense mutation in this catalytic domain might alter the GEF activity, which would lead to a deregulation of Rap1 pathway. Furthermore, there are two important nonsense (truncating) mutations located in relevant positions. The first affects residue Y504, whose phosphorylation is involved in C3G activation and localization. As a consequence, this mutation could interfere with its activation. The second one occurs in some amino acids upstream from the Ras exchange motif domain, and could lead to a loss of its catalytic activity.
Data from cBioportal database, using three gene sets:TCGA with 366cases, the AMC (Hepatology, 2014) with 321cases and Inserm (Nat. Gent., 2015) with 243cases. (A) Piled histogram showing RapGEF1 deep deletion, amplification, missense mutation, or truncating mutation, expressed as the percentage of alterations in the gene set. (B) Schematic representation of C3G domains, from N- to C-terminal:negative regulatory domain of GEF activity, E-cadherin binding domain, SH3-binding domain (rich in prolines), Y504 (site of phosphorylation) and GEF catalytic domain composed of REM and Cdc25-Homologous Ras GEF domain. Dots above C3G scheme represent nonsense mutations (dark dot) or missense mutations (grey dot) with annotations at the site of the involved aa. aa limiting each domain are displayed.
aa:Amino acid;AMC:Asian Medical Centre;fs:Frame shift insertion;REM:Ras exchange motif.
Because phenotypic alterations and diseases are not only associated with gene mutations, but also to copy number variations, we also looked for it at the OASIS Analytics platform that compiles results from other databases [Citation80]. In a first liver cancer dataset (Pfizer, ACRG [Asian Cancer Research Group; Singapore]), we observed a 0.5% copy number gain (one donor affected out of 217 donors) and 0.9% copy number loss (two donors affected out of 217 donors). In a second liver HCC data set (TCGA, MD, USA), no donors with copy number gain (from a total of 212 donors) were found, while it was a 0.6% copy number loss (one donor affected out of 165 donors). In a third liver cancer data set (Pfizer, Samsung, Seoul, South Korea) there were no donors (from a total of 272) with copy number changes. Therefore, we can conclude that the data concerning the copy number variation for the RapGEF1 gene points to a nonsignificant effect on HCC, based on the number of samples analyzed. However, a larger liver cancer sample dataset should be analyzed to confirm this conclusion.
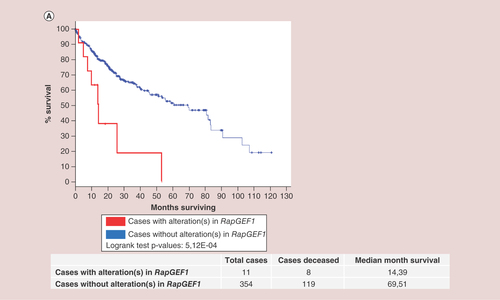
Finally, we studied the survival Kaplan–Meier curves for RapGEF1 gene in HCC, processed by cBioportal platform using the TCGA database [Citation81]. As shown in , the overall survival of the group of patients with alterations in RapGEF1 is nearly five-times smaller (4.83) than that of the group with no alterations. Specifically, from 11cases, eight patients died, the median survival being 14.39months. In contrast, in the group with no alterations in this gene, composed by 354cases, 119 died, the median survival being 69.51months. Therefore, we can conclude that the above mentioned RapGEF1 mutations have a relevant impact on mortality and they would be considered as a bad prognosis factor in HCC. However, it would be essential to know in which moment and context these mutations take place, as well as the type of mutation, in order to understand how they control HCC initiation, progression, and metastasis.
Kaplan–Meier survival curves for both patients without alterations in RapGEF1 (blue curve, 354cases) and with alteration(s) in RapGEF1 (red curve, 11cases), expressed as the percentage of alive patients along the time (expressed in months). These data and the graphic (with modifications) were extracted from cBioportal platform using TCGA database.
Potential use of Rap regulators as therapeutic agents for HCC & other liver diseases
Taking into account that targeting different members of the Rap subfamily (Rap1 or Rap2) may have opposite outcomes in the liver context, it is essential to design very specific drugs as a potential therapy for HCC and other liver diseases. However, no specific or selective inhibitors for Rap have been identified yet. There are only either pan inhibitors which target small GTPases, or indirect approaches involving GEF inhibitors or GAP activators, which are all useful for laboratory research, but not for patients’ treatment because of their non-specific effects. In fact, the attempt to generate specific Ras inhibitors also failed for the same reason: a lack of specificity of the compounds.
The design of small molecules that can disrupt protein to protein interactions for Ras family of GTPases has been particularly challenging due to the structure of their hydrophobic pocket (not sufficiently deep and large). Thus, there are only a few pan-GTPase inhibitors and only some of them have a potential therapeutic effect. For example, a multiple site targeting, pan-Ras inhibitor, named 3144, exhibited antitumoral activity in xenograft assays, as it disrupted the Ras/Raf/MEK/ERKs signaling pathway [Citation82], but lacks of specificity. Another compound, CID1067700, a small molecule pan-GTPase inhibitor, was shown to act as a reversible competitive inhibitor that binds to the guanine nucleotide binding site of the GTPases from Ras, Rho and Rab subfamilies, having the additional problem of being cytotoxic and, therefore, useless as a therapy [Citation83].
As a complementary approach, small molecule inhibitors of GEF catalytic activities toward GTPases have been identified. In particular, a SOS1 chemical inhibitor was found using a combined structure-based virtual and fluorescent guanine nucleotide exchange assays screening that could be used for identifying other GEFs inhibitors [Citation84].
Different Epac antagonist and agonist-based therapies have been also tested in the last years looking for a potential pharmacological application. Some antagonists with promising properties have been found Citation[85]. In particular, two noncyclic nucleotide Epac2-specificic antagonists, ESI-05 and ESI-07, that inhibit Rap1 activation showed a high potency in vitro. These two small compounds bind to a newly reported allosteric site located in the interface of the two cAMP binding domains, which is not present in Epac1 [Citation86]. Another compound, ESI-09, specifically blocks Epac-mediated Rap1 activation and impaired migration and invasion of pancreatic cancer cells [Citation87]. However, it lacks isoform selectivity [Citation88,Citation89].
Taking all this into account, we are still far away from having specific inhibitors of Rap and/or its GEFs. However, efforts should be put on the screening of new selective GEF inhibitors that could specifically block Rap activation, and, therefore, they could be used for HCC treatment or other liver diseases.
Conclusion
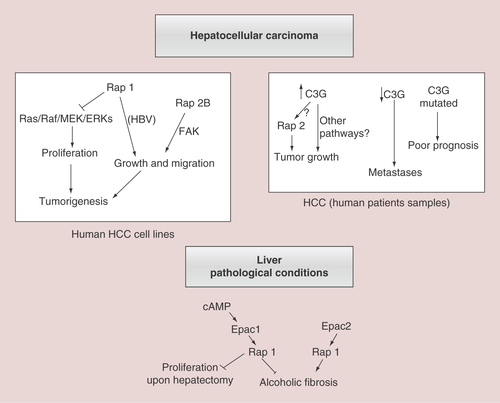
Although there is not much information in the literature about the function of Rap in the liver and in HCC, a number of data indicate that Epac-mediated activation of Rap is involved in the regulation of different liver physiopathological processes (). However, the precise function of C3G remains to be established. The information derived from different databases points out to an increased expression of C3G mRNA in HCC, which would be reduced in metastatic tumors. In addition, several mutations have been found in some patients(). However, all this information comes from genetic data. Therefore, it remains to be determined how these changes might impact on C3G protein expression and/or a selective enrichment, in particular isoforms in samples derived from HCC patients. It would also be interesting to determine which specific C3G mutations correlate with an adverse prognosis in HCC patients. Moreover, it would be essential to perform in vitro studies using HCC cell lines in order to determine which C3G isoforms are present and in which amount. In addition, the effect of C3G on tumor growth and migratory/invasive properties of HCC cells, as well as the potential requirement of Rap, needs to be established using knockdown approaches. The particular effect of C3G mutations might be also determined in vitro using C3G knockdown HCC cell lines expressing the mutated C3G forms.
This scheme summarizes the most relevant actions of Rap1/2 and their main GEFs, Epac and C3G, in different liver pathological contexts. Upper left panel shows both the anti- and pro-tumorigenic effect of Rap1, as well as that of Rap2B promoting tumor growth and migration in human HCC cell lines. The potential implication of Ras/ERKs cascade and FAK is also indicated. Upper right panel reflects the positive or negative correlation between C3G levels in human patients’ samples and HCC initiation or progression, respectively. Rap2 could mediate C3G pro-tumorigenic effect, although other mechanisms are possible. The relationship between C3G gene mutations and a poor prognosis is also included. Lower panel shows the antagonist contribution of Epac1 and Epac2 proteins in ALF and other effects of Epac1/Rap1 in the partial hepatectomy response.
ALF:Alcoholic liver fibrosis;HCC:Hepatocellular carcinoma.
Future perspective
Although there are still many open questions about the function of Rap and Rap GEFs in liver physiopathology and, in particular, in HCC, a number of issues will be solved in the next few years. Firstly, in vitro studies using human HCC cell lines will allow the characterization of the role played by Rap and C3G (the main RapGEF) in tumor growth and migration/invasion. Moreover, the use of mice models to induce subcutaneous tumors by xenograft assays and/or HCC through chemical and genetic approaches will contribute to define their functions in HCC. In addition, it is expected that public databases will highly increase the number of available data derived from patients, so that a good statistical correlation could be established between Rap and C3G (mRNA and protein) levels or mutated C3G and HCC development, progression, and patient survival. In this way, and taking into account the results derived from in vitro studies, C3G levels and/or certain mutations will likely be used as new diagnostic and prognostic markers.
Role of Rap family members & its GEFs in liver physiology
Rap proteins, activated by the RapGEF and Epac, regulate liver physiology.
The liver presents a specific Epac2 isoform (lacking the first cAMP-binding domain), and an enrichment in shorter isoforms of C3G (lacking the E-caherin domain).
Rap proteins regulate the hepatic glucose metabolism through a cAMP/Epac pathway.
The cAMP/Epac/Rap cascade constitutes an important pro-survival signaling pathway for hepatocytes.
Relevance of Rap proteins & its GEFs in liver pathologies & hepatocellular carcinoma
The Epac/Rap1 cascade is involved in liver regeneration induced by partial hepatectomy.
The Epac1/Rap1 cascade induces an antifibrotic effect, suppressing hepatic stellate cell activation and proliferation.
Epac2/Rap1 pathway activates a profibrotic response in rat alcoholic liver disease.
Rap2B upregulation promotes tumor growth and progression of hepatocellular carcinoma (HCC), while Rap1 appears to play a dual role.
Changes in C3G expression & genetic alterations in human hepatocellular carcinoma
According to different genetic databases, C3G mRNA levels are increased in hepatocellular carcinoma, although in metastatic stages they are lower than in normal tissue.
Several mutations in the rapGEF1 gene have been found in HCC patients.
Survival of patients with rapGEF1 gene alterations is smaller than that of the group without alterations.
Conclusion
Although C3G mRNA levels are altered in HCC, its effect on protein levels and/or the pattern of expression of the different isoforms remains to be determined.
The function of C3G and Rap in tumor growth and migration/invasion of HCC cells needs to be established by in vitro and in vivo studies.
C3G might represent a new diagnostic and prognostic marker of HCC, as well as a new therapeutic target.
Financial & competing interests disclosure
This work was supported by grants from the Spanish Ministry of Economy and Competitiveness (SAF2016-76588-C2-1-R to A Porras and SAF2016-76588-C2-2-R to C Guerrero), two grants from the Council of Education of Junta de Castilla y León, Spain (SA157A12-1 and SA017U16 to C Guerrero) and by a grant from the Council of Health of Junta de Castilla y León, Spain (GRS 991/A/14 to FMH). All funding was cosponsored by the European FEDER Program. C Sequera and S Manzano are recipients of PhD fellowships from Complutense University of Madrid and Spanish Ministry of Education, respectively. The authors have no other relevant affiliations or financial involvement with any organization or entity with a financial interest in or financial conflict with the subject matter or materials discussed in the manuscript apart from those disclosed.
No writing assistance was utilized in the production of this manuscript.
Additional information
Funding
References
- Guo XX, An S, Yang Y, Liu Y, Hao Q, Xu TR. Rap-interacting proteins are key players in the rap symphony orchestra. Cell. Physiol. Biochem. 39(1), 137–156 (2016).
- Ohba Y, Ikuta K, Ogura A et al. Requirement for C3G-dependent Rap1 activation for cell adhesion and embryogenesis. EMBO J. 20(13), 3333–3341 (2001).
- Katagiri K, Maeda A, Shimonaka M, Kinashi T. RAPL, a Rap1-binding molecule that mediates Rap1-induced adhesion through spatial regulation of LFA-1. Nat. Immunol. 4(8), 741–748 (2003).
- Kooistra MR, Dubé N, Bos JL. Rap1: a key regulator in cell-cell junction formation. J. Cell Sci. 120(Pt 1), 17–22 (2007).
- Pannekoek WJ, Kooistra MR, Zwartkruis FJ, Bos JL. Cell–cell junction formation: the role of Rap1 and Rap1 guanine nucleotide exchange factors. Biochim. Biophys. Acta. 1788(4), 790–796 (2009).
- Hogan C, Serpente N, Cogram P et al. Rap1 regulates the formation of E-cadherin-based cell-cell contacts. Mol. Cell. Biol. 24(15), 6690–6700 (2004).
- Priego N, Arechederra M, Sequera C et al. C3G knock-down enhances migration and invasion by increasing Rap1-mediated p38α activation, while it impairs tumor growth through p38α-independent mechanisms. Oncotarget 7(29), 45060–45078 (2016).
- Shimonaka M, Katagiri K, Nakayama T et al. Rap1 translates chemokine signals to integrin activation, cell polarization, and motility across vascular endothelium under flow. J. Cell Biol. 161(2), 417–427 (2003).
- Schwamborn JC, Püschel AW. The sequential activity of the GTPases Rap1B and Cdc42 determines neuronal polarity. Nat. Neurosci. 7(9), 923–929 (2004).
- Branham MT, Bustos MA, De Blas GA, Rehmann H, Zarelli VE, Treviño CL. Epac activates the small G proteins Rap1 and Rab3A to achieve exocytosis. J. Biol. Chem. 284(37), 24825–24839 (2009).
- Maia V, Sanz M, Gutierrez-Berzal J et al. C3G silencing enhances STI-571-induced apoptosis in CML cells through p38 MAPK activation, but it antagonizes STI-571 inhibitory effect on survival. Cell Signal. 21(7), 1229–1235 (2009).
- Altschuler DL, Ribeiro-Neto F. Mitogenic and oncogenic properties of the small G protein Rap1b. Proc. Natl Acad. Sci. USA 95(13), 7475–7479 (1998).
- Chen CH, Chuang HC, Huang CC et al. Overexpression of Rap-1A indicates a poor prognosis for oral cavity squamous cell carcinoma and promotes tumor cell invasion via Aurora-A modulation. Am. J. Pathol. 182(2), 516–528 (2013).
- Minato N. Rap G protein signal in normal and disordered lymphohematopoiesis. Exp. Cell Res. 319(15), 2323–2328 (2013).
- Jeyaraj SC, Unger NT, Chotani MA. Rap1 GTPases: an emerging role in the cardiovasculature. Life Sci. 88(15–16), 645–652 (2011).
- Radha V, Mitra A, Dayma K, Sasikumar K. Signalling to actin: role of C3G, a multitasking guanine-nucleotide-exchange factor. Biosci. Rep. 31(4), 231–244 (2011).
- Gutiérrez-Berzal J, Casterllano E, Martín-Encabo S et al. Characterization of p87C3G, a novel, truncated C3G isoform that is overexpressed in chronic myeloid leukemia and interacts with Bcr-Abl. Exp. Cell Res. 312(6), 938–948 (2006).
- Shivakrupa R, Radha V, Sudhakar Ch, Swarup G. Physical and functional interaction between Hck tyrosine kinase and guanine nucleotide exchange factor C3G results in apoptosis, which is independent of C3G catalytic domain. J. Biol. Chem. 278(52), 52188–52194 (2003).
- Ichiba T, Hashimoto Y, Nakaya M, Kuraishi Y, Tanaka S, Kurata T. Activation of C3G guanine nucleotide exchange factor for Rap1 by phosphorylation of tyrosine 504. J. Biol. Chem. 274(20), 14376–14381 (1999).
- Tanaka S, Morishita T, Hashimoto Y et al. C3G, a guanine nucleotide-releasing protein expressed ubiquitously, binds to the Src homology 3 domains of CRK and GRB2/ASH proteins. Proc. Natl Acad. Sci. USA 91(8), 3443–3447 (1994).
- Guerrero C, Fernandez-Medarde A, Rojas JM, Font de Mora J, Esteban LM, Santos E. Transformation suppressor activity of C3G is independent of its CDC25-homology domain. Oncogene 16(5), 613–624 (1998).
- de Jong R, van Wijk A, Heisterkamp N, Groffen J. C3G is tyrosine-phosphorylated after integrin-mediated cell adhesion in normal but not in Bcr/Abl expressing cells. Oncogene 17(21), 2805–2810 (1998).
- Arai A, Nosaka Y, Kanda E, Yamamoto K, Miyasaka N, Miura O. Rap1 is activated by erythropoietin or interleukin-3 and is involved in regulation of beta1 integrin-mediated hematopoietic cell adhesion. J. Biol. Chem. 276(13), 10453–10462 (2001).
- Voss AK, Gruss P, Thomas T. The guanine nucleotide exchange factor C3G is necessary for the formation of focal adhesions and vascular maturation. Development 130(2), 355–367 (2003).
- Uemura N, Griffin JD. The adapter protein Crkl links Cbl to C3G after integrin ligation and enhances cell migration. J. Biol. Chem. 274(53), 37525–37532 (1999).
- Chiang SH, Baumann CA, Kanzaki M et al. Insulin-stimulated GLUT4 translocation requires the CAP-dependent activation of TC10. Nature 410(6831), 944–948 (2001).
- Sasi Kumar K, Ramadhas A, Nayak SC, Kaniyappan S, Dayma K1, Radha V. C3G (RapGEF1) a regulator of actin dynamics promotes survival and myogenic differentiation of mouse mesenchymal cells. Biochim. Biophys. Acta. 1853(10 Pt A), 2629–2639 (2015).
- Shivakrupa R, Radha V, Sudhakar Ch, Swarup G. Physical and functional interaction between Hck tyrosine kinase and guanine nucleotide exchange factor C3G results in apoptosis, which is independent of C3G catalytic domain. J. Biol. Chem. 278(52), 52188–52194 (2003).
- Radha V, Rajanna A, Gupta RK, Dayma K, Raman T. The guanine nucleotide exchange factor, C3G regulates differentiation and survival of human neuroblastoma cells. J. Neurochem. 107(5), 1424–1435 (2008).
- Gutiérrez-Uzquiza A, Arechederra M, Molina I et al. C3G down-regulates p38 MAPK activity in response to stress by Rap-1 independent mechanisms: involvement in cell death. Cell Signal. 22(3), 533–542 (2010).
- Maia V, Sanz M, Gutierrez-Berzal J et al. C3G silencing enhances STI-571-induced apoptosis in CML cells through p38 MAPK activation, but it antagonizes STI-571 inhibitory effect on survival. Cell Signal. 21(7), 1229–1235 (2009).
- Voss AK, Krebs DL, Thomas T. C3G regulates the size of the cerebral cortex neural precursor population. EMBO J. 25(15), 3652–3663 (2006).
- Gutiérrez-Herrero S, Maia V, Gutiérrez-Berzal J et al. C3G transgenic mouse models with specific expression in platelets reveal a new role for C3G in platelet clotting through its GEF activity. Biochim. Biophys. Acta. 1823(8), 1366–1377 (2012).
- Martín-Encabo S, Santos E, Guerrero C. C3G mediated suppression of malignant transformation involves activation of PP2A phosphatases at the subcortical actin cytoskeleton. Exp. Cell Res. 313(18), 3881–3891 (2007).
- Guerrero C, Martín-Encabo S, Fernández-Medarde A, Santos E. C3G-mediated suppression of oncogene-induced focus formation in fibroblasts involves inhibition of ERK activation, cyclin A expression and alterations of anchorage-independent growth. Oncogene 23(28), 4885–4893 (2004).
- Guvakova MA, Lee WS, Furstenau DK et al. The small GTPase Rap1 promotes cell movement rather than stabilizes adhesion in epithelial cells responding to insulin-like growth factor I. Biochem. J. 463(2), 257–270 (2014).
- Okino K, Nagai H, Nakayama H et al. Inactivation of Crk SH3 domain-binding guanine nucleotide-releasing factor (C3G) in cervical squamous cell carcinoma. Int. J. Gynecol. Cancer 16(2), 763–771 (2006).
- Hirata T, Nagai H, Koizumi K et al. Amplification, up-regulation and over-expression of C3G (CRK SH3 domain-binding guanine nucleotide-releasing factor) in non-small cell lung cancers. J. Hum. Genet. 49(6), 290–295 (2004).
- De Falco V, Castellone MD, De Vita G et al. RET/papillary thyroid carcinoma oncogenic signaling through the Rap1 small GTPase. Cancer Res. 67(1), 381–390 (2007).
- Martín-Granado V, Ortiz-Rivero S, Carmona R et al. C3G promotes a selective release of angiogenic factors from activated mouse platelets to regulate angiogenesis and tumor metastasis. Oncotarget 8(67), 110994–111011 (2017).
- Rangarajan S, Enserink JM, Kuiperij HB et al. Cyclic AMP induces integrin-mediated cell adhesion through Epac and Rap1 upon stimulation of the beta 2-adrenergic receptor. J. Cell Biol. 160(4), 487–493 (2003).
- Fukuhara S, Sakurai A, Sano H et al. Cyclic AMP potentiates vascular endothelial cadherin-mediated cell-cell contact to enhance endothelial barrier function through an Epac-Rap1 signaling pathway. Mol. Cell. Biol. 25(1), 136–146 (2005).
- Cullere X, Shaw SK, Andersson L, Hirahashi J, Luscinskas FW, Mayadas TN. Regulation of vascular endothelial barrier function by Epac, a cAMP-activated exchange factor for Rap GTPase. Blood 105(5), 1950–1955 (2004).
- Kooistra MR, Corada M, Dejana E, Bos JL. Epac1 regulates integrity of endothelial cell junctions through VE-cadherin. FEBS Lett. 579(22), 4966–4972 (2005).
- Muñoz-Llancao P, Henríquez DR, Wilson C et al. Exchange protein directly activated by cAMP (EPAC) regulates neuronal polarization through Rap1B. J. Neurosci. 35(32), 11315–11329 (2015).
- Cheng Z, Li X, Ding J. Characteristics of liver cancer stem cells and clinical correlations. Cancer Lett. 379(2), 230–238 (2015).
- Lee JS, Heo J, Libbrecht L et al. A novel prognostic subtype of human hepatocellular carcinoma derived from hepatic progenitor cells. Nat. Med. 12(4), 410–416 (2006).
- Holczbauer A, Factor VM, Andersen JB et al. Modeling pathogenesis of primary liver cancer in lineage-specific mouse cell types. Gastroenterology 145(1), 221–231 (2013).
- Niu ZS, Niu XJ, Wang WH. Genetic alterations in hepatocellular carcinoma: An update. World J. Gastroenterol. 22(41), 9069–9095 (2016).
- Tejeda-Maldonado J, García-Juárez I, Aguirre-Valadez et al. Diagnosis and treatment of hepatocellular carcinoma: an update. World J. Hepatol. 7(3), 362–376 (2015).
- De Minicis S, Kisseleva T, Francis H et al. Liver carcinogenesis: rodent models of hepatocarcinoma and cholangiocarcinoma. Dig. Liver Dis. 45(6), 450–459 (2013).
- Umeda S, Kanda M, Kodera Y. Emerging evidence of molecular biomarkers in hepatocellular carcinoma. Histol. Histopathol. 33(4), 343–355 (2017).
- Ueno H, Shibasaki T, Iwanaga T et al. Characterization of the gene EPAC2: structure, chromosomal localization, tissue expression, and identification of the liver-specific isoform. Genomics 78(1–2), 91–98 (2001).
- Cheerathodi M, Vincent JJ, Ballif BA. Quantitative comparison of CrkL-SH3 binding proteins from embryonic murine brain and liver: Implications for developmental signaling and the quantification of protein species variants in bottom-up proteomics. J. Proteomics 125, 104–111 (2015).
- Mahony R, Ahmed S, Diskin C, Stevenson NJ. SOCS3 revisited: a broad regulator of disease, now ready for therapeutic use? Cell. Mol. Life Sci. 73(17), 3323–3336 (2016).
- Gaudy AM, Clementi AH, Campbell JS, Smrcka AV, Mooney RA. Suppressor of cytokine signaling-3 is a glucagon-inducible inhibitor of PKA activity and gluconeogenic gene expression in hepatocytes. J. Biol. Chem. 285(53), 41356–41365 (2010).
- Cullen KA, McCool J, Anwer MS, Webster CR. Activation of cAMP-guanine exchange factor confers PKA-independent protection from hepatocyte apoptosis. Am. J. Physiol. Gastrointest. Liver Physiol. 287(2), G334–G343 (2004).
- Gates A, Hohenester S, Anwer MS, Webster CR. cAMP-GEF cytoprotection by Src tyrosine kinase activation of phosphoinositide-3-kinase p110 beta/alpha in rat hepatocytes. Am. J. Physiol. Gastrointest. Liver Physiol. 296(4), G764–G774 (2009).
- Johnston A, Ponzetti K, Anwer MS, Webster CR. cAMP-guanine exchange factor protection from bile acid-induced hepatocyte apoptosis involves glycogen synthase kinase regulation of c-Jun NH2-terminal kinase. Am. J. Physiol. Gastrointest. Liver Physiol. 301(2), G385–G400 (2011).
- Lin YL, Mettling C, Chou CK. Rap1-suppressed tumorigenesis is concomitant with the interference in ras effector signaling. FEBS Lett. 467(2–3), 184–188 (2000).
- Su H, Yang JR, Xu T et al. MicroRNA-101, down-regulated in hepatocellular carcinoma, promotes apoptosis and suppresses tumorigenicity. Cancer Res. 69(3), 1135–1142 (2009).
- Sheng Y, Ding S, Chen K et al. Functional analysis of miR-101–3p and Rap1b involved in hepatitis B virus-related hepatocellular carcinoma pathogenesis. Biochem. Cell Biol. 92(2), 152–162 (2014).
- Zhang L, Duan H, Yang Y. Knockdown of Rap2B inhibits the proliferation and invasion in hepatocellular carcinoma cells. Oncol. Res. 25(1), 19–27 (2017).
- Cruise JL, Rafferty MP, Riehle MM. Cell-cycle regulated expression of Rap1 in regenerating liver. Biochem. Biophys. Res. Commun. 230(3), 578–581 (1997).
- Chen XG, Xu CS, Liu YM. Involvement of ERK1/2 signaling in proliferation of eight liver cell types during hepatic regeneration in rats. Genet. Mol. Res. 12(1), 665–677 (2013).
- Li JW, Wang GP, Fan JY, Chang CF, Xu CS. Eight paths of ERK1/2 signalling pathway regulating hepatocyte proliferation in rat liver regeneration. J. Genet. 90(3), 435–442 (2011).
- Windmeier C, Gressner AM. Pharmacological aspects of pentoxifylline with emphasis on its inhibitory actions on hepatic fibrogenesis. Gen. Pharmacol. 29(2), 181–196 (1997).
- Yokoyama U, Patel HH, Lai NC, Aroonsakool N, Roth DM, Insel PA. The cyclic AMP effector Epac integrates pro- and anti-fibrotic signals. Proc. Natl Acad. Sci. USA 105(17), 6386–6391 (2008).
- Insel PA, Murray F, Yokoyama U et al. cAMP and Epac in the regulation of tissue fibrosis. Br. J. Pharmacol. 166(2), 447–456 (2012).
- Mello T, Ceni E, Surrenti C, Galli A. Alcohol induced hepatic fibrosis: role of acetaldehyde. Mol. Aspects Med. 29(1–2), 17–21 (2008).
- Hernandez-Gea V, Friedman SL. Pathogenesis of liver fibrosis. Annu. Rev. Pathol. 6, 425–456 (2011).
- Yang Y, Yang F, Wu X, Lv X, Li J. EPAC activation inhibits acetaldehyde-induced activation and proliferation of hepatic stellate cell via Rap1. Can. J. Physiol. Pharmacol. 94(5), 498–507 (2016).
- BioGPS Portal. GeneAtlas U133A, gcrma. Tissue-specific pattern of RapGEF1 expression (2017). http://biogps.org/#goto=genereport&id=2889.
- GTExportal (GTEx Analysis Release V6P). Gene expression of RapGEF1 gene (2017). https://gtexportal.org/home/gene/RAPGEF1.
- GENT (Gene Expression across Normal and Tumoral Tissue) platform. RapGEF1 mRNA expression in normal and tumoral liver samples (2017). http://medicalgenome.kribb.re.kr/GENT/search/view_result.php.
- Firebrowse platform. Differential plot of RapGEF1 mRNA expression across different normal and tumoral samples (2017). http://medicalgenome.kribb.re.kr/GENT/search/view_result.php.
- Li B, Dewey CN. RSEM: accurate transcript quantification from RNA-Seq data with or without a reference genome. BMC Bioinformatics 12, 323 (2011).
- Gene Investigator Software. Open access tool to explore mRNA expression of different genes and samples, across different public datasets (2017). https://genevestigator.com/gv/.
- cBioportal for cancer genomics portal. Query for RapGEF1 gene in hepatocarcinoma in different datasets (2017). http://www.cbioportal.org/index.do?session_id=5a359f8d498eb8b3d5623002.
- OASIS Analitics platform. Summary of RapGEF1 alterations from different cancer projects (2017). http://www.oasis-genomics.org/martreport/?report=report&mart=gene_report&ensembl_gene_id=ENSG00000107263&datasets=hsapiens_gene_ensembl_oasis1hkugc.
- cBioportal for cancer genomics portal. Query for RapGEF1 gene in TCGA Hepatocarcinoma dataset, survival (2017). http://www.cbioportal.org/index.do?session_id=59c265e3498e5df2e295878c&show_samples=false&.
- Welsch ME, Kaplan A, Chambers JM et al. Multivalent small-molecule pan-RAS inhibitors. Cell 168(5), 878.e29–889.e29 (2017).
- Hong L, Guo Y, BasuRay S et al. A pan-GTPase inhibitor as a molecular probe. PLoS One 10(8), e0134317 (2015).
- Evelyn CR, Biesiada J, Duan X et al. Combined rational design and a high throughput screening platform for identifying chemical inhibitors of a Ras-activating enzyme.. J. Biol. Chem. 290(20), 12879–12898 (2015).
- Parnell E, Palmer TM, Yarwood SJ. The future of EPAC-targeted therapies: agonism versus antagonism. Trends Pharmacol. Sci. 36(4), 203–14 (2015).
- Tsalkova T, Mei FC, Li S et al. Isoform-specific antagonists of exchange proteins directly activated by cAMP. Proc. Natl Acad. Sci. USA 109(45), 18613–18618 (2012).
- Almahariq M, Tsalkova T, Mei FC et al. A novel EPAC-specific inhibitor suppresses pancreatic cancer cell migration and invasion. Mol. Pharmacol. 83(1), 122–128 (2013).
- Rehmann H. Epac-inhibitors: facts and artefacts. Sci. Rep. 3, 3032 (2013).
- Zhu Y, Chen H, Boulton S, Mei F, Ye N. Biochemical and pharmacological characterizations of ESI-09 based EPAC inhibitors: defining the ESI-09 “therapeutic window”. Sci. Rep. 5, 9344 (2015).