
Abstract
Aim: To describe treatment patterns and economic burden in patients with mantle cell lymphoma (MCL). Patients & methods: A retrospective cohort study of adults with MCL utilizing commercial claims (2015–2021) was conducted. Results: The most common regimens were bendamustine plus rituximab-based (28.5%) and rituximab-cyclophosphamide, doxorubicin, vincristine and prednisone (R-CHOP)/CHOP-based (17.6%) in first-line (1L), hematopoietic stem cell transplantation (HSCT) in second-line (2L; 23.9%) and rituximab in third-line (3L; 43.7%) treatment. Respective to 1L, 2L and 3L, approximately 9.6%, 14.0% and 19.8% of patients received Bruton tyrosine kinase inhibitors, and mean total healthcare costs were $262,529, $365,892 and $260,744 per patient per year. Conclusion: Patients with MCL received guideline-concordant therapies and incurred substantial healthcare resource utilization and costs.
TWEETABLE ABSTRACT
In this real-world analysis, patients with MCL received guideline-concordant therapies and incurred substantial healthcare resource utilization and cost, highlighting a need for novel agents.
Previous studies on treatment patterns and economic burden of patients with mantle cell lymphoma (MCL) have not focused on the changing treatment landscape. Few studies assessed healthcare resource utilization and costs by treatment lines.
In the USA, commercial claims data offers an opportunity to examine nationally-representative, new MCL treatment patterns and resource use.
In this study, the predominant treatment regimens, bendamustine plus rituximab (28.5%) and rituximab plus cyclophosphamide, doxorubicin, vincristine and prednisone (17.6%) in first line (1L) and rituximab (16.9% and 43.7%, respectively) in second line (2L) and third line (3L), were consistent with the current guidelines and other studies.
There was an increasing trend of hematopoietic stem cell transplantation therapy in later lines of treatments (23.9% in 2L and 16.7% in 3L) and Bruton tyrosine kinase inhibitors-based regimens (9.6, 14.0 and 19.8% for 1L, 2L and 3L, respectively).
Our study reported higher mean all-cause medical costs ($19,759 per patient per month or $237,113 per patient per year in 1L) as compared with the total medical costs from previous reports. It could be attributed to new treatment choices or different follow-up periods.
Overall, inpatient costs were the largest driver of total all-cause medical costs, followed by outpatient and office-based costs.
The study provides novel information for the most recent changes in MCL treatment patterns and associated economic burden for payers and patients.
Mantle cell lymphoma (MCL) is a rare and aggressive form of non-Hodgkin lymphoma (NHL) with an estimated incidence rate of one case per 200,000 people in the United States (US) [Citation1]. The majority of patients with MCL are male, Caucasian or older than 60 years of age at diagnosis; additionally, most patients are diagnosed with advanced stages of the disease [Citation2,Citation3]. The median overall survival is approximately 3–5 years [Citation4,Citation5], with recent reports indicating improvements after approval of Bruton tyrosine kinase inhibitors (BTKi) [Citation6,Citation7]. Depending on various clinical factors such as patient age, disease stage and patient's overall health and tolerance, the treatment options for MCL include chemotherapy, immunotherapy, radiation, hematopoietic stem cell transplantation (HSCT), bone marrow transplantation, targeted therapy and observation or a combination of these treatments [Citation8–11].
Current treatment guidelines for MCL recommend a variety of induction chemotherapies and immunotherapies for patients initiating first-line (1L) therapy [Citation8,Citation9]. Some examples of aggressive induction therapies include alternating rituximab plus cyclophosphamide, doxorubicin, vincristine and prednisone (R-CHOP) and rituximab plus dexamethasone, cytarabine and cisplatin (also known as R-DHAP); bendamustine plus rituximab (BR) followed by rituximab and high-dose cytarabine; the NORDIC regimen or dose-intensified induction immunotherapy with rituximab plus cyclophosphamide, vincristine, doxorubicin and prednisone; and rituximab plus cyclophosphamide, vincristine, doxorubicin and dexamethasone alternating with high-dose methotrexate and cytarabine (rituximab-HyperCVAD). Examples of therapy for patients with less aggressive disease at presentation include BR; R-CHOP; bortezomib, rituximab, cyclophosphamide, doxorubicin and prednisone; and lenalidomide plus rituximab. In eligible patients, aggressive induction therapy is followed by consolidation with autologous HSCT [Citation8]. Over the past decade, targeted therapies, such as BTKis, immunomodulatory agents and proteosome inhibitors, have demonstrated efficacy in MCL in the second-line (2L) setting [Citation8,Citation12]. In addition, allogeneic HSCT may be recommended for eligible patients in the 2L or third-line (3L) setting. Furthermore, brexucabtagene autoleucel, a CD19-directed chimeric antigen receptor (CAR) T-cell therapy, has shown efficacy in adult patients with relapsed or refractory MCL [Citation13,Citation14]. Other CAR T-cell therapies such as lisocabtagene maraleucel are currently under investigation in MCL [Citation15,Citation16]. Emerging therapies and substantial advancements in MCL management have led to prolonged survival and improved quality of life [Citation17–19].
Previous studies using real-world data such as commercial claims and national registries reported that the majority of patients (>52%) with MCL were treated with systemic therapies such as chemotherapy and chemoimmunotherapy [Citation20–22]. Only about 3.6% received radiotherapy and 2.4% adopted the ‘wait-and-watch’ approach [Citation20]. The most common regimens among systemic therapies were BR (17–41%), R-CHOP (27–29%), rituximab monotherapy (20–31%) and ibrutinib (8–14%) [Citation21,Citation22]. Limited real-world data on healthcare resource utilization (HCRU) and associated cost are available since these novel agents (e.g., BTKis, proteasome inhibitors, CAR T-cell therapies) became available for MCL treatment within the last decade. Given the current changing landscape of MCL treatment and the advent of newer therapies, it is essential to understand the impact of these treatments and the cost burden on the healthcare system.
The current study aimed to assess the real-world HCRU and economic burden for patients diagnosed with MCL. The objectives of this study were to examine and quantify the all-cause and MCL-specific HCRU and cost among commercially insured patients with MCL in the first three lines of treatment.
Patients & methods
Study design & data source
This was an observational, retrospective, cohort study of commercial claims data. The Merative™ MarketScan® (formerly IBM® MarketScan®) Research Databases, from 1 January 2015 to 30 June 2021, including the Commercial Claims and Encounters (CCAE) Database and the Medicare Supplemental and Coordination of Benefits (MDCR) Database were used in this study [Citation23]. These databases contain data for over 200 million patients enrolled in employer-sponsored health plans from almost 350 payers annually [Citation24]. The CCAE database includes active employees and dependents, early (non-Medicare) retirees and dependents and patients who continued insurance coverage through the Consolidated Omnibus Budget Reconciliation Act; the MDCR Database includes Medicare-eligible active and retired employees and their Medicare-eligible dependents from employer-sponsored supplemental plans [Citation23]. The MarketScan databases contain data on patient demographic characteristics, enrollment history, use of medical and prescription drug services and payment.
Patient selection
Patients who were newly diagnosed with MCL (International Classification of Diseases [ICD], Ninth Revision, Clinical Modification [CM]: 200.4X; ICD, Tenth Revision, CM: C83.1X) were identified between 1 July 2015 and 31 December 2020. A 6-month baseline period before the index diagnosis date (the date of the first observed MCL claim) was used to examine patient demographic and clinical characteristics. Patients were included if they were at least 18 years of age at the index diagnosis date, received at least 1L treatment for MCL, did not have another MCL diagnosis claim in the baseline period and were continuously enrolled for at least 6 months before and after the index date. Patients were excluded if they had a claim of any other type of cancer, excluding lymphoma, leukemia and benign neoplasms, received an HSCT during the baseline period or participated in a clinical trial during the study period. Patients were followed for at least 6 months from the index diagnosis date until the end of the treatment line, end of continuous enrollment or end of study period, whichever occurred first.
Patient characteristics & treatments
Patient characteristics, including age at MCL index diagnosis, sex, US census region and payer type (commercial or Medicare), were identified in the baseline period. The year of MCL index diagnosis, comorbidities and the Deyo adaptation of the Charlson Comorbidity Index (CCI) scores in patients were also assessed [Citation25,Citation26].
To determine each treatment line and regimen combinations in the claims data, a prespecified algorithm was used [Citation21]. The index treatment was identified as the first claim for a systemic therapy; any treatment within 35 days of index was considered part of the 1L treatment. For oral medications, the line of therapy was considered to have ended 90 days after the date of the last observed oral regimen refill (i.e., the supply end date was the last observed refill date plus a subsequent treatment period of 90 days). For parenteral medications, the line of therapy was considered to have ended 30 days after the last administration. In the case where a patient had claims for both systemic therapies and oral medications within the 35-day period used to identify treatment lines, the end date for the treatment line was calculated based on the end date of the last medication. Rituximab monotherapy initiated ≤7 months after rituximab-containing regimens was considered maintenance therapy [Citation21]. Radiation therapy initiated ≤7 months after a parenteral or oral antineoplastic regimen was considered part of that regimen.
After the lines of therapy were determined for each patient, treatment regimens were aggregated into one of the following eight categories: BR based, R-CHOP/CHOP based, BTKi based, rituximab monotherapy, chemotherapy monotherapy (other than rituximab), HSCT, radiation and other. Receipt of BR or R-CHOP/CHOP was considered based on these regimens (i.e., BR-based, etc.) regardless of other therapies the patient received within 35 or 90 days for parenteral or oral therapies, respectively. However, radiation therapy was considered as a concomitant treatment if it was reported with other therapy unless it was reported alone in that line of treatment. Regimens that had a frequency of <2% in the treatment line and were not previously categorized were then combined into the ‘other’ category.
Healthcare resource utilization & costs
Both all-cause and MCL-specific HCRU and costs were determined for each patient by treatment line. HCRU measurements were based on the number of hospitalizations, length of hospital stays, emergency department visits, home health admissions, hospice admissions, skilled nursing facility uses, office-based visits, outpatient visits and other visits. Costs were captured as total medical costs for the above categories, except length of hospital stays; prescription drug costs were also captured. The total healthcare costs were calculated as total medical costs plus prescription drug costs.
Statistical analysis
Baseline characteristics, treatment patterns, HCRU and costs were analyzed descriptively. Categorical variables were reported as frequencies and percentages. Continuous variables were described using mean, standard deviation (SD), median, interquartile range (IQR) and range.
Frequency and percentage of patients receiving each type of regimen by treatment line were presented. A Sankey diagram was used to demonstrate treatment selections over time across the first three lines.
All-cause and MCL-related HCRU and costs were calculated as number per patient per year (PPPY). Mean, SD, median, IQR and ranges were reported. All costs were inflation adjusted to 2021 US dollars (USD) using the medical component of the Consumer Price Index. All analyses were conducted using SAS 9.4 (SAS Institute, NC, USA).
Results
Patient characteristics & treatments
A total of 529 patients with newly diagnosed MCL and ≥1 line of treatment were identified; within this population, 243 and 126 patients, respectively, had ≥2 and ≥3 lines of treatment (). The median length of follow-up was 23.6 months (IQR: 14.3–36.8). The mean age of the study population was 62.2 years (SD: 12.4). Most patients were males (66.2%) and from the Southern US (41.0%). The mean CCI score was 0.7 (SD: 1.2); overall, the patient population did not have heavy comorbid burden with the most common being diabetes without chronic complications (13.4%), chronic pulmonary disease (10.2%) and renal disease (8.1%) and only 43 patients (8.1%) had a CCI score of 3 or more ().
Figure 1. A flowchart of patient attrition.
aPatients without a noted line of therapy in the billing code database were excluded from this analysis.
HSCT: Hematopoietic stem cell transplantation; MCL: Mantle cell lymphoma.
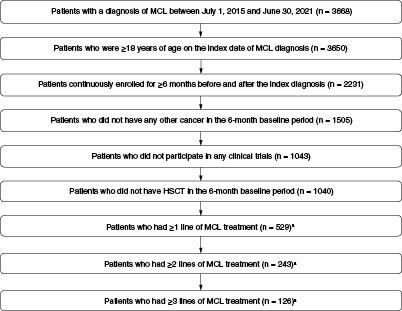
Table 1. Baseline characteristics of newly diagnosed patients with mantle cell lymphoma in 2015–2021.
Among 529 patients with at least 1L treatment, 243 (45.9%) received 2L and 126 (23.8%) received 3L treatments. The most common regimens were BR based (28.5%) and R-CHOP/CHOP based (17.6%) in 1L, HSCT (23.9%) and rituximab monotherapy (16.9%) in 2L and rituximab monotherapy (43.7%) in 3L. In 1L, 2L and 3L, respectively, a total of 13.4, 7.8 and 6.3% of patients received radiation; 9.6, 14.0 and 19.8% received BTKi-based regimens; and 2.1, 23.9 and 16.7% received HSCT (). Of note, HSCT alone accounted for roughly half of the HSCT-containing regimens across each line of therapy, and the others were HSCT in combination with additional pharmacotherapies or biologics. The sequences of MCL treatments as patients moved progressively through lines of therapy are presented in .
Figure 2. Percentage of treatment regimens by treatment line among patients with MCL in 2015–2021.
The percentages of regimens were calculated among patients who had each line of treatment (N = 529 for 1L; N = 243 for 2L; N = 126 for 3L).
1L: First line; 2L: Second line; 3L: Third line; BR: Bendamustine plus rituximab; BTKi: Bruton tyrosine kinase inhibitor; CHOP: Cyclophosphamide, doxorubicin, vincristine and prednisone; HSCT: Hematopoietic stem cell transplantation; MCL: Mantle cell lymphoma; R-CHOP: Rituximab plus cyclophosphamide, doxorubicin, vincristine and prednisone.
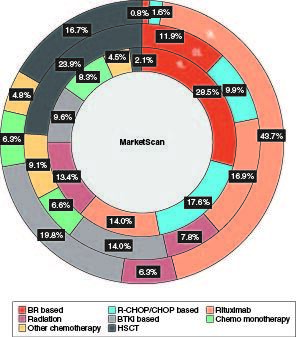
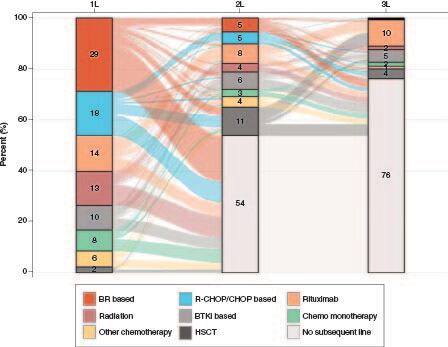
Figure 3. Distribution and sequence of treatment regimens across the first three lines among patients with MCL in 2015–2021.
The percentages of regimens were calculated among all patients who had 1L treatment (N = 529).
1L: First line; 2L: Second line; 3L: Third line; BR: Bendamustine plus rituximab; BTKi: Bruton tyrosine kinase inhibitor; CHOP: Cyclophosphamide, doxorubicin, vincristine and prednisone; HSCT: Hematopoietic stem cell transplantation; MCL: Mantle cell lymphoma; R-CHOP: Rituximab plus cyclophosphamide, doxorubicin, vincristine and prednisone.
Healthcare resource utilization & costs
Supplementary Table S1 & show HCRU and costs, respectively, by treatment lines. For all three treatment lines, the most frequent HCRU was outpatient visits with a mean of 30.9, 32.1 and 21.6 visits PPPY for 1L, 2L and 3L, respectively, followed by office-based visits (mean of 25.5, 23.2 and 18.9 visits PPPY; Supplementary Table S1). MCL-related outpatient visits for 1L, 2L and 3L, respectively, accounted for 59.9, 64.4 and 58.3% of the total outpatient visits; in addition, MCL-related office-based visits were nearly half of the total all-cause office-based visits (47.8, 48.2 and 49.2%).
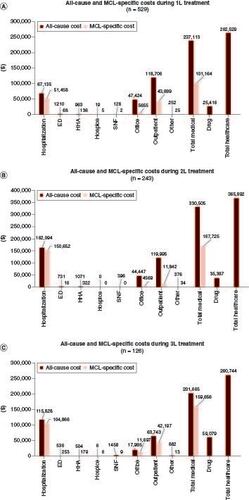
Figure 4. All-cause and MCL-specific costs per patient per year in the first three treatment lines among patients with MCL in 2015–2021.
All-cause and MCL-specific costs per patient per year in (A) 1L treatment, (B) 2L treatment, and (C) 3L treatment among patients with MCL in 2015–2021.
1L: First line; 2L: Second line; 3L: Third line; ED: Emergency department; HHA: Home health admissions; MCL: Mantle cell lymphoma; SNF: Skilled nursing facility.
Of note, MCL-related hospitalizations (mean of 1.4, 1.9 and 1.5 admissions PPPY) accounted for 80% or more of total all-cause hospitalizations for all three lines (Supplementary Table S1). Among 206 patients with ≥1 all-cause hospitalization and 148 patients with ≥1 MCL-specific hospitalization during the 1L treatment, the mean length of stay was 29.4 (SD: 40.2) and 31.4 days PPPY (SD: 37.7), respectively. The mean inpatient stays were 50.3 days PPPY (SD: 53.7) for 123 patients with all-cause hospitalization and 55.1 days PPPY (SD: 54.5) for 101 patients with MCL-specific hospitalization for 2L. For the 3L treatment, all-cause hospitalization for 48 patients with ≥1 all-cause inpatient stay was 54.8 days PPPY (SD: 75.3) and MCL-specific hospitalization among 40 patients with ≥1 MCL-specific inpatient stay was 59.4 days PPPY (SD: 79.4).
For 1L, 2L and 3L, respectively, the mean all-cause medical costs were $237,113 (SD: $284,418), $330,505 (SD: $442,403) and $201,665 PPPY (SD: $350,484) and MCL-specific medical costs counted for 42.7, 50.7 and 79.2% of all-cause medical costs (). Major drivers of costs were outpatient visits at 1L (30.9 visits PPPY [SD: 31.0] at $118,706 [SD: $186,126]) and inpatient services at 2L (2.2 admissions [SD: 3.6] and 50.3 inpatient days PPPY [SD: 53.7] at $162,094 [SD: $380,298]) and at 3L (1.6 admissions [SD: 3.5] and 54.8 inpatient stays PPPY [SD: 75.3] at $115,828 [SD: 340,092]), respectively. Total healthcare costs were $262,529 (SD: $285,175), $365,892 (SD: $446,627) and $260,744 (SD: $388,260) in 1L, 2L and 3L, respectively, after including the prescription drug costs.
Discussion
This study provided an overview of patient characteristics, treatment patterns and direct economic burden among commercially insured patients with MCL in a real-world setting. The predominant treatment regimens received in each line were consistent with the current guidelines for MCL treatment and two previously published studies (Goyal et al., 2019 using Truven MarketScan database and Kabadi et al., 2019 using IQVIA Real-World Data Adjudicated Claims) assessing data on commercially insured patients with MCL [Citation21,Citation22]. Findings from the current study showed BR-based and R-CHOP/CHOP-based regimens were the most frequently used 1L systemic therapies. However, as patients progressed to 2L and 3L, treatment regimens changed drastically, with BR-based and R-CHOP/CHOP-based regimens each accounting for <12% in 2L and <2% in 3L. In contrast, the most frequently used regimen received in 2L was HSCT and in 3L was rituximab monotherapy.
Compared with the previous studies [Citation21,Citation22], our data showed an increased use of HSCT. Roughly 24 and 17% of the treatments were HSCT related among those who received 2L and 3L, respectively, compared with a previously reported estimate of 7% [Citation22]. While this difference may be due to the variation in study samples, it may also be attributed to the increasing trends in the overall HSCT use over the past few decades in the US [Citation27]. Moreover, according to data from the Center for International Blood and Marrow Transplant Research, NHL (of which MCL is a subtype) became the second most commonly reported indication after multiple myeloma for all documented HSCTs in 2018 [Citation27]. A more recent report using the Optum database showed rates of HSCT use in 2L (17%) and 3L (11%) much closer to this analysis, despite the mean age (71 years) being 9 years higher [Citation28]. However, variability of patient baseline and disease characteristics can influence HSCT utilization rates. Another recent report using the Flatiron database showed the HSCT utilization rate in 2L (35%) was substantially higher than reported here [Citation29]. The Flatiron study had a patient population with a median age of 69 years and 5% with del(17p) or TP53 mutation (53% of patients had unknown genotype status), of which 62% were double positive for del(17p)/TP53 mutation. Taken together, the Flatiron study's patient population may have had a higher disease burden overall.
Furthermore, our study also identified BTKi-based therapies to be more prevalent in 2L and 3L compared with other reports [Citation21,Citation22]. There was also some BTKi use observed in 1L, while they are approved for use only in 2L and subsequent lines. This may be an artifact of the 6-month baseline period used as a washout period to identify newly diagnosed patients with MCL. A limitation associated with the use of claims databases is that it is not feasible to identify true cases of newly diagnosed patients. Therefore, it is possible that some of the patients who were identified as using BTKi therapies in 1L could be patients who were diagnosed earlier, were in a treatment-free period during the 6-month baseline period and reinitiated treatment during the study observation period.
Overall, findings from our study highlight the arising shift in the landscape of MCL therapies, which may bring changes in patient survival, quality of life and economic outcomes in the years to come. With the approval of novel agents with unique mechanisms of action such as targeted therapies and cellular therapies [Citation12] and emerging data on several alternatives for front-line treatment and management of relapse or refractory MCL [Citation16], it remains to be seen how treatment patterns in MCL evolve over the next several years and how approval of new agents impacts the clinical and economic landscapes.
Our results estimated the mean all-cause medical costs during 1L at $19,759 per patient per month (PPPM; based on PPPY costs [] divided by 12 months). Using the MarketScan database, Goyal et al. reported that the mean total all-cause monthly cost from the payer perspective (2016 USD) over the entire study follow-up period was $10,964 PPPM [Citation21]. Kabadi et al. using more recent data found that among patients with MCL receiving treatment, the mean all-cause cost was $14,786 PPPM (2017 USD) over the follow-up period [Citation22]. Costs associated with each treatment line in our study were much higher than the estimates of all-cause and MCL-specific costs over the entire follow-up duration since diagnosis for these previous studies [Citation21,Citation22]. In addition to inflation adjustment, the increased costs observed in the current study may be attributed to costs being measured during the active treatment period as well as growing costs for MCL treatment over time. MCL-related costs accounted for over 40% of all-cause total medical costs and these findings are very similar to what was observed in a previous study [Citation22]. Notably, MCL-related hospitalizations made up a large proportion of all-cause inpatient costs (87%). Similarly, MCL-related outpatient costs accounted for about 47% of the all-cause outpatient costs. Taken together, these results highlight the substantial economic burden of MCL treatment from both the payer and patient perspective. Although MCL is a rare form of NHL, it may pose a significant resource burden on payers and it is essential that emerging, novel therapies aim to improve clinical outcomes while reducing HCRU and economic burden for patients and payers.
Strengths of this study include the use of MarketScan commercial claims data, which covered a diversity of geographic areas across the US and represented a large proportion of the US population. It also represented the most recent advances in the MCL treatment landscape during the time of analysis. However, several limitations should be noted. The accuracy of study results could be affected by misclassification errors. Patients may have been misclassified because of misdiagnosis or miscoding. Miscoding could have occurred if a provider mistakenly submitted the wrong code, used a less descriptive billing code, misclassified a condition, up-coded to maximize reimbursement, or omitted a diagnosed condition on the billing forms; claims data are also unreliable in differentiating between autologous and allogeneic HSCT, as they were grouped into one HSCT category. Additionally, it is possible that the prespecified treatment patterns algorithm we used and the limitation of not being able to differentiate between maintenance therapy and true monotherapy regimens in claims data may have also led to misclassification of patients based on the treatment lines observed in the data. Further regarding pharmacy claims, prescription drugs do not have ICD-10 codes associated with them that may have led some drug costs to be unaccounted for, potentially adding bias to the results. Finally, the study was limited to individuals insured commercially or through the Medicare program. The billing system was also unable to distinguish between patients who did not receive a new LOT and a patient in a cure state. Care should be taken when attempting to generalize these results to other MCL patient populations who may have different rates and types of HCRU due to different coverage.
Conclusion
This real-world analysis suggests that patients with MCL receiving guideline-concordant therapies incurred substantial HCRU and costs, highlighting the need for novel agents to lower the economic and public health burden in this population.
Author contributions
SJ Keating made substantial contributions to conception or design of the study and data interpretation; J Qian, S Inguva and R Shah made substantial contributions to conception or design of the study, data acquisition, data analysis and data interpretation. V Chirikov made substantial contributions to data interpretation. All authors contributed to and approved the manuscript.
Financial disclosure
SJ Keating was an employee of Bristol Myers Squibb at the time the research was conducted and is a current shareholder of Bristol Myers Squibb. S Inguva, J Qian and R Shah were employees of OPEN Health at the time of the study, which received consulting fees from Bristol Myers Squibb for conducting this analysis. V Chirikov is an employee of OPEN Health, which received consulting fees from Bristol Myers Squibb for conducting this analysis. This study was funded by Bristol Myers Squibb. The authors have no other relevant affiliations or financial involvement with any organization or entity with a financial interest in or financial conflict with the subject matter or materials discussed in the manuscript apart from those disclosed.
Writing disclosure
Writing and editorial assistance were provided by B Reinen and J Henriques of The Lockwood Group (Stamford, CT, USA), and were funded by Bristol Myers Squibb.
Ethical conduct of research
This study followed the STrengthening the Reporting of OBservational studies in Epidemiology (STROBE) reporting guideline for observational cohort studies. The study included data from commercial claims databases; therefore, institutional review board approval and informed consent were not required per 45 CFR 46.101(b)(4).
Data sharing statement
Bristol Myers Squibb policy on data sharing may be found at https://www.bms.com/researchers-and-partners/independent-research/data-sharing-request-process.html.
Competing interests disclosure
The authors have no competing interests or relevant affiliations with any organization or entity with the subject matter or materials discussed in the manuscript. This includes employment, consultancies, honoraria, stock ownership or options, expert testimony, grants or patents received or pending, or royalties.
Additional information
Funding
References
- Zhou Y, Wang H, Fang W et al. Incidence trends of mantle cell lymphoma in the United States between 1992 and 2004. Cancer. 113(4), 791–798 (2008).
- Leux C, Maynadié M, Troussard X et al. Mantle cell lymphoma epidemiology: a population-based study in France. Ann. Hematol. 93(8), 1327–1333 (2014).
- Smedby KE, Hjalgrim H. Epidemiology and etiology of mantle cell lymphoma and other non-Hodgkin lymphoma subtypes. Semin. Cancer Biol. 21(5), 293–298 (2011).
- Vose JM. Mantle cell lymphoma: 2017 update on diagnosis, risk-stratification, and clinical management. Am. J. Hematol. 92(8), 806–813 (2017).
- Witzens-Harig M, Hess G, Atta J et al. Current treatment of mantle cell lymphoma: results of a national survey and consensus meeting. Ann. Hematol. 91(11), 1765–1772 (2012).
- Di M, Cui C, Kothari SK et al. Survival of mantle cell lymphoma in the era of Bruton tyrosine kinase inhibitors: a population-based analysis. Blood Adv. 6(11), 3339–3342 (2022).
- Martin P, Cohen JB, Wang M et al. Treatment outcomes and roles of transplantation and maintenance rituximab in patients with previously untreated mantle cell lymphoma: results from large real-world cohorts. J. Clin. Oncol. 41(3), 541–554 (2023).
- Dreyling M, Campo E, Hermine O et al. Newly diagnosed and relapsed mantle cell lymphoma: ESMO Clinical Practice Guidelines for diagnosis, treatment and follow-up. Ann. Oncol. 28(Suppl. 4), iv62–iv71 (2017).
- Mckay P, Leach M, Jackson B, Robinson S, Rule S. Guideline for the management of mantle cell lymphoma. Br. J. Haematol. 182(1), 46–62 (2018).
- Abrisqueta P, Scott DW, Slack GW et al. Observation as the initial management strategy in patients with mantle cell lymphoma. Ann. Oncol. 28(10), 2489–2495 (2017).
- Martin P, Chadburn A, Christos P et al. Outcome of deferred initial therapy in mantle-cell lymphoma. J. Clin. Oncol. 27(8), 1209–1213 (2009).
- Lymphoma Research Foundation. Mantle cell lymphoma: FDA updates. https://lymphoma.org/aboutlymphoma/nhl/mcl/mclfdaupdates/ (January 6, 2022).
- Wang M, Munoz J, Goy A et al. KTE-X19 CAR T-cell therapy in relapsed or refractory mantle-cell lymphoma. N. Engl. J. Med. 382(14), 1331–1342 (2020).
- Wang M, Munoz J, Goy A et al. Three-year follow-up of KTE-X19 in patients with relapsed/refractory mantle cell lymphoma, including high-risk subgroups, in the ZUMA-2 study. J. Clin. Oncol. 41(3), 555–567 (2023).
- Wang M, Siddiqi T, Gordon LI et al. Lisocabtagene maraleucel in relapsed/refractory mantle cell lymphoma: primary analysis of the mantle cell lymphoma cohort from TRANSCEND NHL 001, a phase I multicenter seamless design study. J. Clin. Oncol. 42(10), 1146–1157 (2024).
- Buege MJ, Kumar A, Dixon BN et al. Management of mantle cell lymphoma in the era of novel oral agents. Ann. Pharmacother. 54(9), 879–898 (2020).
- Schieber M, Gordon LI, Karmali R. Current overview and treatment of mantle cell lymphoma. F1000Res. 7(F1000 Faculty Rev), 1136 (2018).
- Hanel W, Epperla N. Emerging therapies in mantle cell lymphoma. J. Hematol. Oncol. 13(1), 79 (2020).
- Rajguru S, Kahl BS. Emerging therapy for the treatment of mantle cell lymphoma. J. Natl Compr. Canc. Netw. 12(9), 1311–1318; quiz 1318 (2014).
- Abrahamsson A, Albertsson-Lindblad A, Brown PN et al. Real world data on primary treatment for mantle cell lymphoma: a Nordic Lymphoma Group observational study. Blood 124(8), 1288–1295 (2014).
- Goyal RK, Nagar SP, Kabadi SM, Kaye JA, Seal B, Mato AR. Adverse events, resource use, and economic burden associated with mantle cell lymphoma: a real-world assessment of privately insured patients in the United States. Leuk. Lymphoma 60(4), 955–963 (2019).
- Kabadi SM, Near A, Wada K, Burudpakdee C. Treatment patterns, adverse events, healthcare resource use and costs among commercially insured patients with mantle cell lymphoma in the United States. Cancer Med. 8(17), 7174–7185 (2019).
- Watson Health. IBM MarketScan Research Databases User Guide Commercial Claims and Encounters Database and Medicare Supplemental and Coordination of Benefits Database, Data Year 2019 Edition.
- Watson Health. IBM MarketScan Research Databases for life sciences researchers. https://www.ibm.com/downloads/cas/OWZWJ0QO (December 5, 2022).
- Charlson ME, Pompei P, Ales KL, Mackenzie CR. A new method of classifying prognostic comorbidity in longitudinal studies: development and validation. J. Chronic Dis. 40(5), 373–383 (1987).
- Deyo RA, Cherkin DC, Ciol MA. Adapting a clinical comorbidity index for use with ICD-9-CM administrative databases. J. Clin. Epidemiol. 42(6), 613–619 (1992).
- D'souza A, Fretham C, Lee SJ et al. Current use of and trends in hematopoietic cell transplantation in the United States. Biol. Blood Marrow Transplant. 26(8), e177–e182 (2020).
- Garg M, Satija A, Song Y et al. Economic burden and treatment patterns among patients with mantle cell lymphoma in the US: a retrospective claims analysis. Blood 140(Suppl. 1), 7920–7921 (2022).
- Narkhede M, Goyal G, Shea L, Mehta A, Giri S. Evaluating real-world treatment patterns and outcomes of mantle cell lymphoma. Blood Adv. 6(14), 4122–4131 (2022).