
Abstract
Aim: To improve the retention of fluorescein sodium (FS) as a kind of clinical contrast agent for fundus fluorescein angiography (FFA). Materials & methods: Polyethyleneimine (PEI) was designed to synthesize PEI–NHAc–FS nanoparticles (NPs), and the formed NPs were characterized by both physicochemical properties and their effects on FFA. Results: Compared with free FS, PEI–NHAc–FS NPs showed similar optical performance, and could obviously reduce cellular adsorption and uptake both in vitro and in vivo, which could promote the metabolism of NPs in ocular blood vessels. Conclusion: PEI–NHAc–FS NPs represent a smart nanosize fluorescence contrast agent, which hold promising potential for clinical FFA diagnosis, therapy and research work.
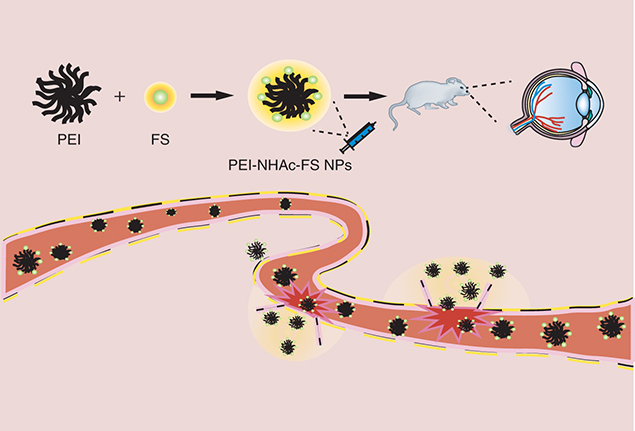
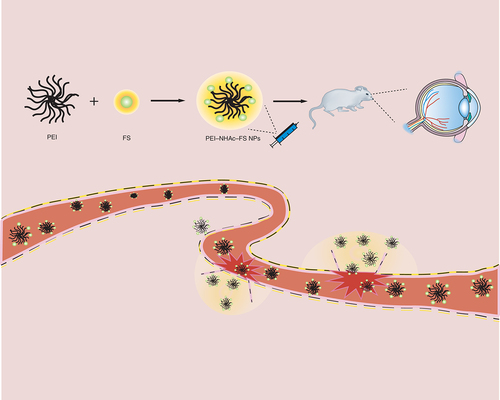
Graphical abstract
Fundus fluorescein angiography (FFA) has been used for several decades to assess choroidal retinopathy, such as age-related macular degeneration [Citation1], diabetic retinopathy [Citation2] and vascular occlusions [Citation3]. FFA has gradually become more prominent due to its good maneuverability, and is currently considered the most useful diagnostic tool to evaluate retinal and choroidal pathologies. FFA plays a vital role in the diagnosis and evaluation of therapeutic effects, otherwise, disease progression will lead to irreversible visual impairment if not diagnosed in a timely manner.
Fluorescein sodium (FS) is a kind of water-soluble fluorescent dye that has been widely used in several fields (such as intraoperative guided-resection of high-grade gliomas [Citation4,Citation5], central nervous lymphoma [Citation6] and eye diseases) due to the characteristics and easy preparation of FS. In the diagnosis of fundus vascular disease, the blood vessels filled with FS are clearly observed and recorded using a confocal scanning laser ophthalmoscopy system after an intravenously injection of FS. Although FS is considered to be relatively safe, some adverse reactions are still frequently observed, such as nausea and vomiting with the incidence rates of 2.7–5.1% [Citation7–9] and 0.6–2% [Citation7,Citation9–11], respectively. Meanwhile, more severe side effects (such as anaphylaxis with an incidence rate of 0.04–0.3%) are rare but serious [Citation12–15]. Furthermore, recently, many different polymers have been widely used as delivery carriers in bioapplications due to their controllable size and multifunctional structure. Nanoparticles (NPs) based on polymers with a high-molecular weight reduce the adsorption of NPs into normal tissues and improve the cytotoxicity of NPs [Citation16–19]. As a highly branched polymers, polyethyleneimine (PEI) with multifunctional modifications has been widely explored as a promising nanocarrier for gene delivery [Citation20–24], therapeutic drug delivery [Citation25–28] and computed tomography (CT)/magnetic resonance imaging (MRI) [Citation29–31]. Zhou et al. reported that PEI loaded with Gd/Au NPs displaying good cytocompatibility is a useful and effective tool for CT/MRI diagnosis both in vitro and in vivo [Citation29].
In the current study, PEI was chosen as an appropriate carrier to react with free FS, followed by the acetylation of the remaining amine groups on PEI to form PEI–NHAc–FS NPs for FFA. The reaction between PEI and FS did not substantially alter the optical performance of free FS. Meanwhile, compared with free FS, the PEI–NHAc–FS NPs showed obviously lower cellular adsorption and uptake both in vitro and in vivo (normal rats and choroidal neovascularization [CNV] rat models). More importantly, the designed PEI–NHAc–FS NPs can effectively distinguish normal retinal vessels and CNV leakages effectively, which is expected to experience broader use in clinical FFA diagnoses. To the best of our knowledge, this study is the first description of the use of PEI/FS for FFA-based diagnosis. These smart nanosized fluorescent contrast agents hold great potential for the clinical FFA diagnoses, therapy and research work.
Materials & methods
Materials
Branched PEI (Mw = 25,000), N-hydroxysuccinimide (NHS) and 1-ethyl-3-(3-dimethylaminopropy) carbodiimide hydrochloride (EDC.HCl) were obtained from Sigma-Aldrich (MO, USA). FS was obtained from Baiyunshan Mingxing Pharmaceutical Co. Ltd, Guangzhou, China. Human retinal pigment epithelium cell lines (ARPE-19) were obtained from iCell Bioscience Company (Shanghai, China). Human umbilical vein endothelial cells (HUVECs), endothelial cell medium and endothelial cell growth supplement were purchased from ScienCell (CA, USA). We purchased DMEM/F12 cell medium and fetal bovine serum from HyClone (UT, USA). Cell counting kit (CCK)-8 was purchased from Yeasen (Shanghai, China), and the Annexin V-FITC Apoptosis Detection Kit and the Matrigel™ Basement Membrane Matrix were obtained from BD Biosciences (CA, USA). Brown Norway rats were purchased from Beijing Vital River Laboratory Animal Technology Co., Ltd (Beijing, China).
Synthesis of PEI–NHAc–FS
FS (200 mg in 1 ml of water) and 10 molar equivalents of the EDC.HCl were added to the mixture and stirred for 30 min, followed by the addition of 10 molar equivalents of the NHS and stirring for another 3 h to produce an orange solution. Next, this solution was added into the PEI (380 mg, 5 ml of water) under vigorous stirring for 3 days to obtain PEI–NH2–FS. Afterward, PEI–NH2–FS was acetylated using the methods described below. Briefly, triethylamine (2 ml) was added to the raw solution of the PEI–NH2–FS. After 30 min, a fivefold molar excess of acetic anhydride (1 ml) to the remaining primary amines in PEI was added to the mixture and stirred for 24 h. Then, the mixture was extensively dialyzed against phosphate-buffered solution (PBS; nine-times, 2L) for 3 days and PEI–NHAc–FS was subsequently lyophilized.
Characterization
Ultraviolet–visible (UV–Vis) spectroscopy was performed to characterize the structure of our synthesized NPs to verify the conjugation of these groups. We used a Lambda 25 UV–Vis spectrophotometer (PerkinElmer, MA, USA) to carry out the experiments. 1H NMR spectra were recorded to observe the structure of PEI–NHAc–FS using a Bruker AV400 nuclear magnetic resonance spectrometer (Karlsruhe, Germany). Thermogravimetric analysis was conducted using a TG 209 F1 (NETZSCH Instruments Co., Ltd, Germany) thermogravimetric analyzer to detect the thermal stability and components, and the temperature was increased at a rate of 20°C/min. The Malvern Zetasizer (ZEN3600 Nano ZS, Worcestershire, UK) was applied to measure zeta potential (ZP) and dynamic light scattering at a wavelength of 633 nm, which was used to evaluate the surface potential and hydrodynamic size of the NPs. Fourier transform infrared (FTIR) spectra were recorded using a Nicolet iS10 FTIR spectrometer (Thermo Fisher Scientific, CA, USA) at the range of 4000–400 cm-1. Excitation-emission matrix (EEM) fluorescence spectroscopy was used to examine fluorescence intensity of FS, PEI–NH2–FS and PEI–NHAc–FS (Ex = 230–500 nm).
Cell culture
ARPE-19 cells and HUVECs were cultured in DMEM/F12 and endothelial cell medium supplemented with fetal bovine serum, penicillin and streptomycin, respectively. The cells displaying good morphology and growth status were used in our subsequent experiments and incubated at 37°C in 5% CO2–air.
Cell viability assay
The CCK-8 (Yeasen, Shanghai, China) was used to evaluate the cell viability. ARPE-19 cells and HUVECs were separately seeded in 96-well plates (5000 cells/well) and incubated overnight for adhesion. FS and PEI–NHAc–FS in increasing micromolar concentrations (0–10 μM) were added to each well and were incubated for 12 and 24 h. Next, cell viability was analyzed spectrophotometrically at 450 nm after an incubation with 10 μl of CCK-8 reagent for 2 h; the absorbance is proportional to the number of living, metabolically active cells.
Light, fluorescence & confocal microscopy
ARPE-19 cells and HUVECs were seeded 105/well in 12-well plates. The cells were treated with various concentrations of FS and PEI–NHAc–FS (1.0, 2.5, 5.0, 7.5, 10 μM) for 12 and 24 h. Subsequently, the drug-containing medium was removed at each time point, and the cells were washed twice with 1× PBS. The cell morphology and fluorescence images were captured via a fluorescence microscope.
ARPE-19 cells growing on slides were treated as described above. Then, the cell slides were fixed in 4% paraformaldehyde for 20 min, and washed twice with 1× PBS. Next, 4,6-diamidino-2-phenylindole (diluted 1:1000 in 1× PBS) was incubated with the cells for 20 min to visualize cell nuclei in a dark place. Finally, the slides were coverslipped and cells were visualized under a confocal microscope (LSM710; Carl Zeiss, Jena, Germany).
Flow cytometry assay for cell apoptosis
ARPE-19 cells and HUVECs were treated with either FS or PEI–NHAc–FS (1.0, 2.5, 5.0, 7.5, 10.0 μM) for 24 h. Afterward, the cells were subsequently washed with PBS, and then stained with an Annexin V-FITC Apoptosis Detection Kit was used to stain. The results were recorded using a FACSCanto II flow cytometer (BD).
Comet assay
First, 1.0% normal melting point agarose was placed on the glass slide. Cells treated with NPs were resuspended in 1× PBS, and then 150 μl of cell suspensions was mixed with 200 μl of 1% low-melting point agarose. The mixture was placed on the 1.0% normal melting point agarose and allowed to solidify at 4°C. Then, the slides were immersed in the lysis solution for 6 h at 4°C. The slides were incubated with neutral unwinding solution for 30 min to unwind the DNA, and then, electrophoresis was performed at 20 V for 30 min in the same solution. After neutralization with cold deionized water, the gels were stained with 1× SYBR Green dye for 20 min in the dark. Images were recorded via fluorescence microscope.
In vitro cellular uptake
ARPE-19 cells and HUVECs were separately cultured in a 12-well plate (105 cells/well) to achieve confluence. Various concentrations of FS and PEI–NHAc–FS (1.0, 2.5, 5.0, 7.5, 10.0 μM) were added to incubate for another 24 h. Then, cells were subsequently collected and washed by PBS. Cellular uptake was observed with flow cytometer equipped with a 488 nm argon-ion laser.
Tube formation assay
Matrigel was coated on 96-well plates at 37°C for 30 min for solidification, and 5 × 10³ HUVECs seeded into each well in 100 μl of medium containing with different concentrations of PEI–NHAc–FS. Images of tube formation were recorded using a light microscope after a 6-h incubation.
Laser-induced CNV in rats
All animals received were cared for in strict accordance with the Association for Research in Vision and Ophthalmology Statement for the use of animals in vision and ophthalmic research and the Shanghai Tenth People’s Hospital Guidelines for the Use of Animals in Research. Brown Norway rats (6–8 w, 180–200 g, male) were used to establish CNV models, and laser photocoagulation-induced CNV models were established as previously described [Citation32]. Intraperitoneal injection of 1% pentobarbital sodium (40 mg/kg, Sigma-Aldrich) was used to anesthetize the animals, a topical application of 0.5% tropicamide (Mydrin-P, Santen Pharmaceutical Co., Osaka, Japan) was used to dilate the pupil, and 0.5% Alcaine (Alcon [China] Ophthalmic Product Co., Beijing, China) was used to anesthetize the ocular surface. After lubricating the cornea, photocoagulation was performed using a 532-nm wavelength laser and the laser burn was performed at 360 mW intensity, 0.1 s duration and 50 μm spot size. In total, 6–8 laser spots were generated between each main retinal vessel at approximately the same distance to the optic nerve head. Bubbles or slight hemorrhage indicated a rupture in the Bruch’s membrane and the successful establishment of the laser photocoagulation-induced CNV rat models.
Fundus photography & fluorescein angiography
Fundus photography was initially performed after the anesthetization of rats and dilation of pupils, and then 0.5, 1.0 and 5.0% FS and PEI–NHAc–FS were applied via tail intravenous injection. Fluorescein images were captured at different time points after administration, including 5, 20, 30 and 60 min.
Fluorescence-frozen section
The rats were sacrificed 10, 20, 30 and 60 min after intravenous injection of 1% free FS and PEI–NHAc–FS NPs via the tail vein. Next, the eyes were extracted and sectioned at a thickness of 5 μm using a cryostat. Fluorescence microscope was employed to capture the images.
Electroretinogram
Electroretinograms (ERGs) were recorded at 28 days after an intravenous injection of 1% PEI–NHAc–FS via the tail vein. Rats were dark-adapted for 16 h before the ERG examination and were deeply anesthetized with an intraperitoneal injection of sodium pentobarbital (40 mg/kg) and an intramuscular injection of xylazine (6 mg/kg). Reference, ground and gold ring contact electrodes were placed in rats’ noses, tails and corneas, respectively. A light emitting diode (LED) lamp was applied to transmit a single light-flash stimulus (3000 cd/m2 for 10 ms) through the corneal electrode.
Hematoxylin-Eosin (H&E) staining
28 days after the 1% PEI–NHAc–FS injection, the rats were sacrificed. Next, the heart, spleen, kidney, liver, brain and muscle were extracted and fixed with 4% paraformaldehyde. The organs were embedded, sectioned and stained with H&E using a standard procedure. Neutral gum was used to mount with the sections, and images were captured using a light microscope.
Terminal dUPT nick-end labeling (TUNEL) assay
The paraffin-embedded organs were sectioned as described in a previous study. Xylene was used to dewax the sections and different concentrations of ethyl alcohol were used for rehydration. After an incubation with Proteinase K, a mixture of terminal deoxynucleotidyl transferase and fluorescein-labeled dUTP was used to incubate the sections according to the manufacturer’s protocol. Images were acquired using a fluorescence microscope.
Statistical analysis
SPSS 19.0 software and Graph Pad Prism version 5 software were used to conduct the statistical analyses. One-way analysis of variance was performed among multiple groups. p-values less than 0.05 were considered to be statistically significant.
Results
Preparation & characterization of the PEI–NHAc–FS
PEI was designed as the carrier and conjugated with FS, followed by acetylation of the remaining amine groups of PEI to form PEI–NHAc–FS NPs for FFA. The method used to prepare the PEI–NHAc–FS NPs is shown in . The synthesized PEI–NHAc–FS NPs were well-characterized via different techniques. The hydrodynamic size and surface ZP of the PEI–NHAc–FS were first determined (). PEI and PEI–NH2–FS were also characterized for comparison. Due to the formation of particle clusters, the PEI–NHAc–FS displayed a much larger hydrodynamic size (181.33 ± 88.02 nm) than that of the PEI (16.14 ± 2.16 nm) and PEI–NH2–FS NPs (42.26 ± 15.25 nm). In the present study, the ZP of PEI–NH2–FS and PEI–NHAc–FS are 2.32 and 0.05 mV, respectively. As shown in A, FS is successfully coupled onto the PEI surface, as determined using NMR. The FTIR spectra (B) show absorbance peaks at wavenumbers 1633.38, 756.76, 699.97 and 1573.00, 1389.09 and 885.94 and 842.08 cm-1 indicate the absorbance peaks of benzene ring and -COO- and isolated aromatic C–H groups, respectively. Absorbance peaks with the wavenumbers of 1455.49, 2811.55 and 1576.97 cm-1 shown in B indicate the absorbance peaks of the radical of -CH2- and -NH2 in PEI, respectively. Meanwhile, new absorption peaks at approximately 1625.58, 1165.21 and 1262.43 cm-1 indicate the formation of an amide bond in the synthesized PEI–NH2–FS NPs. To further confirm the ratio between PEI and FS, thermogravimetric analysis examination was carried out (C), and the weight percentage of FS, PEI, PEI–NH2–FS NPs and PEI–NHAc–FS NPs were calculated as 51.83, 0.31, 12.98 and 3.66%, respectively.
FS: Fluorescein sodium; NP: Nanoparticle; PEI: Polyethyleneimine.
(A) 1H NMR spectrum, (B) Fourier transform infrared spectrum and (C) differential thermal/thermogravimetric analysis of fluorescein sodium (FS) (1), polyethyleneimine (PEI) (2), PEI–NH2–FS nanoparticles (3) and PEI–NHAc–FS nanoparticles (4), respectively.
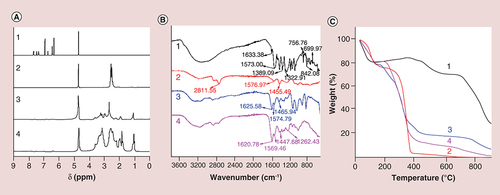
Table 1. Mean particle size and zeta potential of PEI–NHAc–FS.
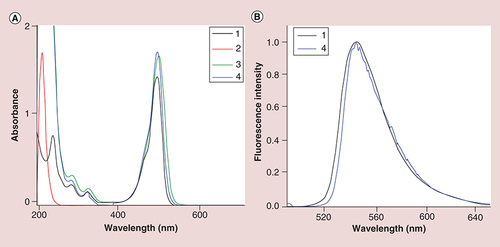
As shown in A, the FS unit was successfully coupled onto the surface of PEI by the characterization of UV–Vis spectroscopy, and there are nearly no obvious difference of surface plasmon resonance peak among FS, PEI–NH2–FS NPs and PEI–NHAc–FS NPs. In B, the emission fluorescence spectra show that the maximum emission wavelength of FS and PEI–NHAc–FS NPs (λex = 490 nm) appears at approximately 546 and 544 nm, respectively.
UV-Vis spectrum (A) and excitation-emission matrix fluorescence spectrum (B) of fluorescein sodium (FS) (1), polyethyleneimine (PEI) (2), PEI–NH2–FS NPs (3) and PEI–NHAc–FS NPs (4), respectively.
Cytotoxicity, apoptosis, genotoxicity, morphology & tube formation
The CCK-8 cell viability assay was used to evaluate cytotoxicity. The results showed that ARPE-19 cells (A & B) and HUVECs (Supplementary Figure 1A & B) treated with FS and PEI–NHAc–FS NPs at the FS concentration ranging from 0 to 10 μM displayed similar viability, and no significant difference was observed in cell viability after 24 h incubation. Meanwhile, the apoptosis rates in ARPE-19 cells treated with different concentrations of PEI–NHAc–FS NPs (0, 5, 10 μM) were 2.10 ± 1.22%, 2.00 ± 1.18% and 2.23 ± 1.50% (D & E), respectively, and the apoptosis rates in HUVECs were 4.27 ± 0.76%, 4.63 ± 0.49% and 4.40 ± 0.87% (Supplementary Figure 1D & E), respectively. Therefore, no significant difference was observed in treated or untreated cells. Meanwhile, no genotoxicity was observed after the NPs incubation (Supplementary Figure 2).
(A) CCK-8 assay of ARPE-19 cells treated with FS and (B) PEI–NHAc–FS nanoparticles at different FS concentrations for 12 and 24 h. (C) Morphological images of ARPE-19 cells treated with 0, 2.5, 5, 7.5, 10 μM FS and PEI–NHAc–FS nanoparticles for 24 h. (Scale bar: 200 μm). (D) Cell apoptosis was detected by Annexin V/PI staining. (E) Statistical analysis of cells rate (%).
FITC: Fluorescein isothiocyanate; FS: Fluorescein sodium; PEI: Polyethyleneimine; PI: Propidium Iodide.
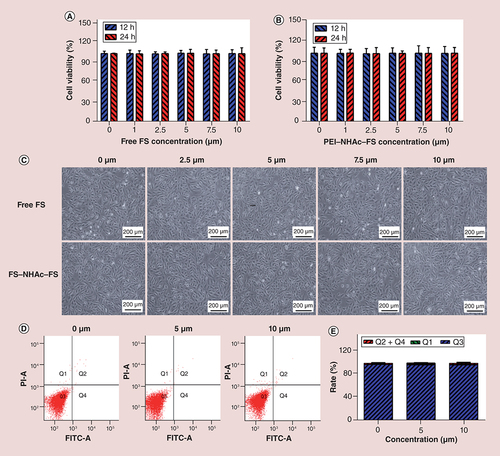
Furthermore, no obvious morphological changes in cells were observed, even after treatment with 10 μM FS, and the cells exhibited an endothelial cobblestone-like morphology (C & Supplementary Figure 1C). In addition, after a 24-h treatment with PEI–NHAc–FS NPs for 24 h, no significant difference in endothelial tube formation of cells was observed between groups (Supplementary Figure 3).
Cellular uptake assays
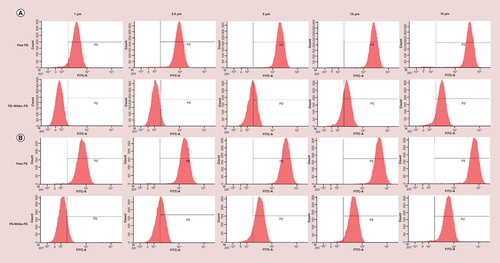
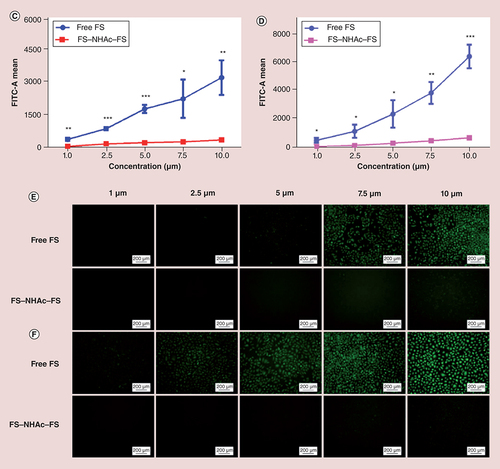
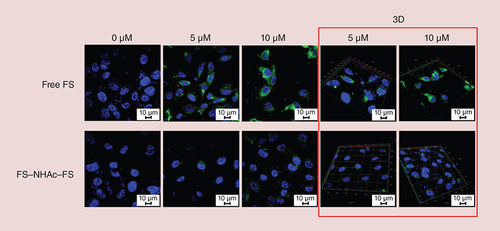
The detected concentrations ranged from 0 to 10 μM, and the time points were 12 and 24 h, respectively. As shown in Supplementary Figure 4A, after HUVECs were incubated with PEI–NHAc–FS NPs and FS for 12 h (FS concentration was 10 μM), the fluorescence intensity of PEI–NHAc–FS NPs and free FS was 436.33 ± 84.91 and 4769.67 ± 647.27 (p < 0.001), respectively. When the incubation time was extended to 24 h (Supplementary Figure 4B), the fluorescence intensity of PEI–NHAc–FS NPs and free FS was 708.67 ± 265.42 and 6820.33 ± 777.2, respectively. Meanwhile, E and Supplementary Figure 4E also confirm the above conclusion from flow cytometry that the fluorescence increases in a concentration-dependent manner and time-dependent manner. Confocal microscopy was also employed to observe the fluorescence intensity and location of FS and PEI–NHAc–FS NPs in cells. In , a higher fluorescence intensity of FS was observed in ARPE-19 cells after a 24-h treatment than in the PEI–NHAc–FS NP-treated group. In addition, 3D images were also captured and more clearly showed that our current contrast agents were readily taken up by cells.
Fluorescence intensity was detected by flow cytometry with a 488-nm Argon-ion laser for the incubation of ARPE-19 cells with free FS and polyethyleneimine–NHAc–FS nanoparticles for (A) 12 h or (B) 24 h at different FS concentration. Statistical analysis of FITC-A mean in varying concentrations of FS and PEI–NHAc–FS in ARPE-19 cells for (C) 12 h and (D) 24 h. Fluorescence images were recorded for the incubation of ARPE-19 cells with free FS and polyethyleneimine–NHAc–FS nanoparticles at different FS concentration for (E) 12 h and (F) 24 h. Scale bar: 200 μm.
FITC: Fluorescein isothiocyanate; FS: Fluorescein sodium.
Scale bar: 10 μm.
FS: Fluorescein sodium.
In vivo fluorescence imaging & diagnosis
As shown in A, the FFA images were recorded at different time points after intravenous injection of 0.5% free FS or 0.5% PEI–NHAc–FS NPs (200 μl, FS for 5 mg/kg), respectively. The retinal microvessels were not clearly detected in the free FS and PEI–NHAc–FS NP groups, and only images of the main retinal vessels were recorded in both groups, indicating that 0.5% FS is too low to be used for an FFA-based diagnosis.
Fundus angiography images by at autofluorescence mode and different time points postintravenous injection of free FS or PEI–NHAc–FS nanoparticles at different FS concentration ([A] 0.5%, [B] 1% and [C] 5%).
FS: Fluorescein sodium; PEI: Polyethyleneimine.
![Figure 7. In vivo fluorescence imaging of different agents was detected by fundus angiography.Fundus angiography images by at autofluorescence mode and different time points postintravenous injection of free FS or PEI–NHAc–FS nanoparticles at different FS concentration ([A] 0.5%, [B] 1% and [C] 5%).FS: Fluorescein sodium; PEI: Polyethyleneimine.](/cms/asset/fee25ec2-0f5b-469d-8986-bfde713494f4/innm_a_12341533_f0008.jpg)
Then, we increased the FS concentration up to 1%, free FS and PEI–NHAc–FS NPs (200 μl, FS for 10 mg/kg) were intravenously injected, respectively. Fortunately, both the main retinal vessels and retinal microvessels were filled with contrast agents and displayed sufficiently bright fluorescence to clearly show the structures of retinal vessels in each group. Meanwhile, the fluorescence intensity of vessels in both the free FS and PEI–NHAc–FS NPs groups was approximately the same up to 30 min after injection, which is sufficient for clinicians to record and make an accurate diagnosis using FFA. More importantly, the retinal microvessels of PEI–NHAc–FS NPs group with 1% FS concentration were not detected by FFA at 60 min, while the free FS groups treated with the same FS concentration maintained a stronger fluorescence intensity (B).
We also increased the FS concentration in the free FS and PEI–NHAc–FS NPs to 5% (200 μl, 50 mg/kg FS) to confirm the diagnostic effect of a higher FS concentration using FFA, and the results are shown in C. The intensity of the 5% PEI–NHAc–FS NPs gradually decreased at 30 min after intravenous injection, respectively, while the intensity of FS was maintained in the retinal vessels for up to 60 min.
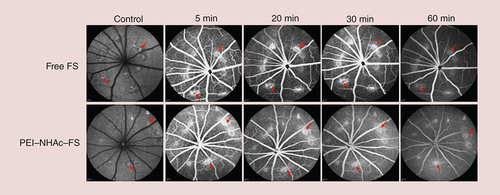
Laser photocoagulation-induced CNV rat models were successfully established 28 days after the laser burn and were used for FFA diagnostic imaging with PEI–NHAc–FS NPs in vivo. As shown in , the fluorescence intensity was detected in the main retinal vessels and retinal microvessels, and confirmed the presence of leakages in other regions after an intravenous injection of 1% free FS and 1% PEI–NHAc–FS NPs (200 μl, 10 mg/kg FS) at different time points (5, 20, 30, 60 min).
FS: Fluorescein sodium; PEI: Polyethyleneimine.
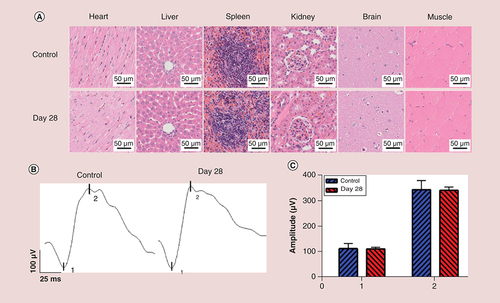
(A) Histomorphological images of heart, liver, spleen, kidney, brain and muscle after intravenous injection of polyethyleneimine–NHAc–fluorescein sodium nanoparticles (1% fluorescein sodium concentration) after 28 days. Scale bar: 50 μm. (B) The retinal function was measured postintravenous injection of polyethyleneimine–NHAc–fluorescein sodium nanoparticles (1% fluorescein sodium concentration) via electroretinogram. (C) Statistical analysis of the mean amplitudes of the 1 (a-wave) and 2 (b-wave).
In addition, fluorescence images of frozen sections were fabricated at 10, 20, 30 and 60 min after intravenous injection of 1% FS and 1% PEI–NHAc–FS NPs, respectively. In Supplementary Figure 5, free FS showed strong adsorption and permeation to the retinal layers with evident fluorescence, while PEI–NHAc–FS NPs exhibited minimal fluorescence in the retinal tissues.
In vivo analysis of biosecurity using H&E staining, TUNEL assay & ERG
As shown in A and Supplementary Figure 6, H&E and TUNEL staining were performed on the major organs from rats to observe the biosecurity after intravenous injection of particles for 28 days in vivo. We observed histomorphological changes and apoptotic cells in the heart, liver, spleen, kidney, brain and muscle, and no histological damage was observed in these organs.
ERG is normally used as a measure of retinal function for FFA extensively. As shown in B and C, the amplitude of the a-wave for 1% PEI–NHAc–FS NPs was 111.00 ± 6.94 μV, while the value for the PBS control group was 112.63 ± 20.45 μV at 28 days after intravenous injection. Meanwhile, the amplitude of the b-wave for PEI–NHAc–FS NPs was 341.47 ± 13.07 μV, while the value for the PBS control group is 343.42 ± 36.23 μV.
Discussion
This study aimed at overcoming the limitations of long retention time of single FS as clinical contrast agent for FFA. FS and PEI were developed according to NHS/EDC cross-linking reaction as previously reported [Citation30]. Then, we evaluated the effects of PEI–NHAc–FS NPs on optical performance as well as cellular uptake compared with free FS both in vitro and in vivo. In addition, the required fabrication process was relatively simple, mature and reproducible, which held great potential for clinical translation.
As previously reported, PEI was widely promoted for imaging and drug delivery, confirming its promise as a nanocarrier. Li et al. reported PEI modified with polyethylene glycol and Au was used as contrast agent for MR and CT imaging of liver [Citation33]. We used PEI modified with fluorescent groups as the contrast agent for imaging fundus blood vessels. FS was a water-soluble fluorescent dye used in our studies, which was widely used as a fluorescent tracer in medicinal and biological applications [Citation34]. In our present work, PEI was conjugated with FS, followed by acetylation of the amine groups to synthesize PEI–NHAc–FS NPs. In , a hydrodynamic size assay revealed the larger hydrodynamic size of PEI–NHAc–FS NPs. Notably, the FS modification further increased the hydrodynamic size of the PEI–NHAc–FS NPs compared with PEI. A potential explanation was that the FS modification might slightly enhance the interparticle interactions to form larger particle clusters in aqueous solutions. Due to the presence of the amidogen on the surface of PEI, PEI–NH2–FS was the cellular cytotoxicity which restricted its application [Citation35]. The ZP of PEI–NHAc–FS was successfully decreased after acetylation, rendering it safe for our subsequent biological experiments. Based on the NMR and DTA-TG spectra, FS was successfully conjugated onto the PEI surface (). The surface plasmon resonance peaks of FS, PEI–NH2–FS NPs and PEI–NHAc–FS NPs were similar, as shown in the UV–Vis spectra. The emission fluorescence spectra indicated little change in the fluorescence properties of FS after the modification of PEI and acetylation (). These results confirmed that the PEI–NHAc–FS NPs were successfully synthesized.
The potential toxicity of NPs is a major concern that needs further investigation prior to application in human [Citation36]. Emerging studies suggest that NPs have good biocompatibility for CT/MR imaging both in vitro and in vivo [Citation37,Citation38]. As previously reported, many experiments have been used to detect the cellular toxicity, including cell viability, morphology, Annexin V-FITC apoptosis detection, genotoxicity and tube formation assays [Citation39,Citation40]. At least two experiments need to be performed for toxicity testing to enable the verification of our results. ARPE-19 and HUVECs were used to determine the cytotoxicity of FS and PEI–NHAc–FS NPs. In particular, HUVECs have been widely used to determine the cytotoxicity of NPs [Citation41]. As shown in and Supplementary Figure 1, no significant difference in cell viability was observed after NP treatments due to the acetylation of amidogen. The morphological images of two cells revealed no dramatic morphological changes in the tested concentration range. Zhou et al. demonstrated that PEI-entrapped AuNPs were noncytotoxic in a given concentration range, which was consistent with our present results [Citation29]. Comet assay was commonly performed to detect the genotoxicity [Citation42]. Previous studies found that positively charged PEI could interact with negatively charged biotargets such as DNA, inducing genotoxicity, which was mainly due to the amines [Citation43,Citation44]. However, Calarco et al. elucidated that the acetylation of PEI could significantly reduce genotoxicity and improve biocompatibility, which further improved PEI tolerability [Citation45]. Our results provided evidence that no toxicogenomic damage was observed in Supplementary Figure 2. Furthermore, HUVECs were common cell models in assessment of vascular toxicity in vitro, especially in assessing contrast agents [Citation46]. The results in Supplementary Figure 3 confirmed the formed tube-like structures were not damaged after incubation. In a nutshell, the PEI–NHAc–FS NPs displayed good cytocompatibility in vitro and were considered as safe contrast agents.
Another vital key point is to consider how to reduce the retention and promote the metabolism of contrast agents in patient’s body. FS is a small-molecule product that shows high cellular uptake after exposure. Novel FFA contrast agents are synthesized to reduce the retention of FS in bioapplications. The fluorescence intensity was assessed in vitro by three different experiments including flow cytometry, fluorescence microscopy and confocal microscopy. Khalid et al. modified surface hydrophobicity to resist the cell adhesion [Citation16]. Lo et al. elucidated that physically synthesized AuNPs could reduce cell migration and adhesion via influencing tyrosine-protein activation [Citation17]. In our work, the results provided evidence that PEI–NHAc–FS NPs effectively reduced the cellular uptake compared with free FS in a concentration-dependent manner, which was consistent with previous study ( & ; Supplementary Figure 4). Cai et al. demonstrated that Fe3O4–PEI NPs could significantly reduce cellular uptake due to acetylation of amines on the surface [Citation47].
In clinical diagnosis, 3 ml of 20% FS solution (quality percentage of FS, similarly described hereafter) is normally used for FFA to ensure a diagnostic effect [Citation48]. However, FS concentration 20% is quite a high injection concentration, which will be metabolized for a long time. The development of methods to ensure effective FFA imaging at lower FS concentrations with a much better metabolic rate remains a substantial challenge. In this study, three gradient FS concentrations (0.5, 1 and 5%) of free FS and PEI–NHAc–FS NPs were systematically investigated. Of which, the application of 1% free FS and PEI–NHAc–FS NPs clearly revealed the structures of retinal vessels within 30 min, but the PEI–NHAc–FS NPs were cleared more rapidly than free FS, indicating that the FS in PEI–NHAc–FS NPs was more readily metabolized by vessels than free FS (). The results kept the same with the cellular uptake assay in vitro, mainly due to the reduction of cell adhesion. Laser photocoagulation-induced rat models were commonly used in age-related macular degeneration research. The CNV leakages could be detected by FFA and indocyanine green angiography [Citation49]. The designed PEI–NHAc–FS NPs were useful tools to accurately and effectively diagnose CNV leakages and reduce the duration of fluorescent contrast agent exposure in fundus vessels, as shown in .
In general, since the contrast agents pass through systemic circulation after intravenous injection, the biosecurity of related organs should be taken into consideration. Nguyen et al. reported that H&E staining and TUNEL staining were employed to evaluate the toxicity of organs [Citation50]. The results in showed normal cellular and tissue morphology after intravenous injection, indicating the biosafety in systematic application. Furthermore, ERG was usually performed to evaluate the retinal function. The a-wave was the negative wave which reflected the electrical activities of photoreceptors, while b-wave was positive wave reflecting the Müller cells and bipolar cells [Citation51]. No significant changes in the a-waves and b-waves were observed after the intravenous injection.
Conclusion
In the present study, PEI was designed as a powerful carrier conjugated with FS to synthesize PEI–NHAc–FS NPs for fundus angiography. The developed PEI–NHAc–FS NPs were not cytotoxic and did not induce changes in apoptosis or tube formation changes in the studied concentration range in vitro. Meanwhile, the formed PEI–NHAc–FS NPs showed similar fluorescence properties to those of free FS at the same FS concentration both in vitro and in vivo. More importantly, the designed PEI–NHAc–FS NPs effectively detected both the main retinal vessels and retinal microvessels and confirmed the existence of leakages in vivo. In addition, PEI promoted the metabolism of contrast agents, and reduced the osmosis and adsorption of FS in ocular vessels, with no damage to the functions of the retina and main tissues in vivo. Overall, the smart PEI–NHAc–FS NPs, which have good fluorescence imaging properties and are prepared using a simple method, hold great potential for widely usage in FFA diagnosis.
Future perspective
The current study described the successful synthesis of PEI–NHAc–FS NPs and demonstrated the good cytocompatibility and reduced cellular uptake both in vitro and in vivo. In addition, the designed PEI–NHAc–FS NPs effectively distinguished normal retinal vessels and CNV leakages without influencing optical performance. In the future, due to the multifunctional structure and properties of NPs, we will further design the therapeutic NPs in the treatment of CNV. Since the position of CNV leakages, the way of drug delivery such as regional or systemic way should be taken into consideration. What is more, we will also modify the targeted groups such as Arg–Gly–Asp peptide (RGD) to achieve the targeted therapy of CNV.
Fluorescein sodium (FS) is a water-soluble fluorescent dye that has been widely used in fundus fluorescein angiography.
FS produces some adverse reactions, such as nausea and vomiting, as well as more severe side effects, such as anaphylaxis.
In the clinic, FS easily attaches to the cell surface and is not readily metabolized in the patient’s body, even at 48 h after the injection.
Here, we report for the first time the synthesis of polyethyleneimine (PEI)-NHAc-FS nanoparticles (NPs), a smart nanosized fluorescence contrast agent with good optical performance and cytocompatibility.
PEI–NHAc–FS NPs were fabricated and characterized in terms of size, zeta potential, fluorescence and stability.
The optical performance of PEI–NHAc–FS NPs in distinguishing normal retinal vessels and choroidal neovascularization leakages in choroidal neovascularization rat models was similar to that of free FS.
Good cytocompatibility was confirmed in two cell lines, and the NPs did not alter cell viability, apoptosis, morphology or endothelial cell tube formation in vitro. PEI–NHAc–FS NPs did not damage the histomorphology of the retina and organs in vivo.
PEI–NHAc–FS NPs exhibited lower cellular adsorption and uptake both in vitro and in vivo, which might enhance the metabolism of PEI–NHAc–FS NPs in ocular vessels.
Author contributions
W Cai and M Chen synthesized the nanoparticles and wrote the manuscript. J Fan and H Jin finished the in vitro experiments. D Yu and S Qiang performed the in vivo experiments. C Peng and J Yu conducted the experiments.
Ethical conduct of research
All animals received were cared for in strict accordance with the Association for Research in Vision and Ophthalmology Statement for the use of animals in vision and ophthalmic research and the Shanghai Tenth People's Hospital Guidelines for the Use of Animals in Research. The authors state that they have obtained appropriate institutional review board approval or have followed the principles outlined in the Declaration of Helsinki for all human or animal experimental investigations
Supplemental Text 1
Download PDF (924.9 KB)Supplementary data
To view the supplementary data that accompany this paper please visit the journal website at:www.tandfonline.com/doi/full/10.2217/epi-2016-0184
Financial & competing interests disclosure
This study was financially supported by the National Natural Science Foundation of China in 2014 (project number: 81470648) and was also supported by the Fundamental Research Funds for the Central Universities (project number: 22120180509;22120180532). The authors have no other relevant affiliations or financial involvement with any organization or entity with a financial interest in or financial conflict with the subject matter or materials discussed in the manuscript apart from those disclosed.
Writing support was provided by American Journal Experts and was funded by Fundamental Research Funds for the Central Universities (project number: 22120180509).
References
- Yehoshua Z , deAmorim Garcia Filho CA , NunesRPet al. Comparison of geographic atrophy growth rates using different imaging modalities in the COMPLETE study. Ophthalmic Surg. Lasers Imaging Retina46(4), 413–422 (2015).
- Wang X , LiS , LiW , HuaY , WuQ. Choroidal variations in diabetic macular edema: fluorescein angiography and optical coherence tomography. Curr. Eye. Res.43(1), 102–108 (2018).
- Marcucci R , SofiF , GrifoniE , SodiA , PriscoD. Retinal vein occlusions: a review for the internist. Intern. Emerg. Med.6(4), 307–314 (2011).
- Xiang Y , ZhuXP , ZhaoJNet al. Blood–brain barrier disruption, sodium fluorescein, and fluorescence-guided surgery of gliomas. Br. J. Neurosurg.32(2), 141–148 (2018).
- Acerbi F , BroggiM , SchebeschKMet al. Fluorescein-guided surgery for resection of high-grade gliomas: a multicentric prospective Phase II Study (FLUOGLIO). Clin. Cancer Res.24(1), 52–61 (2018).
- Schebesch KM , HoehneJ , HohenbergerCet al. Fluorescein sodium-guided surgery in cerebral lymphoma. Clin. Neurol. Neurosurg.139, 125–128 (2015).
- Xu K , TzankovaV , LiC , SharmaS. Intravenous fluorescein angiography-associated adverse reactions. Can. J. Ophthalmol.51(5), 321–325 (2016).
- Su ZA , ZhangLX , TengY. Adverse reactions during fluorescence fundus angiography in special patients. Zhonghua. Yi. Xue. Za. Zhi.89(21), 1490–1492 (2009).
- Kwiterovich KA , MaguireMG , MurphyRPet al. Frequency of adverse systemic reactions after fluorescein angiography. Results of a prospective study. Ophthalmology 98(7), 1139–1142 (1991).
- Karhunen U , RaittaC , KalaR. Adverse reactions to fluorescein angiography. Acta. Ophthalmol.64(3), 282–286 (1986).
- Marcus DF , BovinoJA , WilliamsD. Adverse reactions during intravenous fluorescein angiography. Arch. Ophthalmol.102(6), 825 (1984).
- Bearelly S , RaoS , FekratS. Anaphylaxis following intravenous fluorescein angiography in a vitreoretinal clinic: report of 4 cases. Can. J. Ophthalmol.44(4), 444–445 (2009).
- Ha SO , KimDY , SohnCH , LimKS. Anaphylaxis caused by intravenous fluorescein: clinical characteristics and review of literature. Intern. Emerg. Med.9(3), 325–330 (2014).
- Lee T , SandersonD , DoyleP , BuchsbaumG. Anaphylactic shock after intravenous fluorescein administration for intraoperative cystoscopy. Obstet. Gynecol.131(4), 727–772 (2018).
- Trindade-Porto C , Alonso-LlamazaresA , RobledoTet al. Fluorescein-induced adverse reaction. Allergy54(11), 1230 (1999).
- Khalid HF , TehseenB , SarwarYet al. Biosurfactant coated silver and iron oxide nanoparticles with enhanced anti-biofilm and anti-adhesive properties. J. Hazard Mater.364, 441–448 (2018).
- Lo HM , MaMC , ShiehJM , ChenHL , WuWB. Naked physically synthesized gold nanoparticles affect migration, mitochondrial activity, and proliferation of vascular smooth muscle cells. Int. J. Nanomedicine13, 3163–3176 (2018).
- Ma S , ZhanX , YangM , LanF , WuY , GuZ. Polyethylene glycol-functionalized magnetic Fe3O4/P(MMA-AA) composite nanoparticles enhancing efficient capture of circulating tumor cells. J. Nanosci. Nanotechnol.18(4), 2278–2285 (2018).
- McMasters J , PanitchA. Collagen-binding nanoparticles for extracellular anti-inflammatory peptide delivery decrease platelet activation, promote endothelial migration, and suppress inflammation. Acta. Biomater.49, 78–88 (2017).
- Schulze J , KuhnS , HendrikxS , Schulz-SiegmundM , PolteT , AignerA. Spray-dried nanoparticle-in-microparticle delivery systems (NiMDS) for gene delivery, comprising polyethylenimine (PEI)-based nanoparticles in a poly(vinyl alcohol) matrix. Small14(12), e1701810 (2018).
- Okuda T , MorishitaM , MizutaniK , ShibayamaA , OkazakiM , OkamotoH. Development of spray-freeze-dried siRNA/PEI powder for inhalation with high aerosol performance and strong pulmonary gene silencing activity. J. Control. Rel.279, 99–113 (2018).
- Lee MC , SeonwooH , GargPet al. Chitosan/PEI patch releasing EGF and the EGFR gene for the regeneration of the tympanic membrane after perforation. Biomater. Sci.6(2), 364–371 (2018).
- Sun W , WangY , CaiMet al. Codelivery of sorafenib and GPC3 siRNA with PEI-modified liposomes for hepatoma therapy. Biomater. Sci.5(12), 2468–2479 (2017).
- Kong L , QiuJ , SunWet al. Multifunctional PEI-entrapped gold nanoparticles enable efficient delivery of therapeutic siRNA into glioblastoma cells. Biomater. Sci.5(2), 258–266 (2017).
- Bao X , WangW , WangCet al. A chitosan-graft-PEI-candesartan conjugate for targeted co-delivery of drug and gene in anti-angiogenesis cancer therapy. Biomaterials35(29), 8450–8466 (2014).
- Zhang Y , WeiC , LvF , LiuT. Real-time imaging tracking of a dual-fluorescent drug-delivery system based on doxorubicin-loaded globin- polyethylenimine nanoparticles for visible tumor therapy. Colloids. Surf. B Biointerfaces170, 163–171 (2018).
- Li N , WangZ , ZhangYet al. Curcumin-loaded redox-responsive mesoporous silica nanoparticles for targeted breast cancer therapy. Artif. Cells. Nanomed. Biotechnol.23, 1–15 (2018).
- Sideratou Z , AgathokleousM , TheodossiouTA , TsiourvasD. Functionalized hyperbranched polyethylenimines as thermosensitive drug delivery nanocarriers with controlled transition temperatures. Biomacromolecules19(2), 315–328 (2018).
- Zhou B , XiongZ , WangPet al. Targeted tumor dual mode CT/MR imaging using multifunctional polyethylenimine-entrapped gold nanoparticles loaded with gadolinium. Drug. Deliv.25(1), 178–186 (2018).
- Zhou B , XiongZ , ZhuJet al. PEGylated polyethylenimine-entrapped gold nanoparticles loaded with gadolinium for dual-mode CT/MR imaging applications. Nanomedicine11(13), 1639–1652 (2016).
- Yang Y , ZhouJ , ShiX , ShaY , WuH. Long-term observation of indirect lymphography using gadolinium-loaded polyethylenimine-entrapped gold nanoparticles as a dual mode CT/MR contrast agent for rabbit lingual sentinel lymph node identification. Acta Otolaryngol.137(2), 207–214 (2017).
- Ren C , ShiH , JiangJet al. The effect of CM082, an oral tyrosine kinase inhibitor, on experimental choroidal neovascularization in rats. J. Ophthalmol.2017, 6145651 (2017).
- Li J , ZhengL , CaiHet al. Facile one-pot synthesis of Fe3O4@Au composite nanoparticles for dual-mode MR/CT imaging applications. ACS. Appl. Mater. Interfaces.5(20), 10357–10366 (2013).
- Negm NA , AbouKana MTH , Abd-ElaalAA , ElwahyAHM. Fluorescein dye derivatives and their nanohybrids: synthesis, characterization and antimicrobial activity. J. Photochem. Photobiol. B.162, 421–433 (2016).
- Roesler S , KochFP , SchmehlTet al. Amphiphilic, low molecular weight poly(ethylene imine) derivatives with enhanced stability for efficient pulmonary gene delivery. J. Gene. Med.13(2), 123–133 (2011).
- Desai N . Challenges in development of nanoparticle-based therapeutics. AAPS J.14(2), 282–295 (2012).
- Sharma KV , BascalZ , KilpatrickHet al. Long-term biocompatibility, imaging appearance and tissue effects associated with delivery of a novel radiopaque embolization bead for image-guided therapy. Biomaterials103, 293–304 (2016).
- Wolfram J , ZhuM , YangYet al. Safety of nanoparticles in medicine. Curr. Drug Targets16(14), 1671–1681 (2015).
- Matuszak J , BaumgartnerJ , ZalogaJet al. Nanoparticles for intravascular applications: physicochemical characterization and cytotoxicity testing. Nanomedicine (Lond).11(6), 597–616 (2016).
- Monteiro-Riviere NA , InmanAO , ZhangLW. Limitations and relative utility of screening assays to assess engineered nanoparticle toxicity in a human cell line. Toxicol. Appl. Pharmacol.234(2), 222–235 (2009).
- Al-Fahdawi MQ , RasedeeA , Al-QubaisiMSet al. Cytotoxicity and physicochemical characterization of iron-manganese-doped sulfated zirconia nanoparticles. Int. J. Nanomedicine10, 5739–5750 (2015).
- Golbamaki A , GolbamakiN , SizochenkoN , RasulevB , LeszczynskiJ , BenfenatiE. Genotoxicity induced by metal oxide nanoparticles: a weight of evidence study and effect of particle surface and electronic properties. Nanotoxicology12(10), 1113–1129 (2018).
- Lv H , ZhangS , WangB , CuiS , YanJ. Toxicity of cationic lipids and cationic polymers in gene delivery. J. Control. Rel.114(1), 100–109 (2006).
- Fischer D , LiY , AhlemeyerB , KrieglsteinJ , KisselT. In vitro cytotoxicity testing of polycations: influence of polymer structure on cell viability and hemolysis. Biomaterials24(7), 1121–1131 (2003).
- Calarco A , BosettiM , MargarucciSet al. The genotoxicity of PEI-based nanoparticles is reduced by acetylation of polyethylenimine amines in human primary cells. Toxicol. Lett.218(1), 10–17 (2013).
- Iwata Y , KlarenWD , LebakkenCS , GrimmFA , RusynI. High-content assay multiplexing for vascular toxicity screening in induced pluripotent stem cell-derived endothelial cells and human umbilical vein endothelial cells. Assay. Drug. Dev. Technol.15(6), 267–279 (2017).
- Cai H , AnX , CuiJet al. Facile hydrothermal synthesis and surface functionalization of polyethyleneimine-coated iron oxide nanoparticles for biomedical applications. ACS. Appl. Mater. Interfaces.5(5), 1722–1731 (2013).
- Talks J , KoshyZ , ChatzinikolasK. Use of optical coherence tomography, fluorescein angiography and indocyanine green angiography in a screening clinic for wet age-related macular degeneration. Br. J. Ophthalmol.91(5), 600–601 (2007).
- Park JR , ChoiW , HongHKet al. Imaging laser-induced choroidal neovascularization in the rodent retina using optical coherence tomography angiography. Invest. Ophthalmol. Vis. Sci.57(9), OCT331–OCT340 (2016).
- Nguyen VP , LiY , QianWet al. Contrast agent enhanced multimodal photoacoustic microscopy and optical coherence tomography for imaging of rabbit choroidal and retinal vessels in vivo. Sci. Rep.9(1), 5945 (2019).
- Fujii M , SunagawaGA , KondoM , TakahashiM , MandaiM. Evaluation of micro electroretinograms recorded with multiple electrode array to assess focal retinal function. Sci. Rep.6, 30719 (2016).