
Abstract
Aim: This study aimed to identify molecular markers associated with papillary thyroid cancer (PTC) and investigate the therapeutic potential of targeted nanoscale drugs. Materials & methods: We analyzed the effects of circICA1 and miR-486-3p on B-CPAP cells’ proliferation, apoptosis, migration and invasion. The regulation of the miR-486-3p/SERPINA1 axis was explored using quantitative real-time reverse transcription PCR and western blot analyses for metastasis. In vivo, we evaluated the effects of hyperbranched polyamidoamine–RGD peptide/si-circICA1 on PTC growth and metastasis. Results: Enhanced miR-486-3p expression inhibits B-CPAP cells’ proliferation and invasion. si-circICA1 delivered via hyperbranched polyamidoamine–RGD peptide nanoparticles shows potential for treating metastasis in PTC. Conclusion: This study identifies key molecular mechanisms underlying PTC invasiveness and suggests a promising therapeutic strategy for PTC using targeted nanoscale drugs.
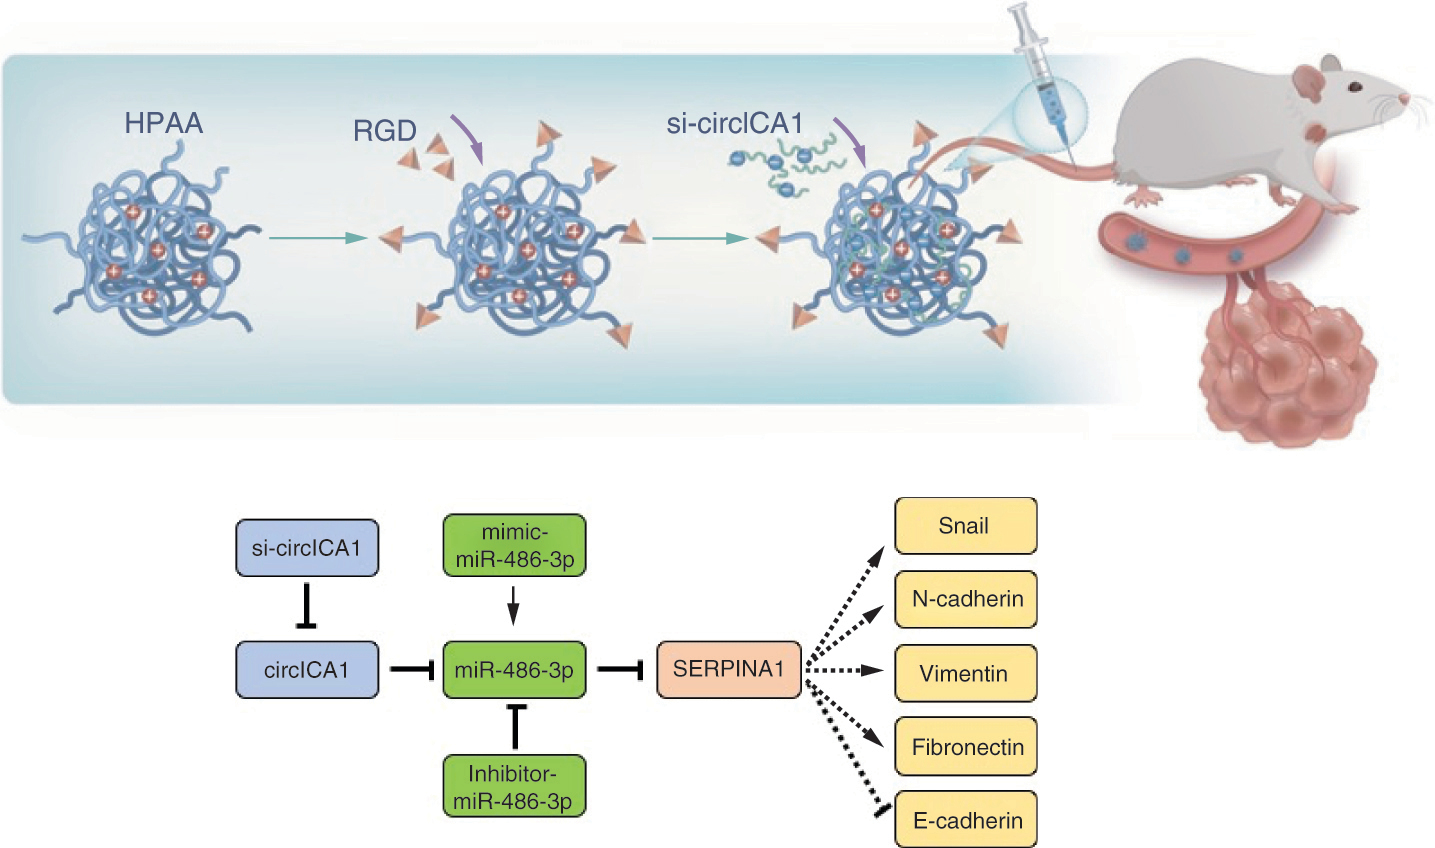
Graphical abstract
Papillary thyroid cancer (PTC), a subtype constituting a significant proportion of thyroid malignancies, is recognized as the most common malignant neoplasm affecting the endocrine system [Citation1]. Its incidence has exhibited a notable surge on a global scale in recent years [Citation2]. While a considerable cohort of PTC patients enjoys a relatively indolent clinical course, marked by favorable surgical outcomes, a substantial subset confronts the challenges posed by the invasive forms of this disease. These aggressive variants are characterized by the presence of multiple cancer foci, local infiltration, lymph node metastasis, distant dissemination and other invasive features [Citation3]. The invasive behavior of PTC often precipitates profound consequences for both affected individuals and society at large, encompassing complications such as recurrent laryngeal nerve involvement, lateral cervical lymph node metastases and even lung metastasis [Citation4]. However, the existing landscape of diagnostic techniques and molecular markers in the realm of PTC has proven inadequate in accurately predicting the invasive potential of this malignancy. This diagnostic limitation engenders significant uncertainty in treatment decisions for a substantial segment of PTC patients [Citation5].
Previous investigations into the molecular pathogenesis of PTC have primarily focused on the differential expression of proteins during pathogenesis through proteomics analysis [Citation6]. Additionally, genomic factors have been emphasized in understanding the pathogenesis of PTC [Citation7]. For instance, miR-221 and miR-222 have been validated as diagnostic markers for PTC [Citation8]. However, miRNA is relatively unstable in bodily fluids [Citation9]. Hence, there is ongoing exploration of noncoding RNA, which exhibits greater stability in serum [Citation10]. Cyclic RNAs, specifically circRNAs, have emerged as potential candidates for rapid serological disease diagnosis [Citation11]. CircRNAs possess a distinctive closed-loop structure that allows for their stable presence in human body fluids, including blood, urine and cerebrospinal fluid [Citation12]. Recently, the relationship between circRNA levels and the occurrence and progression of malignant tumors such as bladder cancer, breast cancer, colon cancer and liver cancer has become a prominent focus of research in the academic sphere [Citation13–17]. Despite the established evaluation of circRNAs in various human malignant tumors, limited studies have explored the role of circRNAs in PTC. This study aims to investigate the functional mechanism of circICA1 in PTC and provide novel insights into the development of the disease.
Nano-delivery carriers are nanomaterial-based vehicles loaded with drugs, utilized for the delivery of drugs to specific tissues through encapsulation, chemical bonding or electrostatic adsorption [Citation18]. This drug delivery process improves the drug’s water solubility and loading capacity, prevents premature interactions with the internal environment and enhances its absorption in target tissues, such as solid tumors [Citation19]. As a result, nanocarriers hold great promise in the field of biomedicine for efficient drug delivery. Hyperbranched polyamidoamine (HPAA) is easily prepared, separated and purified. It possesses a cavity within its structure and a large terminal amino group on its surface, which can be utilized for encapsulating or connecting to active molecules, including drugs [Citation20]. Consequently, HPAA has been extensively studied in the field of biomedicine, particularly in drug delivery and gene transfection.
Effective treatment with drugs faces challenges posed by distant metastasis of invasive cancer cells. Targeted drugs for PTC offer a promising solution [Citation21]. When targeted drugs are introduced into the patient’s body, they bind specifically to the cancer site, leading to site-specific necrosis of cancer cells without affecting the surrounding normal tissue. This precise approach significantly enhances the efficiency of treatment [Citation22]. Nanotechnology advancements and tumor research have revealed significant differences in the local physiological environment of tumor tissue compared with normal tissues, which play a pivotal role in tumor growth and spread [Citation23]. Consequently, the design of targeted nanocarriers tailored to the tumor microenvironment has emerged as a novel strategy in cancer treatment [Citation24]. RGD peptides, containing arginine–glycine–aspartic acid sequences, are widely present in organisms and act as recognition sites for the interaction between integrins and their ligands [Citation25]. Certain integrin receptors are specifically expressed by tumor cells, including PTC cells [Citation26]. The binding of integrin receptors using RGD peptides inhibits tumor migration and angiogenesis [Citation27]. HPAA is a peptide-based polymer that contains three tertiary amino and amide groups and is arranged along the polymer chain [Citation28]. Compared with other polycations, HPAA has low cytotoxicity, good biocompatibility, low hemolytic activity and easy surface modification [Citation29]. As a result, it is a cationic polymer with broad application prospects in gene delivery. This study innovatively utilizes RGD-modified HPAA as targeted nanoparticles, representing a novel therapeutic approach in tumor-targeted therapy.
Materials & methods
Papillary thyroid cancer patients
21 patients with PTC treated in the First Affiliated Hospital of Zhejiang University School of Medicine between January 2018 and December 2020 were included in the study. The study procedure was approved by the Ethics Committee of the First Affiliated Hospital of Zhejiang University School of Medicine (no. 2019.793). Informed consent for collecting medical information was obtained from all patients at their visit.
Antibodies & agents
Antibodies against E-cadherin, N-cadherin and fibronectin were purchased from Proteintech Group (IL, USA). An antibody to vimentin was purchased from Cell Signaling Technology (MA, USA). An antibody to Snail was purchased from Bioss (Beijing, China). N,N′-bis(acryloyl)cystamine and RGD were purchased from Applegoo (Hangzhou, China). Lipofectamine™ 3000 was obtained from Invitrogen/Thermo Fisher Scientific (CA, USA).
Cell culture & treatment
B-CPAP cells obtained from the Chinese Academy of Sciences were cultured in Dulbecco’s Modified Eagle Medium (DMEM)/F12 supplemented with 10% fetal bovine serum (FBS; Gibco, NY, USA), 2 mmol/l glutamine, 100 μg/ml streptomycin and 100 U/ml penicillin. The cells were maintained in a humidified atmosphere containing 5% CO2 at 37°C.
Cell counting kit-8 assay
Cells were trypsinized and reseeded in 96-well plates at a density of 2.5 × 10⁴ cells/ml, with each well containing 200 μl of cell suspension. A blank control group was also included by adding 100 μl of sterile phosphate-buffered saline (PBS) to the wells surrounding the cells. The plates were then incubated at 37°C with 5% CO2 for 24, 48, 72 and 96 h. Subsequently, cell viability was measured by adding 20 μl of cell counting kit-8 (CCK-8; MCE, NJ, USA) solution to each well and further incubating the plates in a cell culture incubator for 2 h. The absorbance at 450 nm was measured using a microplate reader.
Cell clonogenic assay
Cells were individually dissociated and resuspended in culture medium. The cell suspension was then diluted to a density of 300 cells per well and seeded into six-well plates, ensuring even distribution. After 2 weeks of incubation at 37°C in a 5% CO2 atmosphere, when clones had formed, the supernatant was removed and cells were washed with PBS and fixed in 70% ethanol for 30 min. Subsequently, cells were stained with 0.5% crystal violet for another 30 min, followed by PBS washing and photographic counting. Cloning efficiency was calculated as the number of clones divided by the initial number of seeded cells, multiplied by 100%.
Cell transfection
B-CPAP cells were seeded at a density of 300,000 cells per well in a six-well culture plate and transfected with various constructs. At 2 h before transfection, cells were switched to serum-free RPMI 1640 medium. Transfection was carried out by diluting target fragments and Lipofectamine 2000 separately, mixing them and incubating at room temperature. After 6 h, the transfection medium was replaced with regular culture medium and cells were incubated for 72 h. The cells were divided into different groups based on transfection type. We utilized siRNA targeting circICA1 or a negative control (siNC), as well as pcDNA3.1(+) circRNA vector for overexpressing circICA1, miR-486-3p mimic, inhibitor and their respective control plasmids (NC mimic, NC inhibitor), all of which were procured from Ribobio (Guangzhou, China). The si-circICA1 target sequence was GTTCAGGAAGGTTATAATA. After transfection, we allowed a 48 h period for cellular processes to take effect and subsequently harvested the cells for further investigation.
Apoptosis assay
Cells were digested with 0.25% trypsin without ethylenediaminetetraacetic acid (EDTA) and collected after digestion termination. Centrifugation at 352 × g for 5 min was employed to remove the supernatant, followed by resuspension in PBS. After two PBS washes at 352 × g for 5 min each, apoptosis assessment was carried out using the Annexin V-APC/7-AAD Apoptosis Detection Kit (KeyGEN BioTECH, Nanjing, China). This included adding 500 μl of binding buffer to resuspend the cells, followed by the addition of 5 μl of Annexin V-APC and 5 μl of 7-AAD, with thorough mixing. The reaction was conducted at room temperature in the dark for 5–15 min, while a negative control was simultaneously set up, involving normal cells without Annexin V-APC and 7-AAD. Finally, flow cytometry was employed to perform the detection on a cell analyzer.
Cell cycle analysis
Cells were first digested with 0.25% trypsin without EDTA, collected and washed with PBS. Subsequently, they were fixed in 70% ethanol at 4°C for over 4 h. After fixation, cells were rinsed with cold PBS, treated with RNase and propidium iodide, then subjected to flow cytometry analysis.
Cell scratch assay
Cells were seeded into the wells of a six-well plate at a density of 2 × 10⁶ cells per well, followed by overnight incubation under conditions of 37°C and 5% CO2 saturation. Once the cell density reached over 80%, almost covering the bottom of the plate, a pipette tip was used to draw scratches, ensuring consistent scratch creation between different wells. The cells were then washed three times with PBS to remove detached cells and supplemented with serum-free culture medium. Photographs were taken at the 0 h time point. Subsequently, the plate was placed in a 37°C, 5% CO2 incubator, and after 48 h, photographs were captured again to monitor cell migration and scratch closure. The cell migration rate was calculated as the percentage of the migrated distance relative to the initial width of the scratch.
Cell invasion assay
Matrigel® was diluted to 50 mg/l at a 1:15 ratio, and approximately 32 μl of the diluted solution was added to the upper chamber of a Transwell® chamber bottom membrane (BD Bioscience, CA, USA) to evenly coat the surface. The cells were digested, and their concentration was determined. Then 600 μl of serum-containing culture medium was added to the lower compartment of a 24-well plate. A serum-free cell suspension containing 5 × 10⁴ cells (200 μl) was added to the upper chamber. After incubation for 48 h to allow noninvasive cells to be removed from the membrane, the cells that had migrated to the lower chamber were fixed, stained and dried. The migrated cells, on a glass slide, were counted under a microscope.
Cell migration assay
B-CPAP cells were diluted to a concentration of 2 × 10⁵ cells/ml in serum-free DMEM. In a 24-well plate, 800 μl of 10% FBS-containing DMEM was added, and Transwell inserts were placed. Then 200 μl of cell suspension was added to the upper chamber of each Transwell and incubated for 24 h. The Transwells were removed, cells in the upper chamber were wiped off, and the cells in the lower chamber were fixed with 70% ice-cold ethanol for 1 h. Subsequently, cells were stained with 0.5% crystal violet for 20 min, washed with PBS, and the nonmigrated cells on the upper side were wiped away. Finally, cells were observed and photographed under a microscope.
Luciferase reporter assay
48 h post-transfection, cells are lysed using reporter gene cell lysis buffer, thoroughly mixed, and lysed with 150μl per well. After complete lysis, samples are centrifuged at 12,000 g for 5 min and the supernatant is collected for analysis. Both firefly and Renilla luciferase assay reagents (Beyotime, Jiangsu, China) are prepared and brought to room temperature; the 100× Renilla luciferase substrate is kept on ice. For each sample, 100μl of Renilla luciferase assay buffer is mixed with the 100× substrate to prepare the working solution. For each assay, 100μl of sample is mixed with 100μl of firefly luciferase assay reagent and the relative light units (RLUs) are measured, using the lysis buffer as a blank. Following this, 100μl of Renilla luciferase working solution is added, mixed, and measured for RLU. The activity of the target reporter gene is determined by calculating the ratio of the RLUs obtained from Renilla luciferase to those from firefly luciferase.
Quantitative real-time reverse transcription PCR
Total RNA was extracted from tissue samples and cells using TRIzol® reagent (Invitrogen) for subsequent analysis by quantitative real-time reverse transcription PCR (qRT-PCR). The obtained cDNA from reverse transcription using the Promega GoScript reverse transcription system (Promega Madison, WI, USA) was used for qRT-PCR in a 20 μl PCR amplification system employing a LightCycler 480 qRT-PCR. The 2-ΔΔCt method was utilized for relative quantitative analysis of expression level differences.
Western blotting
Total protein was extracted from cultured cells using a lysis buffer containing protease inhibitors. Cells were grown in six-well plates until reaching confluence. After washing with cold PBS, cells were lysed on ice, and the lysates were collected. The protein concentration in each lysate was determined using a bicinchoninic acid assay, allowing precise loading of 40 μg of protein per sample. Denatured protein samples were loaded onto precast SDS–polyacrylamide gels. Electrophoresis was conducted at a constant voltage until the bromophenol blue tracking dye reached the bottom of the gel, ensuring effective protein separation. Proteins were transferred from the gel to polyvinylidene difluoride membranes, which were then blocked in 5% skim milk/Tris-buffered saline with Tween (TBST) at room temperature. After blocking, the membranes were incubated with primary antibodies (e.g., anti-Snail) at 4°C overnight. Following primary antibody incubation, the membranes were thoroughly washed with TBST to remove unbound antibodies. The membranes were then incubated with secondary antibody, which recognizes the primary antibody. Protein bands were visualized using an enhanced chemiluminescence detection system (Thermo Fisher Scientific, MA, USA). Excess substrate was removed, and the membranes were exposed to x-ray film to capture the chemiluminescent signals. Protein band intensities on the x-ray film were quantified using BandScan (Glyko, CA, USA).
RNA fluorescence in situ hybridization analysis
Custom fluorescence in situ hybridization (FISH) probes were designed and synthesized with specific probe sequences. Probe sequences were: SERPINA1, TGAACTTGACCTCGGGGGGGATAGACATGGGTATG; circlCA1, ATAAGTTATATTATAACCTTCCTGAACTTCTCCAT; and miR-486-3p, ATCCTGTACTGAGCTGCCCCG.
Fixed and permeabilized cells or tissues were treated with a hybridization buffer containing the FISH probes, followed by incubation to allow for probe binding. After the hybridization step, posthybridization washes were performed to remove unbound probes. High-quality images of the RNA-FISH experiments were captured using a confocal microscope equipped with appropriate filters and detectors.
Sanger sequencing
Spectrophotometric quantification of RNA was performed using the Infinite 200 NanoQuant plate reader (TECAN, Mannedorf, Switzerland), followed by cDNA synthesis using 1000 ng of RNA. Target DNA regions were amplified by PCR using Taq DNA polymerase (New England Biolabs, MA, USA) and specific primers. The PCR protocol involved an initial denaturation at 96°C for 2 min, followed by 35 cycles of 96°C for 30 s, 57°C for 30 s, and 72°C for 2 min, with a final extension at 72°C for 5 min. A 1.5% agarose gel was prepared for electrophoresis, where 2 μL of loading buffer was mixed with 4 μL of the PCR product and run at 160V for 35 min. The amplified PCR product was purified using the QIAquick PCR Purification Kit (Qiagen, Hilden, Germany). Cycle sequencing reactions were then performed using the BigDye Terminator v3.1 Cycle Sequencing Kit (Applied Biosystems, CA, USA) and a 3500xL Genetic Analyzer (Applied Biosystems, CA, USA) for capillary electrophoresis. The incorporation of ddNTPs labeled with different fluorescent tags terminated DNA strand extension during each cycle. The resulting fragments were separated based on size, and their sequence was determined. Finally, sequence analysis was conducted using SeqScanner Software 2 (Applied Biosystems, CA, USA), interpreting the electropherogram data to provide the final DNA sequence.
Preparation of HPAA, HPAA-RGD & HPAA-RGD/si-circICA1
HPAA was prepared through a Michael’s addition polymerization reaction. N,N′-bis(acryloyl)cystamine (1.5 mmol, 0.391 g) and 10 ml methanol solution were added to a 50-ml round-bottomed flask and magnetically stirred to dissolve the components. 1-(2-Aminoethyl)piperazine (1.5 mmol, 0.194 g) was dissolved in 2 ml of methanol solution and slowly added to the flask with stirring. The reaction proceeded at 50°C for 6 days. After completion, the reaction mixture was precipitated by adding excess ether under vigorous stirring. The precipitate was separated by centrifugation, dissolved in methanol, precipitated in 100 ml acetone solution containing 5% by volume of concentrated hydrochloric acid, and dried under vacuum to obtain a pale yellow solid powder, HPAA. For HPAA-RGD synthesis, RGD (87 mg, 0.25 mmol) was dissolved in purified water. 1-Ethyl-3-(3-dimethylaminopropyl) carbodiimide hydrochloride (EDC; 96 mg, 0.5 mmol) and N-Hydroxysuccinimide (NHS; 58 mg, 0.5 mmol) were added to the distilled water for activation and stirred for 2 h. Then HPAA (1.9 g, 0.05 mmol) was added and the mixture stirred at room temperature for 48 h. The solution was dialyzed to remove unconjugated RGD, freeze-dried and finally obtained as RGD-conjugated hyperbranched polymer (HPAA-RGD) powder. Dissolve the HPAA-RGD powder in distilled water to form an HPAA-RGD solution. Finally, si-circICA1 was slowly added to the HPAA-RGD solution to remove unbound si-circICA1 and obtain the HPAA-RGD/si-circICA1 solution.
Nuclear magnetic resonance
For each polymer sample, 3–5 mg was dissolved in an appropriate amount of deuterated reagent (deuterium oxide [D2O]). The resulting solutions were then transferred into clean nuclear magnetic resonance (NMR) tubes. NMR structural analysis was performed at room temperature using an NMR spectrometer, and the spectral data were analyzed using MestReNova software (Mestrelab, Galicia, Spain).
Infrared spectroscopy
A certain amount of each sample was ground and pressed into pellets with potassium bromide. These prepared sample pellets were then subjected to Fourier transform infrared spectroscopy, scanning in the wavelength range of 500–4000 cm-1.
Transmission electron microscopy
Prepared nanomaterial solutions were individually dropped onto copper grids and allowed to dry. The morphology of the nanomaterials was observed using a transmission electron microscope.
Particle size analysis
An appropriate amount of the sample was first prepared as a 1 mg/ml solution. Then, 1 ml of each sample was placed in the sample chamber, and the particle size was determined using dynamic light scattering with the measurement temperature set at 25°C.
Thermogravimetric analysis
Approximately 5 mg of each prepared sample was weighed and placed into clean aluminum crucibles. Under a nitrogen atmosphere, the samples were heated from room temperature to 750°C at a heating rate of 20°C/min, and the mass changes with temperature were recorded using a thermogravimetric analyzer.
Gel electrophoresis
We evaluated the material’s ability to load genes through agarose gel electrophoresis experiments. First, si-circICA1 was selected as the gene model, and the materials were complexed with the gene to prepare gene complexes. Specifically, a certain concentration of nanomaterial aqueous solution was mixed with plasmid DNA at different N/P ratios (0:1, 0.5:1, 1:1, 2:1, 5:1, 10:1 and 20:1) in separate Eppendorf tubes.The N/P ratio represents the mass ratio between HPAA-RGD and si-circICA1. The complexes were allowed to form for 30 min at room temperature. Gel electrophoresis was then performed to characterize the binding ability of nanomaterials to si-circICA1. The procedure involved preparing a 1.5% agarose gel in advance, adding 3 μl of loading buffer to each complex, loading the samples into the gel wells and electrophoresing in 1 × Tris-acetate-EDTA buffer at 150 V for 15 min. After the experiment, photographs were taken at a wavelength of 365 nm using a gel imaging system (UVP, CA, USA).
Hemolysis assay
Different concentrations of nanomaterial PBS solutions (1, 0.5, 0.1 and 0.01 mg/ml) were prepared. Deionized water and PBS were used as positive and negative control groups, respectively. Then, 4 ml of each concentration of the sample was added to centrifuge tubes, followed by the addition of 200 μl of 16% red blood cell suspension. The mixture was incubated at predetermined time points (0.5, 1, 3, 5, 7, 12 and 24 h) and then centrifuged at 1000 × g for 5 min to collect the supernatant. The absorbance of each sample at 540 nm was measured using a spectrophotometer. Hemolysis percentage was calculated using the formula: hemolysis (%) = (A − C) / (B − C) × 100, where A, B and C represent the absorbance of the experimental group, positive control group and negative control group, respectively.
Red blood cell morphology analysis
Fresh whole blood was centrifuged at 1000 × g for 5 min to collect the red blood cell layer. Four concentrations of nanomaterials (1, 0.5, 0.1 and 0.01 mg/ml) were prepared, with PBS used as positive and negative control groups. Each sample solution was mixed with an appropriate amount of red blood cells and incubated for 1 h. The precipitated red blood cells were then fixed with 4% paraformaldehyde for 1 h, placed on glass slides, dehydrated sequentially in 70, 85, 95 and 100% ethanol for 10 min each, air-dried and subjected to gold sputter coating. Changes in red blood cell morphology were observed using scanning electron microscopy.
Activated partial thromboplastin time & prothrombin time analysis
Fresh anticoagulated whole blood was centrifuged at 1000 × g for 10 min to obtain platelet-poor plasma, 270 μl of which was mixed with different concentrations of nanomaterials (30 μl in PBS). After the addition of the respective reagents, the activated partial thromboplastin time and prothrombin time of the samples were measured using an automated coagulation analyzer (STAR Evolution, Diagnostica Stago, Assiernes, France).
In vivo tumor formation experiment
We established PTC models using subcutaneous injection of thyroid cancer cells in mice [Citation30]. Each group received a subcutaneous injection of B-CPAP cells in a volume of 200 μl, containing 2 × 10⁶ cells, into the right forelimb axillary region. During the experimental period, tumor dimensions (a and b) were measured every 3 days, and tumor volume was calculated using the formula: volume = a*b2/2. After 2 weeks, the mice received intravenous injections of PBS, HPAA-RGD, HPAA/si-circICA1, HPAA-RGD/si-circICA1 and adenovirus/si-circICA1. Adenoviruses were procured from GenePharma (Shanghai, China) for our experiments. In the animal experiments, each injection consisted of 1 × 10⁹ plaque-forming units of adenovirus. Tumor volume was measured twice a week. After 4 weeks, the mice were euthanized and the tumor tissues were excised and analyzed.
In vivo animal experiments
Each group received a subcutaneous injection of B-CPAP cells in a volume of 200 μl, containing 2 × 10⁶ cells, into the right forelimb axillary region. After 2 weeks, we performed tail vein injections of HPAA/si-circICA1, HPAA-RGD/si-circICA1 and si-circICA1 labeled with Cy3 fluorescence, all of which were purchased from Ribobio (Guangzhou, China). At 4, 8 and 24 h postinjection, the animals were anesthetized, placed in a dark chamber and imaged using the Xenogen live animal detector to observe the localization of siRNA.
Terminal deoxynucleotidyl transferase dUTP nick end labeling staining
Tissue sections were deparaffinized and gently rinsed with diethyl pyrocarbonate-treated water. Tissue outlines were marked with an oil-based pen. A 20 μg/ml proteinase K solution was applied to samples for 20 min at room temperature. After rinsing, 1 × equilibration buffer was added, and tissues were incubated for 15 min. Subsequently, tissues were covered with terminal deoxynucleotidyl transferase reaction buffer and incubated at 37°C for 60 min in a humidified chamber. After washing with PBS, 4′,6-diamidino-2-phenylindole (DAPI) staining was performed for 5 min, and excess DAPI was removed. Images were acquired using a fluorescence microscope.
Statistical analyses
Statistical analyses were performed using GraphPad Prism 5 software (GraphPad Software, Inc, CA, USA). The experimental values are presented as mean ± standard deviation, and the experiments were conducted in triplicate. A p-value of less than 0.05 was considered statistically significant.
Results
Downregulation of miR-486-3p in highly metastatic papillary thyroid cancer tissues & its regulation of SERPINA1 to inhibit cell proliferation, migration & invasion
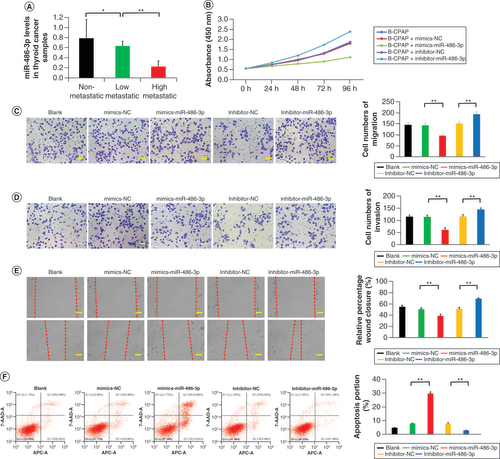
The expression of miR-486-3p has been found to differ significantly between PTC and normal thyroid tissues in previous studies [Citation31]. To investigate the impact of miR-486-3p on PTC metastasis, thyroid tissue samples were collected from 21 thyroid cancer patients. All patient samples were obtained from single biopsies. The pathological results of all thyroid cancer specimens indicated PTC. A comprehensive statistical analysis was conducted on these 21 cases (Supplementary Table 1). We conducted qRT-PCR analysis using thyroid tissues from 21 patients with thyroid tumors. The results revealed that the expression of miR-486-3p in nonmetastatic thyroid tumor tissue was notably higher compared with highly metastatic thyroid tumor tissue (A). CCK-8 analysis demonstrated that miR-486-3p markedly reduced the activity of B-CPAP cells (B). Similar results were obtained in the monoclonal antibody experiment. The cell cloning rate in the mimics-miR-486-3p group was significantly reduced compared with the control group, while the cell cloning rate in the inhibitor-miR-486-3p group exhibited a significant increase (Supplementary Figure 1A & B). The outcomes of the cell migration experiment, invasion test and scratch experiment indicated that miR-486-3p significantly weakened the migration and invasion capabilities of cells (C–E). Flow cytometry analysis revealed that treatment with miR-486-3p led to a substantial increase in the percentage of B-CPAP cell apoptosis (F). Moreover, in the mimics-miR-486-3p group, the G0–G1 phase ratio considerably increased, while the ratios of the S phase and G2–M phase noticeably decreased. Conversely, the inhibitor-miR-486-3p group exhibited the opposite effect (Supplementary Figure 1C). These findings demonstrate the effective inhibitory role of miR-486-3p in cell proliferation.
(A) miR-486-3p levels in papillary thyroid carcinoma samples. (B–E) Cell counting kit-8, migration, invasion and scratch experiments of B-CPAP cells intervened with blank, mimics-NC, mimics-miR-486-3p, inhibitor-NC and inhibitor-miR-486-3p. (F) B-CPAP cell apoptosis by flow cytometry in different groups. Scale bars (C & D) = 50 μm. Scale bars (E) = 100 μm. n = 3.
*p < 0.05; **p < 0.01 (one-way analysis of variance).
NC: Negative control.
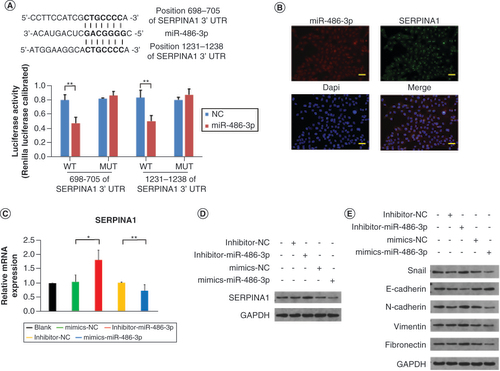
To predict the potential target of miR-486-3p, we employed TargetScan (www.targetscan.org/). Our analysis using TargetScan indicated that SERPINA1 shares complementary binding sites with miR-486-3p. We utilized a luciferase reporter assay to determine whether miR-486-3p directly targets SERPINA1. We constructed a dual-luciferase reporter vector containing either the wild type (WT) SERPINA1 or a mutant version (MUT) with alterations in the miR-486-3p binding sites. In 293T cells co-transfected with the miR-486-3p mimic and the WT construct, a significant reduction in luciferase reporter activity was observed, whereas no such reduction was detected with the mutant construct (A). Collectively, these experiments suggest that SERPINA1 may serve as a target gene of miR-486-3p. RNA-FISH analysis revealed colocalization of SERPINA1 mRNA and miR-486-3p in the cytoplasm and nucleus of B-CPAP cells (B). The qRT-PCR and western blotting (WB) results further validated this finding (C & D). Additionally, we explored the effects of miR-486-3p on B-CPAP cells through WB analysis, which demonstrated that miR-486-3p treatment significantly downregulated the expression of genes encoding Snail, N-cadherin, vimentin and fibronectin, while upregulating the expression of genes encoding E-cadherin (E). WB results for comparison analysis of SERPINA1 and proteins related to epithelial–mesenchymal transition (EMT) are presented in Supplementary Figure 1D & E.
(A) The predicted sequences of the miR-486-3p target sequence in SERPINA1 3′ untranslated regions and luciferase activity detection. (B) RNA fluorescence in situ hybridization experiment results of miR-486-3p and SERPINA1 expression in B-CPAP cells. Scale bars = 100 μm. (C & D) The qRT-PCR and western blot analysis of SERPINA1 expression in B-CPAP cells. (E) Western blot analysis of epithelial–mesenchymal transition protein expression in B-CPAP cells. Scale bars = 100 μm. n = 3.
*p < 0.05; **p < 0.01 (one-way analysis of variance).
NC: Negative control.
Validation of circICA1
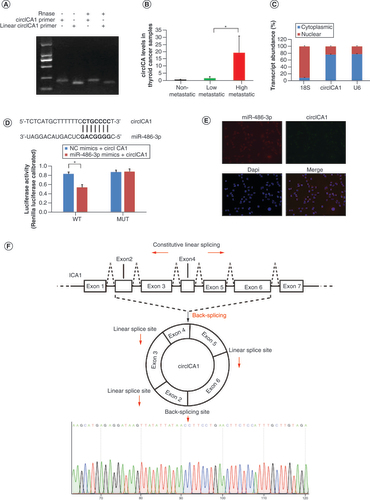
We utilized the Circular RNA Interactome (https://circinteractome.nia.nih.gov/) to predict the presence of circRNAs containing binding sites for miR-486-3p. Through this analysis, we identified hsa_circ_0079422 (circICA1) as a circRNA with potential binding sites for miR-486-3p. The predicted splice junction of circICA1 was confirmed in B-CPAP cells (A). The qRT-PCR analysis results demonstrated significantly higher expression of circICA1 in highly metastatic thyroid tumor tissue compared with nonmetastatic thyroid tumor tissue (B). Nucleocytoplasmic separation experiments and RNA-FISH analysis revealed colocalization of circICA1 and miR-486-3p in the cytoplasm of B-CPAP cells (C). Furthermore, bioinformatics prediction indicated that circICA1 is a potential target of miR-486-3p. We employed a luciferase reporter gene assay to determine if miR-486-3p targets circICA1. In 293T cells co-transfected with the miR-486-3p mimic and wild-type circICA1, we observed a significant decrease in luciferase reporter activity, while no reduction in activity was detected with the mutant construct(D). And RNA-FISH analysis also revealed that circICA1 and miR-486-3p colocalize in the cytoplasm (E). Taken together, these experiments suggest that circICA1 may act as a sponge for miR-486-3p. Sanger sequencing confirmed the head–tail splicing in the qRT-PCR product of circICA1, and the product size matched the expected size (F).
(A) Gel electrophoresis results for circICA1 obtained from full-length cDNA from B-CPAP cells. (B) CircICA1 levels in papillary thyroid carcinoma samples. (C) Nucleocytoplasmic separation experiment results of circICA1 in B-CPAP cells. (D) The predicted sequences of the miR-486-3p target sequence in circICA1 and luciferase activity detection. (E) RNA fluorescence in situ hybridization results of circICA1 and miR-486-3p in B-CPAP cells. Scale bars = 20 μm. n = 3. *p < 0.05; **p < 0.01 (one-way analysis of variance). (F) Schematic illustration showing ICA1 exons 2–6 circularization to form circICA1 (black arrow). The presence of circICA1 was validated by qRT-PCR, followed by Sanger sequencing. Red arrow represents head-to-tail circICA1 splicing sites.
Functional role of circICA1 by targeting miR-486-3p & SERPINA1
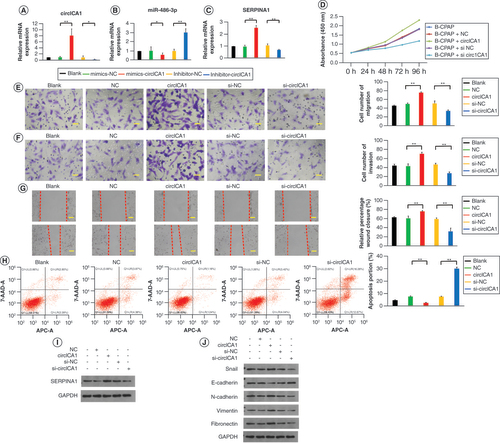
To further investigate the function of circICA1, we prepared adenoviruses containing circICA1, control circRNA, circICA1 siRNA and control siRNA to infect B-CPAP cells. The qRT-PCR results demonstrated that the overexpression of circICA1 significantly decreased the expression of miR-486-3p and increased the expression of SERPINA1. Conversely, circICA1 interference led to a significant increase in miR-486-3p expression and a decrease in SERPINA1 expression (A–C). Based on CCK-8 analysis, circICA1 was found to significantly enhance the activity of PTC cells (D). Similar results were obtained in the monoclonal antibody experiment, where the circICA1 overexpression group exhibited a significant increase in cell cloning rate, while the circICA1 interference group showed a significant reduction (Supplementary Figure 2A & B). The cell migration test, invasion test and scratch test results indicated that circICA1 notably enhanced the migration and invasion capabilities of cells (E–G). Flow cytometry analysis revealed that circICA1 overexpression resulted in a significant increase in B-CPAP cell apoptosis in the circICA1 interference group (H), with a significant decrease in the S phase and G2 phase ratios (Supplementary Figure 2C). Further investigation of the mechanism of action of circICA1 was conducted through WB experiments. The results demonstrated that circICA1 overexpression significantly increased the expression of genes encoding Snail, N-cadherin, vimentin and fibronectin, while decreasing the expression of genes encoding E-cadherin. In contrast, interference with circICA1 led to a significant decrease in the expression of genes encoding SERPINA1, Snail, N-cadherin, vimentin and fibronectin, and a significant increase in the expression of genes encoding E-cadherin (I & J). WB results for SERPINA1 and EMT-related proteins comparison analysis are presented in Supplementary Figure 2D & E. Our experimental results confirm that miRNA-486-3p plays a regulatory role in EMT-related genes. This suggests that miRNA-486-3p is involved in the post-transcriptional regulation of EMT-related genes, and inhibiting its activity leads to changes in the expression levels of their encoded proteins.
(A–C) qRT-PCR results for circICA1, miR-486-3p and SERPINA1 from B-CPAP cells. (D–G) Cell counting kit-8, migration, invasion and scratch experiments of B-CPAP cells intervened with blank, NC, circICA1, si-NC and si-circICA1. (H) B-CPAP cell apoptosis test by flow cytometry in different groups. (I & J) Western blot analysis of epithelial–mesenchymal transition-related protein expression in B-CPAP cells. Scale bars (E & F) = 50 μm. Scale bars (G) = 100 μm. n = 3.
*p < 0.05; **p < 0.01 (one-way analysis of variance).
NC: Negative control.
circICA1 function recovery experiment
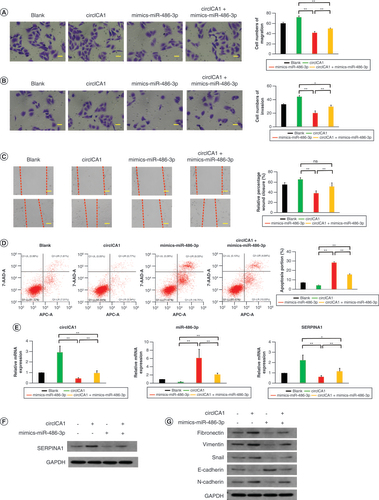
To examine whether the biological functions induced by circICA1 can be reversed, we conducted a series of experiments in B-CPAP cells. Cell viability was assessed using CCK-8 analysis. The overexpression of circICA1 significantly increased cell activity, while the introduction of miR-486-3p mimics reversed this effect, leading to a decrease in cell viability (Supplementary Figure 3A). Cell proliferation was evaluated through a monoclonal antibody experiment. The circICA1 overexpression group exhibited an increased cell cloning rate, indicating enhanced proliferation. Conversely, the miR-486-3p mimics showed reduced cell cloning rate, suggesting inhibition of proliferation (Supplementary Figure 3B & C). Cell migration and invasion capabilities were assessed using migration and invasion assays. circICA1 significantly enhanced cell migration and invasion, but the introduction of miR-486-3p mimics reversed these effects, resulting in decreased migration and invasion (A & B). The results of the cell scratch test showed that overexpression of circICA1 increased the distance of PTC cells moving toward the scratch, while miR-486-3p mimics could reduce the distance of movement (C). Flow cytometry analysis revealed that miR-486-3p partially restores the inhibitory effect of circICA1 on apoptosis in B-CPAP cells (D). qRT-PCR and WB experiments demonstrated that circICA1 overexpression upregulated EMT-related genes (Snail, N-cadherin, vimentin and fibronectin) and downregulated E-cadherin (E–G). miR-486-3p mimics resulted in the opposite expression pattern. WB results for SERPINA1 and EMT-related proteins comparison analysis are presented in Supplementary Figure 3D & E. In summary, these experiments indicate that circICA1 modulates various biological functions in PTC cells, including viability, proliferation, migration, invasion, apoptosis and cell cycle progression. The introduction of miR-486-3p mimics effectively reversed the effects induced by circICA1 overexpression, highlighting the regulatory relationship between circICA1 and miR-486-3p in PTC.
(A–C) Migration, invasion and scratch experiments of B-CPAP cells in different groups. (D) B-CPAP cell apoptosis test by flow cytometry in different groups. (E) qRT-PCR results for circICA1, miR-486-3p and SERPINA1 from B-CPAP cells. (F & G) Western blot analysis of SERPINA1 and EMT protein expression in B-CPAP cells. Scale bars (A & B) = 50 μm. Scale bars (C) = 100 μm. n = 3.
*p < 0.05; **p < 0.01 (one-way analysis of variance).
EMT: Epithelial–mesenchymal transition.
Preparation & characterization of HPAA-RGD/si-circICA1
To prepare HPAA-RGD/si-circICA1, we employed a conjugation method, ensuring attachment of targeted RGD molecules to the ends of HPAA through highly stable electrostatic interactions. This resulted in the formation of a well-defined nanocarrier with unique characteristics. To gain comprehensive insights into the morphology of the prepared HPAA-RGD, we conducted transmission electron microscopy analysis, which revealed distinct nanoscale features and allowed for precise measurement of particle size (A).
(A) Transmission electron microscopy images of HPAA-RGD. (B & C) The verification of HPAA and HPAA-RGD by (B) nuclear magnetic resonance and (C) infrared spectroscopy. (D & E) The (D) particle size and (E) ζ-potential of HPAA-RGD. (F) The stability of HPAA-RGD pore size in phosphate-buffered saline or Dulbecco’s modified Eagle medium + 10% fetal bovine serum. (G) The thermogravimetry results of HPAA-RGD. (H) Agarose gel electrophoresis results of different proportions of HPAA-RGD. (I) Morphology of red blood cells cultured with HPAA-RGD. (J & K) Hemolysis and coagulation experiments. Scale bars (A) = 100 nm. Scale bars (I) = 20 μm. n = 3.
*p < 0.05; **p < 0.01 (one-way analysis of variance).
APTT: Activated partial thromboplastin time; BAC:N,N’-Bis(acryloyl)cystamine; DMEM: Dulbecco’s Modified Eagle Medium; FBS: Fetal bovine serum; HPAA: Hyperbranched polyamidoamine; NK: Negative control; N/P: The mass ratio between HPAA-RGD and si-circICA1; PBS: Phosphate-buffered saline; PT: Prothrombin time; TEM: Transmission electron microscopy.
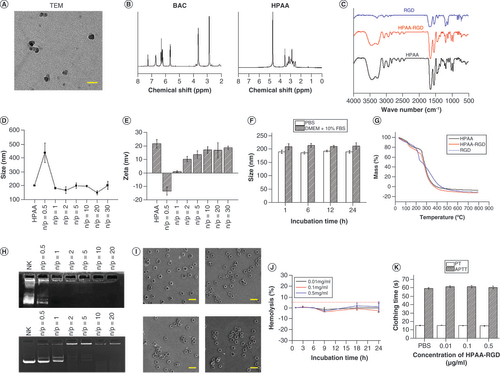
In addition to morphological assessments, we employed advanced analytical techniques to comprehensively characterize the chemical structure and composition of HPAA-RGD. NMR spectroscopy provided detailed information about the molecular structure, while infrared spectroscopy facilitated the identification of specific functional groups (B & C). These analyses confirmed the successful synthesis of HPAA-RGD and highlighted the presence of RGD ligands on the surface of the nanocarrier, which are crucial for targeted drug delivery.
To evaluate the complexation ability of HPAA-RGD with si-circICA1, dynamic light scattering measurements were performed, enabling precise determination of particle size and ζ-potential at various mass ratios. The N/P ratio represents the mass ratio between HPAA-RGD and si-circICA1. When N/P = 0.5, HPAA-RGD may not effectively encapsulate si-circICA1, leading to a less compact structure and larger nanoparticle size. The incomplete encapsulation could result in less stability and a larger hydrodynamic radius. As the N/P ratio increases, there is a proportional increase in the amount of HPAA-RGD available for complexing with si-circICA1. This allows for more effective encapsulation, resulting in a reduction of the nanoparticle size. The final particle size stabilizes at approximately 150–200 nm. This indicates the optimal mass ratio for achieving a consistent nanoparticle size (D). E displays the ζ-potential results. With only HPAA-RGD present, the potential is around 22 mV. The ζ-potential reaches -13 mV at N/P = 0.5. With further increases in the mass ratio, the potential eventually stabilizes at around 18 mV. These findings align with the results observed in agarose gel electrophoresis experiments, where si-circICA1 ceases to migrate at specific mass ratios. This critical observation underlines the dynamic complexation behavior of HPAA-RGD with si-circICA1 and its capacity to form positively charged complexes, facilitating efficient gene delivery into target cells.
In terms of material stability, we conducted comprehensive assessments in different physiological media. In PBS and DMEM supplemented with 10% FBS, we observed that the pore size of HPAA-RGD remained relatively stable over a 24-h period (F). Thermogravimetric analysis was employed to determine the material’s composition, revealing that HPAA accounted for 97.7% of the material, while RGD ligands constituted 2.3% (G). Furthermore, agarose gel electrophoresis confirmed the glutathione (GSH)-responsiveness of HPAA-RGD and its effective complexation with siRNA. Importantly, successful encapsulation of GSH and siRNA was evident at the HPAA-RGD/si-circICA1 mass ratio of 2:1 (H), in alignment with the particle size and ζ-potential data.
Additionally, we conducted thorough evaluations of the biocompatibility and safety profile of HPAA-RGD. Electron microscopy assessment of red blood cells following intravenous injection of HPAA-RGD demonstrated no significant alterations in red blood cell morphology, confirming the absence of adverse effects (I). Moreover, in vitro hemolysis assays indicated that HPAA-RGD exhibited minimal hemolytic activity, with a hemolysis rate not exceeding 5%, underscoring its excellent biocompatibility (J). Importantly, evaluations of coagulation function through activated partial thromboplastin time and prothrombin time assessments revealed no significant deviations from baseline levels, further substantiating the safety profile of HPAA-RGD (K).
HPAA-RGD/si-circICA1 targets miR-486-3p & SERPINA1 to function in B-CPAP cells
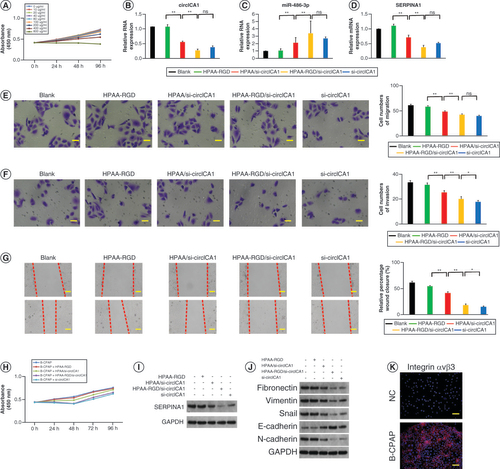
The toxicity of the nanomaterials was assessed using the CCK-8 test. The results demonstrated that concentrations of HPAA-RGD/si-circICA1 below 40 μg/ml did not exhibit significant toxicity to B-CPAP cells (A). B-CPAP cells were treated with different formulations including HPAA-RGD, HPAA/si-circICA1, HPAA-RGD/si-circICA1 and si-circICA1. The si-circICA1 group involved the use of Lipofectamine 2000 to transfect si-circICA1 into the cells, which served as a positive control. We then compared the effects of Lipofectamine 2000-mediated si-circICA1 transfection with the effects of HPAA-RGD-loaded si-circICA1 transfection. qRT-PCR analysis revealed that the HPAA-RGD/si-circICA1 group exhibited a significant reduction in circICA1 expression compared with the blank, HPAA-RGD and HPAA/si-circICA1 groups. Furthermore, miR-486-3p expression was significantly increased, while SERPINA1 expression was significantly decreased in the HPAA-RGD/si-circICA1 group (B–D). Consistent results were observed in the monoclonal antibody experiment, indicating a reduced cell cloning rate in the HPAA-RGD/si-circICA1 group (Supplementary Figure 4A & B). Migration, invasion and scratch tests demonstrated that HPAA-RGD/si-circICA1 treatment significantly suppressed cell migration and invasion capabilities (E–G). Cell viability was assessed using the CCK-8 analysis, revealing that B-CPAP cells treated with HPAA-RGD/si-circICA1 exhibited significantly lower activity compared with cells in other treatment groups (H). WB experiments confirmed the downregulation of SERPINA1 in the HPAA-RGD/si-circICA1 group (I). HPAA-RGD/si-circICA1 treatment upregulated the expression of genes encoding Snail, N-cadherin, vimentin and fibronectin, while downregulating the expression of the gene encoding E-cadherin. In contrast, interference with circICA1 led to a decrease in the expression of genes encoding Snail, N-cadherin, vimentin and fibronectin and an increase in the expression of the gene encoding E-cadherin (J). WB results for SERPINA1 and EMT-related proteins comparison analysis are presented in Supplementary Figure 4C & D. Moreover, enhanced lysosome escape was observed in B-CPAP cells treated with HPAA-RGD/si-circICA1 compared with those treated with HPAA/si-circICA1, as evidenced by fluorescence microscopy (Supplementary Figure 4E). To verify the presence of RGD-targeting integrin αvβ3 in B-CPAP, we assessed the expression of integrin αvβ3 using immunofluorescence. The results indicated a significantly higher expression of integrin αvβ3 in B-CPAP cells compared with normal thyroid cells (K). In summary, HPAA-RGD/si-circICA1 effectively targeted miR-486-3p and SERPINA1, resulting in reduced cell viability, migration and invasion, as well as altered expression of genes associated with EMT. The enhanced lysosome escape further supports the potential mechanism of action of HPAA-RGD/si-circICA1 in B-CPAP cells.
(A) Evaluation of the toxicity of HPAA-RGD/si-circICA1 to B-CPAP cells. (B–D) qRT-PCR results for circICA1, miR-486-3p and SERPINA1 from B-CPAP cells. (E–H) Results of migration, invasion, scratch and cell counting kit-8 experiments of B-CPAP cells in different groups. (I & J) Western blot analysis of SERPINA1 and epithelial–mesenchymal transition-related protein expression in B-CPAP cells. (K) The expression profile of integrin αvβ3. Scale bars (E & F) = 50 μm. Scale bars (G & K) = 100 μm. n = 3.
*p < 0.05; **p < 0.01 (one-way analysis of variance).
HPAA: Hyperbranched polyamidoamine; NC: Negative control; ns: Not significant.
In vivo experiments to explore the effect of HPAA-RGD/si-circICA1 on epithelial–mesenchymal transition
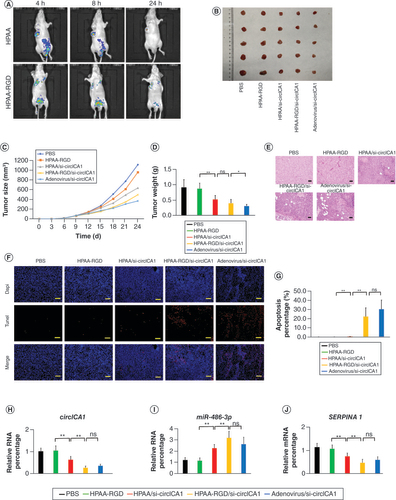
To further investigate the impact of HPAA-RGD/si-circICA1 on tumor cell EMT, we subcutaneously injected B-CPAP cells (3 × 10⁶ cells) into nude mice, followed by injections of PBS, HPAA-RGD, HPAA/si-circICA1, HPAA-RGD/si-circICA1 and adenovirus/si-circICA1 twice a week for 2 weeks. In vivo imaging was conducted after 4, 8 and 24 h of intravenous administration to assess the distribution of nanomaterials in the nude mice. The results indicate that compared with HPAA alone, HPAA-RGD loaded with si-circICA1 more efficiently delivers si-circICA1 to the tumor tissue (A). After 2 weeks of treatment, the mice were euthanized and the tumor tissues were dissected to measure tumor volume and weight (B–D). The in vivo tumor formation experiments demonstrated significant inhibition of tumor growth in the HPAA-RGD/si-circICA1 group compared with the PBS, HPAA-RGD and HPAA/si-circICA1 groups. Terminal deoxynucleotidyl transferase dUTP nick end labeling and hematoxylin and eosin staining analyses of the tumor tissues from each group indicated a significantly higher level of apoptosis in the HPAA-RGD/si-circICA1 group compared with the other groups (E–G). Moreover, qRT-PCR analysis revealed a significant decrease in the expression of circICA1 and SERPINA1, along with a significant increase in miR-486-3p expression, in the HPAA-RGD/si-circICA1 group compared with the other groups (H–J). Consistent results were observed in the WB experiments and immunofluorescence analysis of SERPINA1 (Supplementary Figure 4F & G). Furthermore, hematoxylin and eosin staining of the heart, liver, spleen, lung and kidney of mice showed no significant toxicity caused by the nanomaterials (Supplementary Figure 5). The in vivo experiments provided compelling evidence that HPAA-RGD/si-circICA1 effectively inhibited tumor growth, induced apoptosis and modulated the expression of circICA1, miR-486-3p and SERPINA1 in tumor tissues. Additionally, the nanomaterials did not exhibit significant toxicity to vital organs, ensuring their biocompatibility in the tested mouse model.
(A) In vivo imaging of nude mice. (B–D) Representative images, volume and weight of the tumors. (E) Hematoxylin and eosin staining of tumor samples. Scale bars = 200 μm. (F & G) Terminal deoxynucleotidyl transferase dUTP nick end labeling staining results of tumor tissues. Scale bars = 200 μm. (H & I) qRT-PCR results for circICA1, miR-486-3p and SERPINA1 from B-CPAP cells. Scale bars = 200 μm. n = 3 or 5.
*p < 0.05; **p < 0.01 (one-way analysis of variance).
HPAA: Hyperbranched polyamidoamine; ns: Not significant; PBS: Phosphate-buffered saline.
Discussion
PTC is a prevalent and significant disease in the head and neck region, increasingly encountered in general surgery clinics [Citation1]. Accurate diagnosis and treatment of thyroid nodules, distinguishing between benign and malignant cases, poses challenges for thyroid surgeons [Citation4]. The lack of standardized guidelines further complicates the choice of diagnostic methods and treatment strategies [Citation32]. In this study, we propose a novel and accurate method for detecting metastatic PTC, offering a potential target for gene therapy in PTC treatment.
Previous studies have highlighted the regulatory role of specific miRNAs in PTC cells, targeting related genes to modulate cell activity and function. In our investigation, we identified miR-486-3p as a key miRNA involved in PTC metastasis. Analysis of metastatic PTC tissues revealed a significant negative correlation between miR-486-3p expression levels and metastasis. We further explored the impact of miR-486-3p on the downstream gene SERPINA1. SERPINA1, belonging to the serpin family, is primarily synthesized in the liver but is also produced in certain tumor cells, including gastric, colon and lung cancer cells [Citation33]. SERPINA1 is a protein known to influence cellular processes such as apoptosis and EMT [Citation34]. The differential expression of EMT markers (Snail, E-cadherin, N-cadherin, fibronectin and vimentin) further highlights the multifaceted role of circICA1/miR-486-3p in regulating these processes. miR-486-3p binds to the 3′ untranslated region of SERPINA1 mRNA, leading to the degradation of SERPINA1 mRNA.
CircRNAs, functioning as miRNA sponges, are widely distributed in mammalian cells [Citation35]. Their unique structural characteristics confer enhanced stability to circRNAs in animal body fluids [Citation36]. Through qRT-PCR and RNA-FISH assays, we confirmed the abundant presence of circICA1 in PTC cells. Dual-luciferase experiments validated the regulatory axis involving circICA1, miR-486-3p and SERPINA1. circICA1 serves as an miRNA sponge, sequestering miR-486-3p and relieving its binding to SERPINA1, consequently promoting SERPINA1 expression.
Our study indicates that the circICA1–miR-486-3p axis regulates the apoptosis levels of B-CPAP cells. While the increase in apoptosis may contribute to the reduction in proliferation, invasion, migration and wound healing, it cannot fully explain all the observed effects. Based on our experimental experience, we suggest that the quantification steps involved in WB, which provide relative protein expression levels, may offer a degree of robustness against variations in cell numbers. This could potentially mitigate the impact of changes in apoptosis levels on the overall protein expression analysis, although further studies are needed to confirm this observation. It is crucial to emphasize that SERPINA1, Snail, N-cadherin, vimentin, fibronectin and E-cadherin play crucial roles in the EMT process. The alterations in their expression contribute to the modulation of B-CPAP cell migration and invasion. Therefore, we propose that the circICA1–miR-486-3p axis not only affects apoptosis but also influences cell migration and invasion, demonstrating its multifaceted nature. This versatility underscores the complex role of this molecular axis in tumor development.
However, intravenously injected circICA1 has limited stability in the bloodstream and lacks specific targeting of PTC cells [Citation37]. Thus, the development of a delivery system capable of transporting circICA1 to PTC tissues assumes great importance. Integrins, transmembrane glycoproteins involved in cell adhesion and signal transmission, hold promise in this regard [Citation38]. Integrin αvβ3, among the 24 identified types, exhibits specific recognition of RGD tripeptide sequences [Citation39]. Notably, integrin αvβ3 is overexpressed in PTC [Citation40]. To enhance nanoparticle targeting, we designed RGD-modified HPAA, serving as a tumor-targeting ligand by specifically binding to αvβ3 integrin receptors. Intravenous injection of HPAA-RGD/si-circICA1 utilizes the GSH-targeting function of RGD to effectively explore PTC cells. Under the influence of GSH, the disulfide bond in the material undergoes fracture, resulting in material disintegration and the subsequent release of si-circICA1. This targeted approach effectively addresses the limitations of current PTC treatment and offers a promising therapeutic strategy.
In addition, our study revealed that the nontargeted HPAA/si-circICA1 can also inhibit tumor growth. We believe that despite lacking a specific RGD targeting moiety, HPAA/si-circICA1, leveraging its intrinsic positive charge, can interact nonspecifically with B-CPAP cells. This interaction allows for the efficient delivery of si-circICA1 into B-CPAP cells, promoting the anticipated therapeutic effects and inhibiting tumor growth. However, our results indicate no significant difference in tumor weight between HPAA-RGD/si-circICA1 (targeted) and HPAA/si-circICA1 (non-targeted) groups. Upon detailed scrutiny of the data, we noted that the tumor weights in the HPAA/si-circICA1 group were 0.52, 0.59, 0.68, 0.47 and 0.34 g, while those in the HPAA-RGD/si-circICA1 group were 0.61, 0.41, 0.34, 0.35 and 0.31 g. We identified outliers within the groups, particularly the data points at 0.34 and 0.61 g. We acknowledge that these variations might be attributed to experimental variability or errors.
Conclusion
Our research demonstrates the promising potential of RGD-modified HPAA loaded with si-circICA1 as a treatment strategy for PTC. This study illuminates the complex interactions among circICA1, miR-486-3p and SERPINA1 in the metastasis of PTC cells. The targeting of circICA1 and SERPINA1 by our proposed system offers valuable insights into new therapeutic avenues for PTC. Our findings underscore the importance of developing drug-delivery systems that not only effectively treat tumors but also minimize collateral damage to surrounding healthy tissues.
Future perspective
Moving forward, it is essential to continue this line of research to further refine our understanding and application of this treatment strategy. While the non-targeted adenovirus system exhibits broad cellular penetration, its mechanism of action differs significantly from the HPAA-RGD targeted system, which demonstrates reduced biotoxicity to normal tissues alongside similar therapeutic effects. We remain optimistic about these findings and their implications for future PTC treatment strategies. Further investigations, including in vivo studies and clinical trials, are warranted to develop this innovative approach, ultimately aiming to enhance PTC treatment and improve patient outcomes.
miR-486-3p and circICA1 play pivotal roles in thyroid cancer progression.
Enhanced expression of miR-486-3p suppresses thyroid cancer cell proliferation and invasion.
si-circICA1 delivered via a hyperbranched polyamidoamine–RGD peptide (HPAA-RGD) demonstrates potential as an effective antimetastatic therapy.
The study provides insights into the complex regulatory network of thyroid cancer.
Nanoscale drug-delivery systems like HPAA-RGD enhance siRNA-based therapies’ efficacy.
The research paves the way for more targeted and effective treatments for thyroid cancer patients.
The findings underline the importance of circRNA–miRNA interactions in cancer biology.
circICA1 serves as a miRNA sponge, sequestering miR-486-3p and relieving its binding to SERPINA1, consequently promoting SERPINA1 expression.
Author contributions
Conceptualization: S Dong and X Xie. Methodology: S Dong, Q Xia, J Pan, X Du and Y Wu. Software: S Dong and Q Xia. Data curation: X Xie. Writing – original draft preparation: X Xie. Writing – review and editing: X Xie. Supervision: X Xie. Project administration: X Xie. Funding acquisition: S Dong.
Writing disclosure
No writing assistance was utilized in the production of this manuscript.
Ethical conduct of research
The study procedure was approved by the Ethics Committee of the First Affiliated Hospital of Zhejiang University School of Medicine (no. 2019.793). Informed consent for collecting medical information was obtained from all patients at their visit.
Supplemental Figure 1
Download TIFF Image (2.2 MB)Supplemental Figure 2
Download TIFF Image (2 MB)Supplemental Figure 3
Download TIFF Image (1.6 MB)Supplemental Figure 4
Download TIFF Image (2.6 MB)Supplemental Figure 5
Download TIFF Image (2.4 MB)Supplemental Information 1
Download MS Word (13.5 KB)Supplemental Information 2
Download MS Word (18.9 KB)Supplemental Information 3
Download MS Word (13.5 KB)Supplementary data
To view the supplementary data that accompany this paper please visit the journal website at: www.futuremedicine.com/doi/suppl/10.2217/nnm-2023-0211
Financial disclosure
This study was supported by the Foundation of the Natural Science Foundation of Zhejiang Province (no. LY21H160020). The authors have no other relevant affiliations or financial involvement with any organization or entity with a financial interest in or financial conflict with the subject matter or materials discussed in the manuscript apart from those disclosed. This includes employment, consultancies, honoraria, stock ownership or options, expert testimony, grants or patents received or pending, or royalties.
Competing interests disclosure
The authors have no competing interests or relevant affiliations with any organization or entity with the subject matter or materials discussed in the manuscript. This includes employment, consultancies, honoraria, stock ownership or options, expert testimony, grants or patents received or pending, or royalties.
Additional information
Funding
References
- Roman BR , Morris LG , Davies L . The thyroid cancer epidemic, 2017 perspective. Curr. Opin. Endocrinol. Diabetes Obes. 24(5), 332–336 (2017).
- Seib CD , Sosa JA . Evolving understanding of the epidemiology of thyroid cancer. Endocrinol. Metab. Clin. North Am. 48(1), 23–35 (2019).
- Coca-Pelaz A , Shah JP , Hernandez-Prera JC et al. Papillary thyroid cancer – aggressive variants and impact on management: a narrative review. Adv. Ther. 37(7), 3112–3128 (2020).
- Prete A , Borges De Souza P , Censi S , Muzza M , Nucci N , Sponziello M . Update on fundamental mechanisms of thyroid cancer. Front. Endocrinol. 11, 102 (2020).
- Bergdorf K , Ferguson DC , Mehrad M , Ely K , Stricker T , Weiss VL . Papillary thyroid carcinoma behavior: clues in the tumor microenvironment. Endocr. Relat. Cancer 26(6), 601–614 (2019).
- Abdullah MI , Junit SM , Ng KL , Jayapalan JJ , Karikalan B , Hashim OH . Papillary thyroid cancer: genetic alterations and molecular biomarker investigations. Int. J. Med. Sci. 16(3), 450–460 (2019).
- Navas-Carrillo D , Rodriguez JM , Montoro-Garcia S , Orenes-Pinero E . High-resolution proteomics and metabolomics in thyroid cancer: deciphering novel biomarkers. Crit. Rev. Clin. Lab. Sci. 54(7–8), 446–457 (2017).
- Liang L , Zheng X , Hu M et al. miRNA-221/222 in thyroid cancer: a meta-analysis. Clin. Chim. Acta 484, 284–292 (2018).
- Blumberg A , Zhao Y , Huang YF et al. Characterizing RNA stability genome-wide through combined analysis of PRO-seq and RNA-seq data. BMC Biol. 19(1), 30 (2021).
- Patop IL , Wust S , Kadener S . Past, present, and future of circRNAs. EMBO J. 38(16), e100836 (2019).
- Sproviero D , Gagliardi S , Zucca S et al. Different miRNA profiles in plasma derived small and large extracellular vesicles from patients with neurodegenerative diseases. Int. J. Mol. Sci. 22(5), 2737 (2021).
- Li J , Mohammed-Elsabagh M , Paczkowski F , Li Y . Circular nucleic acids: discovery, functions and applications. Chembiochem 21(11), 1547–1566 (2020).
- Yu T , Wang Y , Fan Y et al. CircRNAs in cancer metabolism: a review. J. Hematol. Oncol. 12(1), 90 (2019).
- Su Y , Feng W , Shi J , Chen L , Huang J , Lin T . circRIP2 accelerates bladder cancer progression via miR-1305/Tgf-beta2/Smad3 pathway. Mol. Cancer 19(1), 23 (2020).
- Sang Y , Chen B , Song X et al. circRNA_0025202 regulates tamoxifen sensitivity and tumor progression via regulating the miR-182-5p/FOXO3a axis in breast cancer. Mol. Ther. 27(9), 1638–1652 (2019).
- Ju HQ , Zhao Q , Wang F et al. A circRNA signature predicts postoperative recurrence in stage II/III colon cancer. EMBO Mol. Med. 11(10), e10168 (2019).
- Liu H , Lan T , Li H et al. Circular RNA circDLC1 inhibits MMP1-mediated liver cancer progression via interaction with HuR. Theranostics 11(3), 1396–1411 (2021).
- Khan H , Mirzaei HR , Amiri A , Kupeli Akkol E , Ashhad Halimi SM , Mirzaei H . Glyco-nanoparticles: new drug delivery systems in cancer therapy. Semin. Cancer Biol. 69, 24–42 (2021).
- Kaliamurthi S , Selvaraj G , Wei DQ . Emerging trends on nanoparticles and nano-materials in biomedical applications – I. Curr. Pharm. Des. 25(13), 1441–1442 (2019).
- Liu Z , Lin X , Liu X et al. Magnetic nanoparticles modified with hyperbranched polyamidoamine for the extraction of benzoylurea insecticides prior to their quantitation by HPLC. Mikrochim. Acta 186(6), 351 (2019).
- Gild ML , Tsang VHM , Clifton-Bligh RJ , Robinson BG . Multikinase inhibitors in thyroid cancer: timing of targeted therapy. Nat. Rev. Endocrinol. 17(4), 225–234 (2021).
- Cabanillas ME , Ryder M , Jimenez C . Targeted therapy for advanced thyroid cancer: kinase inhibitors and beyond. Endocr. Rev. 40(6), 1573–1604 (2019).
- Rianna C , Kumar P , Radmacher M . The role of the microenvironment in the biophysics of cancer. Semin. Cell Dev. Biol. 73, 107–114 (2018).
- Lan H , Zhang W , Jin K , Liu Y , Wang Z . Modulating barriers of tumor microenvironment through nanocarrier systems for improved cancer immunotherapy: a review of current status and future perspective. Drug Deliv. 27(1), 1248–1262 (2020).
- Lindemann WR , Mijalis AJ , Alonso JL et al. Conformational dynamics in extended RGD-containing peptides. Biomacromolecules 21(7), 2786–2794 (2020).
- Davis PJ , Mousa SA , Schechter GP , Lin HY . Platelet ATP, thyroid hormone receptor on integrin alphavbeta3 and cancer metastasis. Horm. Cancer 11(1), 13–16 (2020).
- Lobeek D , Franssen GM , Ma MT et al. In vivo characterization of 4 68Ga-labeled multimeric RGD peptides to image alphavbeta3 integrin expression in 2 human tumor xenograft mouse models. J. Nucl. Med. 59(8), 1296–1301 (2018).
- Zhu K , Guo C , Lai H , Yang W , Wang C . Novel hyperbranched polyamidoamine nanoparticle based gene delivery: transfection, cytotoxicity and in vitro evaluation. Int. J. Pharm. 423(2), 378–383 (2012).
- Lee S , Eom Y , Park J , Lee J , Kim SY . Micro-hydrogel particles consisting of hyperbranched polyamidoamine for the removal of heavy metal ions from water. Sci. Rep. 7(1), 10012 (2017).
- Wu F , Lin X , Shan SK et al. The suppression of miR-199a-3p by promoter methylation contributes to papillary thyroid carcinoma aggressiveness by targeting RAP2a and DNMT3a . Front. Cell Dev. Biol. 8, 594528 (2020).
- Swierniak M , Wojcicka A , Czetwertynska M et al. In-depth characterization of the microRNA transcriptome in normal thyroid and papillary thyroid carcinoma. J. Clin. Endocrinol. Metab. 98(8), E1401–1409 (2013).
- Pemayun TG . Current diagnosis and management of thyroid nodules. Acta Med. Indones. 48(3), 247–257 (2016).
- Basyte-Bacevice V , Skieceviciene J , Valantiene I et al. SERPINA1 and HSD17B13 gene variants in patients with liver fibrosis and cirrhosis. J. Gastrointestin. Liver Dis. 28(3), 297–302 (2019).
- Bashir A , Shah NN , Hazari YM et al. Novel variants of SERPIN1A gene: interplay between alpha1-antitrypsin deficiency and chronic obstructive pulmonary disease. Respir. Med. 117, 139–149 (2016).
- Huang A , Zheng H , Wu Z , Chen M , Huang Y . Circular RNA–protein interactions: functions, mechanisms, and identification. Theranostics 10(8), 3503–3517 (2020).
- Liu Z , Zhou Y , Liang G et al. Circular RNA hsa_circ_001783 regulates breast cancer progression via sponging miR-200c-3p. Cell Death Dis. 10(2), 55 (2019).
- Hirbod S , Nafisi S , Maibach HI . RNA loading on nano-structured hyperbranched beta-cyclodextrin. Avicenna J. Med. Biotechnol. 10(1), 15–21 (2018).
- Green HJ , Brown NH . Integrin intracellular machinery in action. Exp. Cell Res. 378(2), 226–231 (2019).
- Chen Y , Lee H , Tong H , Schwartz M , Zhu C . Force regulated conformational change of integrin αVβ3. Matrix Biol. 60–61, 70–85 (2017).
- Mousa SA , Glinsky GV , Lin HY et al. Contributions of thyroid hormone to cancer metastasis. Biomedicines 6(3), 89 (2018).