
Abstract
Aim: NAT2 genotype is an indicator for isoniazid dosage adjusting for tuberculosis treatment. Multicolor melting curve analysis (MMCA) was evaluated as a potential method for NAT2 genotyping. Materials & methods: 352 blood samples were analyzed by MMCA kit (Zeesan Biotech Co., Xiamen, China) targeting NAT2 SNPs at T341C, C481T, G590A and G857A, and direct sequencing was used as control. Results: The sensitivity, specificity and accuracy of the MMCA assay for rapid NAT2 genotype detection were 97.9, 99.6 and 99.1% respectively, whereas for intermediate genotypes the values were 99.5, 98.7 and 99.1%, respectively, and for slow genotypes the values were 100% for the three aspects. The 24 saliva and blood for the control samples were also successfully analyzed using the MMCA assay, both produced uniform outcomes. Conclusion: The MMCA assay described in our study is very promising for the efficient determination of NAT2 genotype, and can facilitate the personalized dosing of isoniazid.
Tuberculosis (TB) is one of the most common infectious diseases and it remains a serious threat to public health despite global awareness and control programs [Citation1]. Isoniazid (INH), the main first-line anti-TB drug, has excellent curative effect and low price. The drug is mainly metabolized by arylamine N-acetyltransferase 2 (NAT2) in vivo [Citation2,Citation3]. The NAT2 gene polymorphisms, classify the individuals into three groups that is, the rapid-, intermediate- and slow acetylators [Citation4,Citation5]. Previous studies have demonstrated that plasma INH concentrations of patients with different NAT2 acetylation status show significant variation. The rapid acetylation patients maintained the lowest level of plasma INH concentration which may cause treatment failure; the slow acetylation patients maintained the highest level of plasma drug concentration that can frequently cause liver injury; while the intermediate acetylation patients maintained medium drug concentration in the plasma [Citation3,Citation6]. Hence, the identification of NAT2 genotype for the TB patients is important before commencing the INH-based treatment regimen. Adjusting the INH dosage according to the NAT2 genotype is a feasible measure for efficacy during medical care.
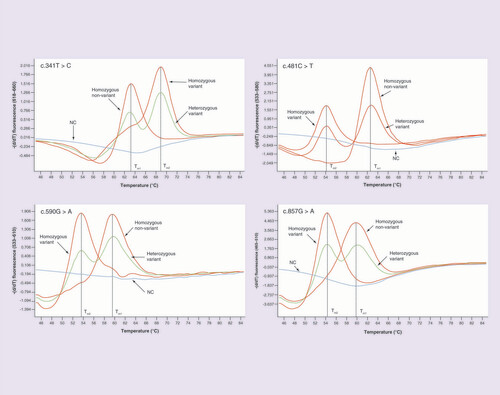
The change in melting curve shape caused by nucleotide exchange was demonstrated. Each line indicates the melting curve for homozygous nonvariant (red line, Tm1), heterozygous variant (green line, with the exception of the heterozygous variant of c.481C>T), homozygous variant (red line, Tm2) and NC (blue line).
NC: Negative control.
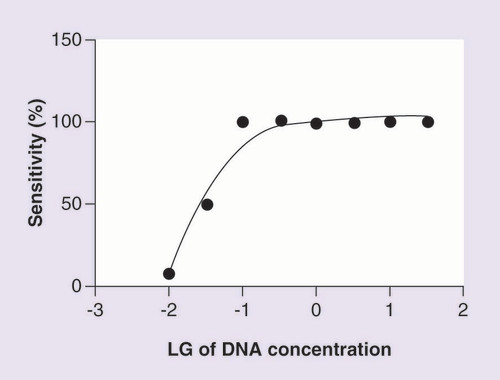
x-axis indicates the logarithm of DNA concentration (ng/µl); the sensitivity was evaluated by calculating the PCR reaction successful rate for DNA samples with different concentrations.
LG: log10.
The NAT2 gene encodes for a Phase II detoxification enzyme and has over 100 NAT2 allelic variants, identified in various human populations to date according to the NAT website ([Citation7]) [Citation8]. Among other polymorphisms in the NAT2 open reading frame, SNPs at seven different sites of the exon are considered having a most serious phenotypic effect on N-acetylation activity: the SNPs rs1801279 (c.191G>A), rs1041983 (c.282C>T), rs1801280 (c.341T>C), rs1799929 (c.481C>T), rs1799930 (c.590G>A), rs1208 (c.803A>G) and rs1799931 (c.857G>A). The NAT2 genotypes are categorized as either rapid or slow ones depending on the SNP combinations on the same chromosome and results from in vitro and in vivo experiments [Citation3,Citation9,Citation10]. In turn, this categorization is used to identify slow (two slow haplotypes), intermediate (one rapid and one slow haplotype) and rapid (two rapid haplotypes) genotypes of NAT2 [Citation9,Citation11–13]. In theory, the commonly used seven NAT2 SNPs could produce 128 possible genotypes but in practice, the polymorphic loci in high linkage disequilibrium can greatly reduce the number of observed genotypes. The aforementioned seven NAT2 SNPs define well-characterized haplotypic groups, commonly encountered in human populations. Thus, using the seven SNPs panel to infer NAT2 genotype and phenotype is recognized as an appropriate strategy for diagnostic purposes [Citation8].
Deriving the genotype from the seven SNPs by DNA sequencing is still considered as the gold standard for NAT2 genotyping [Citation5,Citation9,Citation14]. Despite its advantages, automated Sanger sequencing remains more complicated and expensive, compared with PCR-based genotyping methods of a limited set of SNPs. Therefore, we sought to evaluate the multicolor melting curve analysis (MMCA) method to analyze the four most common SNP sites, in NAT2, c.341T>C, c.481C>T, c.590G>A and c.857G>A, in Chinese individuals. The NAT2 genotype of patients can be identified by the composite analysis of the nonvariant and variant for these four SNPs with different Tm values and the formation of different melting curves. The performance of the four SNPs MMCA assay was also compared with the gold standard for NAT2 genotyping. Since the MMCA is a rapid, simple and highly efficient method for SNP detection, it can be adopted by the clinical laboratories for improved and personalized INH dose administration.
Materials & methods
Ethical statement
This study was approved by the Ethics Committee of Beijing Chest Hospital (Beijing, China). All the patients and healthy volunteers enrolled in this study signed written consent forms.
Sample collection
Peripheral blood samples were collected in heparin–lithium–anticoagulant tubes from 352 TB patients who visited Beijing Chest Hospital during April–August 2015. Both saliva samples and peripheral blood samples from 24 healthy volunteers were also collected during the study period.
DNA extraction
Genomic DNA from the peripheral blood samples was extracted using the BloodGen Mini Kit (Cwbiotech, Beijing, China). The extracted DNA was used as the template for PCR sequencing and the MMCA assay. Quantity and quality of DNA samples was measured using Nanodrop® 2000C (Thermo Scientific, MA, USA). DNA from saliva samples was extracted using a boiling method. More specifically, 1 ml saliva samples were centrifuged at 12,000 rpm for 2 min followed by washing once with 1 ml saline, boiling with 0.5 ml saline at 95°C for 20 min. After centrifugation, the supernatant was collected as the template DNA for MMCA assay.
PCR conditions for MMCA assay
The MMCA PCR was done using a kit developed by Zeesan Biotech Co., Xiamen, China. MMCA assay was performed for the analysis of four SNPs in rs1801280 (c.341T>G), rs1799929 (c.481C>T), rs1799930 (c.590G>A) and rs1799931 (c.857G>A) positions in an 870-bp long coding region of NAT2. Totally four differently colored fluorophores were used in this kit, including CY5, FAM, ROX and HEX. The PCR and melting curve analysis were performed on a lightcycler® 480 instrument (Roche Diagnostics, Basel, Switzerland). The assay was performed in a total volume of 25 μl using 19.6 μl of PCR master mix (with probe primers and dNTPs), 0.4 μl of 2U Taq and 5 μl of template DNA as recommended by the manufacturer. PCR was initiated by 10 min of denaturation–activation at 95°C, followed by 10 cycles at 95°C for 15 s (denaturation), 70°C for 15 s with 1°C decrease per cycle until the temperature reached 60°C, extension at 76°C for 20 s, then another 50 cycles of denaturation at 95°C for 15 s, annealing at 60°C for 15 s and extension at 76°C for 20 s were performed. The melting program included three steps: denaturation at 95°C for 1 min, follow by renaturation at 35°C for 3 min and a continuous reading of fluorescence from 45 to 85°C by heating at increments of 0.03°C/s. The MMCA curve was analyzed using the Lightcycler® 480 software release 1.5.0 SP3. In this experiment, homozygous nonvariant template and pure water were used as positive and negative controls, respectively.
The sensitivity of MMCA was determined by the following procedure: a DNA sample was firstly diluted to 30 ng/µl, then the sample were serially diluted (1:2) with ddH2O to the concentration of 0.01 ng/µl. Twelve PCR reactions were performed for each of the eight concentrations obtained, and a 5 µl aliquot was added to each PCR reactions. The sensitivity was evaluated by calculating the PCR reaction successful rate.
PCR amplification for DNA sequencing
For DNA sequencing, an 823 bp fragment of the NAT2 gene (819–1641 bp of the gene code) was amplified using the forward primer 5′-GGGCTGTTCCCTTTGAGA-3′ and reverse primer 5′-TAGTGAGTTGGGTGATAC-3′. Each 20 μl PCR mixture contained 10 μl HiFi PCR mix (Transgen, Beijing, China), 0.5 μl of each of the forward and reverse primers from 10 μM stocks, 8 μl double distilled water and 1 μl DNA template. PCR was performed with initial denaturation at 95°C for 5 min followed by 30 cycles of denaturation at 95°C for 30 s, annealing at 55°C for 30 s and extension at 72°C for 1 min, with an additional extension at 72°C for 10 min. PCR products were analyzed on 1.5% agarose gels to confirm size of product which was then sequenced with the same primers as the PCR at a commercial sequencing company (TSINGKE Biological technology, Beijing, China).
Statistical analysis
The statistical analysis was performed using SPSS v12.0 (SPSS Inc., IL, USA). The sensitivity, specificity and accuracy of MMCA method to identify the NAT2 genotype of TB patients were verified and evaluated in comparison with PCR and direct sequencing method.
Results
MMCA method designed to analyze four SNPs of NAT2
The peak pattern of melting curve with different Tm values for nonvariant or variant SNPs are shown in . The MMCA assay was considered successful since the melting curve of the four channels from the positive control was presented as homozygous nonvariant whereas smooth amplified curves were observed for the negative control. One of the representative melting curves from MMCA analysis is shown in . The deviation in the Tm value and the shape of melting curves for the tested patient samples, in contrast with the positive control, is caused by the nucleotide exchange in the specific SNP site. If only a nonvariant peak or a variant peak appeared then the tested sample was identified as a homozygous nonvariant or homozygous variant, respectively, and if both appeared in the melting curve then the tested sample was identified as a heterozygous variant in the specific SNP site. The minimal amount of DNA needed for MMCA reaction was 0.5 µg, and a curve was drew according to the sensitivity analytic assay ().
Four SNPs MMCA assay to identify the NAT2 genotype of TB patients
The interpretation standard for the four SNPs MMCA assay and the frequencies of each genotype are shown in . The genotypes and the deduced phenotypes of NAT2 were identified according to the nomenclature listed on the NAT2 Alleles Nomenclature homepage [Citation7,Citation8].
Comparison of MMCA method with direct sequencing
According to the direct sequencing and analysis of the seven SNP sites, the NAT2 genotypes of 352 TB patients consisted of 27.6% (97/352) rapid acetylators, 55.1% (194/352) intermediate and 17.3% (61/352) slow acetylators. For direct sequencing method, NAT2 genotype analysis only considered the four SNPs included in the MMCA which had perfect concordance with the seven-SNP analysis. The four-SNP MMCA assay was directly compared with the seven-SNP analysis postsequencing method to calculate the sensitivity, specificity and accuracy (). The sensitivity, specificity and accuracy of MMCA method for the rapid acetylator NAT2 genotypes were 97.9 (95/97), 99.6 (254/255) and 99.1% (348/352), respectively, and 99.5 (193/194), 98.7 (156/158) and 99.1% (349/352) for the intermediate acetylator genotypes and 100 (61/61), 100 (291/291) and 100% (352/352) for slow acetylator genotypes, respectively. The overall accuracy of the four-SNP MMCA method for NAT2 genotyping was 99.1% (349/352).
MMCA of NAT2 genotype using saliva samples
Saliva samples from the 24 healthy volunteers were also successfully analyzed with the MMCA assay. The results derived from these samples were completely consistent with the blood samples from respective individuals.
Discussion & conclusion
Early in the 1960s, the polymorphism of NAT2 was reported to have association with INH neurotoxicity due to their effect on variability in N-acetylation capacity [Citation15]. Other than INH, many aromatic amine drugs are also affected by the acetylation polymorphism [Citation16,Citation17]. The studies conducted in east-Asian population showed a significantly higher risk of INH-induced hepatotoxicity in slow acetylators with odds ratios of 3.10, 3.18 and 4.70 in different studies. Furthermore, many clinical and observational studies confirmed that NAT2 genotype-guided dosing of INH resulted in lower incidences of antituberculosis drug-induced hepatotoxicity (ATDH) or early treatment failure than the conventional standard regimen [Citation18–21]. Hence, the literature indicates a straightforward correlation between NAT2 genotype and phenotype, suggesting that determination of NAT2 genotype could be an accurate way to infer the acetylator phenotype of individuals treated with INH [Citation3,Citation22].
The distribution of NAT2 polymorphisms is highly diverse among various populations. For instance, the Western populations show a significantly higher percentage of slow acetylator genotypes (40–70%) [Citation23–25], while the prevalence of the NAT2 slow acetylator genotypes is 15–20% in Chinese and Japanese populations [Citation26–28]. According to our seven-SNP analysis postsequencing outcomes, the NAT2 genotypes of 352 TB patients consisted of 27.6% rapid acetylators, 55.1% intermediate and 17.3% slow acetylators. The frequency of rapid, intermediate, slow acetylators and the distribution of NAT2 genotypes in our study are generally similar to previous studies conducted in Chinese population [Citation29]. The results suggest that about 40–50% of the TB patients who are rapid acetylators or slow acetylators in China require an adjusted dosage of INH, thus determination of NAT2 genotype before INH administration is important.
At present, many methods can be used for the identification of gene polymorphisms, such as PCR–HPLC method, reverse dot blot and direct sequencing. Despite being the gold standard for all other methods, DNA sequencing is complicated and requires expensive equipment which decreases its feasibility for a clinical laboratory. Although the PCR–HPLC is affordable and easy-to-apply, but the specificity and sensitivity of this method are not ideal, thus it is not suitable for large-scale sample testing. MMCA detects the mutations using multiple dual labeled, self-quenched probes each labeled with differently colored fluorophore [Citation30,Citation31], proved to be a rapid, reliable and efficient approach for the detection of multiple SNPs in a single reaction tube [Citation32–34]. What is more, these probes-based MMCA was proven with universal cross-platform compatibility to be performed on different real-time PCR instruments [Citation31]. However, a performance evaluation of an MMCA kit for NAT2 genotyping in TB patients of China has never been performed. Since previous studies had demonstrated that NAT2*12 (0%), NAT2*13 (1%) and NAT2*14 (0%) genotypes were rare in Asian populations [Citation24], a four-SNP panel specific to Asian populations has been assumed to be sufficient for the NAT2 genotyping of Chinese population. Our results also demonstrated that both four- and seven-SNP assessments had same accuracy if direct sequencing method is used, thus the four-SNP genotype panels can be effectively used instead of the seven-SNP genotype panels for NAT2 phenotype inference in Chinese population. However, it has been reported that in Africa a small amount of people have SNP at site 191 [Citation24], which is not included in this kit. Therefore, when this technique being applied in other international communities, substitutes SNP c.481C>T for SNP c.191G>A (*14) for probe design would be appropriate in some countries, as SNP 481 only been adopted to identify a rapid haplotypes with limited clinical significance.
Four specific fluorescent probes were designed to detect the four SNPs of NAT2 gene, and a total of 29 genotypes were identified in this assay (see ). Three NAT2 genotypes were most common: NAT2*4 was present in about 52.63%, NAT2*6 in about 23.45% and NAT2*7 in about 16.15% of the tested TB patients. Compared with the genotype analysis based on the seven SNPs analysis postsequencing method, the NAT2 phenotypes inference (using the four SNPs MMCA assay) showed high accuracy. In our study, all the rapid acetylators had NAT2*4/NAT2*4 genotypes, while the NAT2*6 genotypes and NAT2*7 genotypes were most frequent in slow acetylators.
Two rapid acetylators with NAT2*4/NAT2*4 genotype were misclassified as intermediate acetylators, and one intermediate acetylator with NAT2*6/NAT2*4 genotype was misclassified as a rapid acetylator in this assay. The occurrence of the above misclassifications was related to mislabel, which made the MMCA method obtain perfect sensitivity and specificity comparing with direct DNA sequencing.
Besides blood samples that are commonly tested, we found that saliva samples can be used readily for the MMCA assay, since parallel tests produced highly consistent outcomes for blood and saliva samples. Noninvasive sample collection method will increase the willingness of the subjects for undergoing such tests. Additionally, as 96-well plates can be used in MMCA, the method can be adjusted for high-throughput screening of samples, facilitating its clinical application. Furthermore, the whole procedure, including DNA preparation, only takes 2.5 h, which makes a rapid NAT2 genotype test more feasible before launching an INH containing regimen. Reproducibility of MMCA had been evaluated by repeating the assays with different samples or with same sample for multiple times, they all produced uniform outcomes (data not shown), which clarified the clinical usage potential of this method.
In conclusion, the NAT2 genotyping method by MMCA has the advantages of being rapid, simple, high performance and high throughput. The present study demonstrates that these four SNPs MMCA assay can be easily implemented in clinical laboratories with high sensitivity, specificity and accuracy to infer the NAT2 phenotype in TB patients in China.
Table 1. Tm value of each variant amplicon analyzed for the interpretation of nonvariant or variant.
Table 2. NAT2 genotype confirmed by multicolor melting curve analysis method and frequencies of different NAT2 genotype in the present study.
Table 3. Sensitivity, specificity and accuracy of the multicolor melting curve analysis assay in comparison with direct sequencing.
Introducing a rapid, simple and reliable method for NAT2 genotyping, which can facilitate the personalized dosing of isoniazid for tuberculosis treatment.
Multicolor melting curve analysis (MMCA) in this assay can detect both blood and saliva samples efficiently, indicating it could be readily adopted by the clinical laboratories.
Our data demonstrated that about half of the Chinese tuberculosis patients should adjust the isoniazid doses according to their NAT2 genotypes, so as to increase the treatment efficiency and decrease the side effect.
Ethical conduct of research
The authors state that they have obtained appropriate institutional review board approval or have followed the principles outlined in the Declaration of Helsinki for all human or animal experimental investigations. In addition, for investigations involving human subjects, informed consent has been obtained from the participants involved.
Financial & competing interests disclosure
The work was supported by the research funds from The Infectious Diseases Special Project, Ministry of Health of China (2012ZX1003002-009,2016ZX1003001-12) and The Capital Health Research and Development of Special (2016-2-1041). The authors have no other relevant affiliations or financial involvement with any organization or entity with a financial interest in or financial conflict with the subject matter or materials discussed in the manuscript apart from those disclosed.
No writing assistance was utilized in the production of this manuscript.
Additional information
Funding
References
- World Health Organization . Global tuberculosis report of 2015 ( 2015 ). http://apps.who.int/iris/bitstream/10665/191102/1/9789241565059_eng.pdf?ua=1 .
- Boelsterli UA , LeeKK . Mechanisms of isoniazid-induced idiosyncratic liver injury: emerging role of mitochondrial stress . J. Gastroenterol. Hepatol.29 ( 4 ), 678 – 687 ( 2014 ).
- Zabost A , BrzezinskaS , KozinskaMet al. Correlation of N-acetyltransferase 2 genotype with isoniazid acetylation in Polish tuberculosis patients . BioMed. Res. Int.2013 , 853602 ( 2013 ).
- Bolt HM , SelinskiS , DannappelD , BlaszkewiczM , GolkaK . Re-investigation of the concordance of human NAT2 phenotypes and genotypes . Arch. Toxicol.79 ( 4 ), 196 – 200 ( 2005 ).
- Hein DW . N-acetyltransferase SNPs: emerging concepts serve as a paradigm for understanding complexities of personalized medicine . Expert Opin. Drug Metab. Toxicol.5 ( 4 ), 353 – 366 ( 2009 ).
- Azuma J , OhnoM , KubotaRet al. NAT2 genotype guided regimen reduces isoniazid-induced liver injury and early treatment failure in the 6-month four-drug standard treatment of tuberculosis: a randomized controlled trial for pharmacogenetics-based therapy . Eur. J. Clin. Pharmacol.69 ( 5 ), 1091 – 1101 ( 2013 ).
- Database of arylamine N-acetyltransferases . http://nat.mbg.duth.gr .
- Hein DW , DollMA . Accuracy of various human NAT2 SNP genotyping panels to infer rapid, intermediate and slow acetylator phenotypes . Pharmacogenomics13 ( 1 ), 31 – 41 ( 2012 ).
- Selinski S , BlaszkewiczM , IckstadtK , HengstlerJG , GolkaK . Improvements in algorithms for phenotype inference: the NAT2 example . Curr. Drug Metab.15 ( 2 ), 233 – 249 ( 2014 ).
- Doll MA , ZangY , MoellerT , HeinDW . Codominant expression of N-acetylation and O-acetylation activities catalyzed by N-acetyltransferase 2 in human hepatocytes . J. Pharmacol. Exp. Ther.334 ( 2 ), 540 – 544 ( 2010 ).
- Hein DW , BoukouvalaS , GrantDM , MinchinRF , SimE . Changes in consensus arylamine N-acetyltransferase gene nomenclature . Pharmacogenet. Genomics18 ( 4 ), 367 – 368 ( 2008 ).
- Vatsis KP , WeberWW , BellDAet al. Nomenclature for N-acetyltransferases . Pharmacogenetics5 ( 1 ), 1 – 17 ( 1995 ).
- Hein DW , GrantDM , SimE . Update on consensus arylamine N-acetyltransferase gene nomenclature . Pharmacogenetics10 ( 4 ), 291 – 292 ( 2000 ).
- Walraven JM , ZangY , TrentJO , HeinDW . Structure/function evaluations of single nucleotide polymorphisms in human N-acetyltransferase 2 . Curr. Drug Metab.9 ( 6 ), 471 – 486 ( 2008 ).
- Evans DA , ManleyKA , McKV . Genetic control of isoniazid metabolism in man . Br. Med. J.2 ( 5197 ), 485 – 491 ( 1960 ).
- Weber WW , HeinDW . N-acetylation pharmacogenetics . Pharmacol. Rev.37 ( 1 ), 25 – 79 ( 1985 ).
- Cascorbi I , BrockmollerJ , MrozikiewiczPM , MullerA , RootsI . Arylamine N-acetyltransferase activity in man . Drug Metab. Rev.31 ( 2 ), 489 – 502 ( 1999 ).
- Donald PR , SirgelFA , VenterAet al. The influence of human N-acetyltransferase genotype on the early bactericidal activity of isoniazid . Clin. Infect. Dis.39 ( 10 ), 1425 – 1430 ( 2004 ).
- Ohno M , YamaguchiI , YamamotoIet al. Slow N-acetyltransferase 2 genotype affects the incidence of isoniazid and rifampicin-induced hepatotoxicity . Int. J. Tuberc. Lung Dis.4 ( 3 ), 256 – 261 ( 2000 ).
- Huang YS , ChernHD , SuWJet al. Polymorphism of the N-acetyltransferase 2 gene as a susceptibility risk factor for antituberculosis drug-induced hepatitis . Hepatology35 ( 4 ), 883 – 889 ( 2002 ).
- Ng CS , HasnatA , Al MarufAet al. N-acetyltransferase 2 (NAT2) genotype as a risk factor for development of drug-induced liver injury relating to antituberculosis drug treatment in a mixed-ethnicity patient group . Eur. J. Clin. Pharmacol.70 ( 9 ), 1079 – 1086 ( 2014 ).
- Verhagen LM , CoenenMJ , LopezDet al. Full-gene sequencing analysis of NAT2 and its relationship with isoniazid pharmacokinetics in Venezuelan children with tuberculosis . Pharmacogenomics15 ( 3 ), 285 – 296 ( 2014 ).
- Lin HJ , HanCY , LinBK , HardyS . Ethnic distribution of slow acetylator mutations in the polymorphic N-acetyltransferase (NAT2) gene . Pharmacogenetics4 ( 3 ), 125 – 134 ( 1994 ).
- Sabbagh A , DarluP , Crouau-RoyB , PoloniES . Arylamine N-Acetyltransferase 2 (NAT2) genetic diversity and traditional subsistence: a worldwide population survey . PLoS ONE6 ( 4 ), e18507 ( 2011 ).
- Meyer UA , ZangerUM . Molecular mechanisms of genetic polymorphisms of drug metabolism . Annu. Rev. Pharmacol. Toxicol.37 , 269 – 296 ( 1997 ).
- Kiyohara C , WashioM , HoriuchiTet al. Cigarette smoking, N-acetyltransferase 2 polymorphisms and systemic lupus erythematosus in a Japanese population . Lupus18 ( 7 ), 630 – 638 ( 2009 ).
- Xie HG , XuZH , OuyangDSet al. Meta-analysis of phenotype and genotype of NAT2 deficiency in Chinese populations . Pharmacogenetics7 ( 6 ), 503 – 514 ( 1997 ).
- Hou ZD , XiaoZY , GongY , ZhangYP , ZengQY . Arylamine N-acetyltransferase polymorphisms in Han Chinese patients with ankylosing spondylitis and their correlation to the adverse drug reactions to sulfasalazine . BMC Pharmacol. Toxicol.15 , 64 ( 2014 ).
- Ma QW , LinGF , ChenJGet al. Polymorphism of N-acetyltransferase 2 (NAT2) gene polymorphism in Shanghai population: occupational and non-occupational bladder cancer patient groups . Biomed. Environ. Sci.17 ( 3 ), 291 – 298 ( 2004 ).
- Elenitoba-Johnson KS , BohlingSD , WittwerCT , KingTC . Multiplex PCR by multicolor fluorimetry and fluorescence melting curve analysis . Nat. Med.7 ( 2 ), 249 – 253 ( 2001 ).
- Huang Q , LiuZ , LiaoY , ChenX , ZhangY , LiQ . Multiplex fluorescence melting curve analysis for mutation detection with dual-labeled, self-quenched probes . PLoS ONE6 ( 4 ), e19206 ( 2011 ).
- Xiong F , HuangQ , ChenXet al. A melting curve analysis – based PCR assay for one-step genotyping of beta-thalassemia mutations a multicenter validation . J. Mol. Diagn.13 ( 4 ), 427 – 435 ( 2011 ).
- Liao Y , ZhouY , GuoQet al. Simultaneous detection, genotyping, and quantification of human papillomaviruses by multicolor real-time PCR and melting curve analysis . J. Clin. Microbiol.51 ( 2 ), 429 – 435 ( 2013 ).
- Liu R , LiuZ , XuYet al. Multicolor melting curve analysis-based multilocus melt typing of vibrio parahaemolyticus . PLoS ONE10 ( 9 ), e0136998 ( 2015 ).