Abstract
Conclusion: In the present study, classification of the patterns of 3D CT images of the ductus reuniens (reuniting duct) (RD), saccular duct (SD), and endolymphatic sinus (ES) gave more precise information for assessing the pathological condition of Meniere's disease (MD) than our previous study. Objective: This study attempted to provide more detailed information on MD by classifying the patterns of 3D CT images of the RD, SD, and ES in patients with MD. Methods: We examined the ears of 62 patients with definitely diagnosed unilateral MD based on the criteria of the Committee on Hearing and Equilibrium of the American Academy of Otolaryngology-Head and Neck Surgery (AAO-HNS) using 3D CT. The 3D CT images of bony grooves of RD, SD, and ES (BRD, BSD, and BES) were classified into patterns according to aspects of their patency. Results: BRD could be classified into six types by assessing their patency defined using the criteria in this study. In the ears on the affected side of patients with MD, the BRD, BSD, and BES lost continuity in 3D CT images along their bony routes and were significantly different from normal healthy ears (p < 0.01). There were no significant differences among each stage of MD in the distributions of BRD and BES except for BSD.
Introduction
Many studies have attempted to describe the etiology of Meniere's disease (MD) [Citation1]. Among them, idiopathic endolymphatic hydrops is reported as a pathology of MD [Citation2–4], and the disturbance of longitudinal flow of endolymph is widely thought to be a contributory cause of endolymphatic hydrops [Citation5].
We previously reported that dislodged saccular otoconia can obstruct the ductus reuniens (reuniting duct) (RD), saccular duct (SD), and endolymphatic sinus (ES) in patients with MD, by accessing their images using cone beam three-dimensional CT (3D CT) [Citation6–9]. We determine the conditions of these ducts by visualizing their bony grooves or channels using 3D CT. Because these ducts are lodged in bony grooves, the pathological conditions of the ducts will be reflected in the images of their bony grooves [Citation7].
To determine the patency of these ducts, in a previous study we examined whether 3D CT images showed or did not show continuity of the luminal spaces of these ducts () [Citation9]. When luminal spaces on a 3D CT image were totally absent, the ducts were defined as occluded, and any other states were defined as patent. This strategy was verified using cadaver specimens and was proved to be accurate. It also avoids the reliance on subjective visual evaluation of 3D CT images.
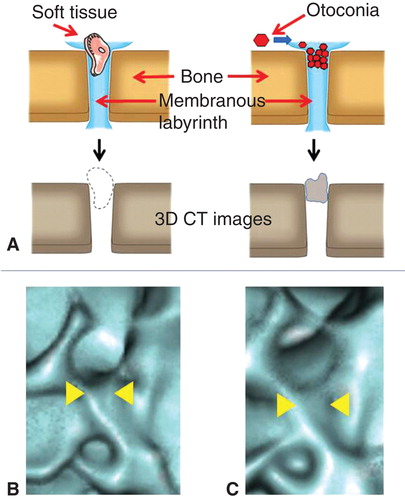
Figure 1. Strategy of 3D CT images for assessing the patency of the bony groove in which the membranous labyrinth lodges. When the non-radiodense substances such as soft tissue dislodges on the membranous labyrinth on the bony groove, the 3D CT image shows the continuity of the bony groove (A, left), but in case of the radiodense substances such as otoconia, the 3D CT image loses the continuity of the bony groove (A, right). (B) 3D CT images of the reuniting duct of cadaver specimen treated with meat fragments and (C) that treated with CaCO3. Note the differences in the continuity of the bony grooves (yellow arrowheads).
However, it can be supposed that there are some degrees of patency of the ducts in MD. MD is categorized into four stages by hearing levels, using the criteria of the Committee on Hearing and Equilibrium of the American Academy of Otolaryngology-Head and Neck Surgery (AAO-HNS) [Citation10]. Our previous strategy [Citation7–9] was effective for making a relatively objective assessment of the condition of these ducts. However, it is not suitable for defining the relationship between each stage of MD and the degree of patency of the ducts.
In the present study we used the same subjects as in the previous study [Citation9], to allow comparison with the present study. We classified the 3D CT images of the ducts based on their occlusion patterns to obtain more precise information on MD, and investigated the relationships between pattern and MD stage.
Material and methods
Subjects
We studied 62 patients (29 males and 33 females; mean age 55.5 years, range 25–86 years). Patients with stage 1, 2, 3, or 4 unilateral MD respectively numbered 18, 8, 27, and 9 (definitely diagnosed using the criteria of the Committee on Hearing and Equilibrium AAO-HNS) and bilateral healthy ears in 13 volunteers (6 males and 7 females, mean age 57.9 years, range 35–79 years) (). Four-frequency pure-tone average (PTA) at 0.5, 1, 2, and 4 kHz were used to calculate PTAs; 3 kHz is not commonly used in Japan, therefore, 4 kHz was substituted for 3 kHz in this study.
Table I. Distribution of the bony groove of the reuniting duct (BRD), saccular duct (BSD), and endolymphatic sinus (BES) of the temporal bones of patients with Meniere's disease and healthy volunteers.
Approval for the study was obtained from the ethics committee of Osaka City University Graduate School of Medicine.
Analysis of CT images
The subjects' temporal bones were examined using 3D cone beam CT (3D Accuitomo) (J. Morita Mfg Corp., Kyoto, Japan) under the same conditions as reported previously [Citation7,9]: 80 kV, 6 mA, voxel 0.125 × 0.125 × 0.125 mm, slice thickness 0.5 mm). CT images were acquired for a column of diameter 6 cm and height 6 cm. Reconstructions of 3D images of the inner ear were obtained using rendering software (IVIEW) in perspective view with a viewing angle of 15° and 0.25 mm voxel size (0.25 × 0.25 × 0.25 mm).
For evaluation of the bony groove of the RD (BRD) (), the orifice of the saccule to RD was assessed based on our previous reports [Citation7,9]. BRD were classified based on their occlusion on the images.
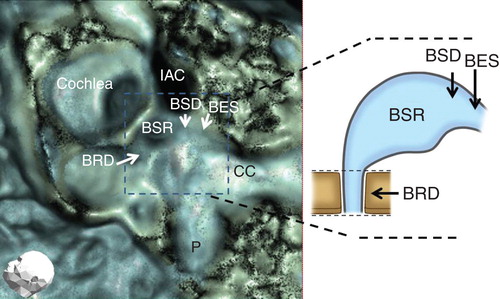
Figure 2. Evaluation points of the temporal bone (arrows). BES, bony groove of endolymphatic sinus; BRD, bony groove of reuniting duct; BSD, bony groove of saccular duct; BSR, bony groove of saccular recess; CC, common crus; IAC, internal auditory canal; P, posterior semicircular canal.
For the evaluation of SD and ES (), patencies were analyzed to assess the luminal space of their bony grooves (BSD and BES). This strategy is thought to be valid based on the previous studies in which the luminal spaces on 3D CT images of grooves covered with CaCO3 were vague but were not vague when covered with meat fragments [Citation7,9].
Statistical analysis
The frequencies of the patterns of 3D CT of BRD, BSD, and BES in the affected side and non-affected side ears of patients with MD and control ears in healthy volunteers were analyzed by Yates m × n and 2 × 2 chi-squared tests.
Results
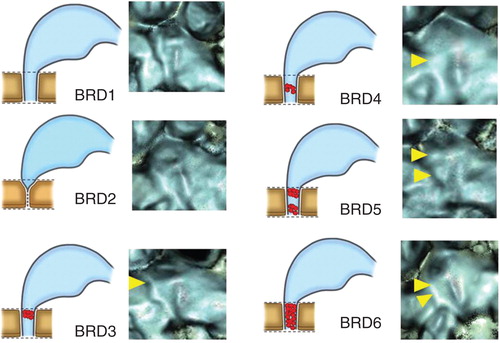
BRD were classified into six patterns, types 1 to 6 (BRD1–BRD6) according to their occluded images: type 1, patent throughout the entire length; type 2, orifice with an acute angle-like V character; type 3, occluded at the orifice; type 4, occluded at the middle portion of the groove; type 5, occluded at the orifice and middle portion of the groove; type 6, totally occluded ().
Figure 3. Occlusion patterns of bony grooves of reuniting duct (BRD). BRD1, patent throughout the entire length; BRD2, acute angle showing V-like character; BRD3, occluded at the orifice; BRD4, occluded at the middle portion of the groove; BRD5, occluded at the orifice and middle portion of the groove; BRD 6, totally occluded. Yellow arrowheads show the occluded points.
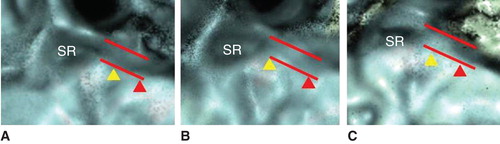
BSD and BES were each divided into three patterns by diameter on 3D CT images: BSD1 to BSD3 and BES1 to BES3. BSD1 or BES1, not occluded and maintained original diameter; BSD3 or BES3, totally occluded; BSD2 or BES2, occlusion between those of BSD1 and BSD3, or between BES1 and BES3, respectively ().
Figure 4. Occlusion patterns of the bony grooves of the saccular duct (BSD, yellow arrowhead) and endoloymphatic sinus (BES, red arrowhead). Dashed line shows original, normal diameter of BSD and BES. (A) BSD1, BES1; (B) BSD2, BES1; (C) BSD3, BES1. (See the Results section.)
According to these criteria, the BRD, BSD, and BES of all 62 MD patients without stage division and 13 healthy ears are shown in and are drawn in graphs (,,).
Figure 5. Distribution pattern of the bony groove of the reuniting duct (BRD) in affected and contralateral non-affected side ears of patients with Meniere's disease (MD) and ears of healthy volunteers defined with BRD1–BRD6 (A) and defined with BRD1–2 and BRD3–6 (B). *p < 0.01.
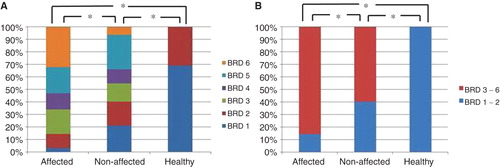
Figure 6. Distribution pattern of the bony groove of the saccular duct (BSD) in affected and contralateral non-affected side ears of patients with Meniere's disease (MD) and ears of healthy volunteers defined with BSD1–BSD 3 (A) and defined with BSD1 and BSD2–3 (B). *p < 0.01; **p < 0.05.
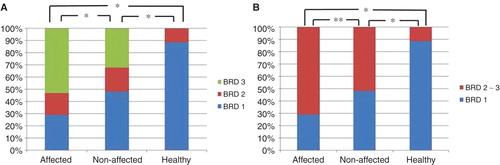
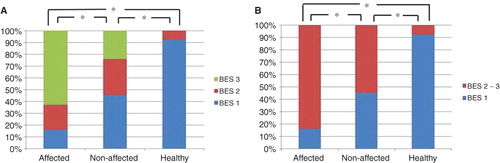
Figure 7. Distribution pattern of the bony groove of the saccular duct (BES) in affected and contralateral non-affected side ears of patients with Meniere's disease (MD) and ears of healthy volunteers defined with BES1–BES 3 (A) and defined with BES1 and BES2–3 (B). *p < 0.01.
Findings for BRD
There was a significant difference in the distribution pattern of RD between the affected side ears of patients with MD and the ears of healthy volunteers (p < 0.01) (). Although the non-affected side ears showed a similar distribution pattern of RD on the affected side, there was a significant difference between them (p < 0.01).
Healthy ears in volunteers had only BRD1 and BRD2, which can be considered as not occluded. In contrast, BRD3 to BRD6 can be considered as various occlusion aspects of BRD. When BRDs were assessed by this definition, the affected and non-affected side ears of patients with MD accounted for 53 (85.5%) and 37 (59.7%) cases of occlusion, respectively, of the 62 cases (), which were significantly different (p < 0.01) ().
Findings for BSD and BES ( and )
The BSD and BES among the affected and non-affected side ears of patients with MD and the ears of healthy volunteers had similar distribution patterns. There was a significant difference between the affected side ears of those with MD and the ears of healthy volunteers (p < 0.01) in BSD and BES (). Although the non-affected side ears showed similar distribution patterns to those of the affected side ears in BSD and BES, they were significantly different (p < 0.01 and p < 0.05) (). Both BSD and BES of the non-affected side ears of patients with MD were also different from the ears of healthy volunteers (p < 0.01).
Although BSD2–3 and BES2–3 indicate a tendency toward occlusion, the ears of healthy volunteers showed BSD2 in 3 of 26 (11.5%) and BES2 in 2 of 26 (7.7%), but none in BSD3 and BES3. When BSD were assessed by the definition of BSD1 vs BSD2–BSD3, the affected side and non-affected sides of patients with MD and ears of healthy volunteers were 44/62 (71%), 32/62 (51.6%), and 3/26 (11.5%), respectively (; ). Assessment of BES with the same definition, BES1 vs BES2– BES3, respectively, revealed values of 52/62 (83.9%), 34/62 (54.8%), and 2/26 (7.7%) (; ).
Distribution of BRD, BSD, and BES in each stage of MD
The distribution patterns of BRD, BSD, and BES in each stage of MD varied with no clear tendency. When BRDs were assessed with the definition in which BRD1–2 were considered patent BRD types and BRD3–6 occluded types of BRD, all stages of MD were significantly different from the ears of healthy volunteers (p < 0.01). BSD1–3 and BES1–3 were assessed separately as BSD1, 2, 3 and BES1, 2, 3 because they indicate different degrees of occlusion. There were significant differences in BSD between stage 1 and stage 2 (p < 0.05), between stage 2 and stage 3 (p < 0.05) and between stage 2 and stage 4 (p < 0.01), but there were no significant differences in BRD and BES among the other stages of MD ().
Table II. p values for the bony groove of the reuniting duct (BRD), saccular duct (BSD), and endolymphatic sinus (BES) for each stage of Meniere's disease.
Discussion
We could classify the patterns of BRD into six types. This classification using images could represent the occlusion patterns of BRD. BRD1 and BRD2 could be clinically healthy patterns because all healthy subjects showed only these types. Therefore, BRD2 could be a subtype of healthy BRD. BRD3 to BRD6 could represent the occluded aspect of RD. Although the proportion of BRD3 to BRD6 in the affected side ears of MD was high in 53 of 62 patients (85.5%), showing various occlusion aspects of RD, either BRD1 or BRD2 was seen in 9 of 62 (14.5%), which indicates that aspects of BRD alone cannot lead to a diagnosis of MD. However, using this classification, both affected and non-affected side ears of patients with MD were significantly different from normal ears (p < 0.01).
Although the distribution in the non-affected side ears of patients with MD resembled that in the affected side, the distributions were significantly different. Non-affected side ears of patients with MD also differed from healthy ears, which was a different finding from the previous study in which the BRD was not different from that in healthy ears. This difference was due to the more detailed classification of BRD in the present study. Considering these results, the present classification of BRD can define each RD into the proper RD type and also offers more precise information on RD than the previous study.
The classification of BSD and BES by assessing the length of their diameters is a qualitative but semi-quantitative method.
In this method the occlusion rates of BSD and BES were higher in the affected than in the non-affected side ears of patients with MD, which were also higher than those of the healthy ears. However, we must pay attention to the findings that both BSD and BES were relatively highly occluded even in the non-affected side ears of patients with MD, i.e. (32/62) 51.6% and (34/62) 54.8%, respectively. This method suggests that BSD and BES are susceptible to occlusion even in the normal condition and that BSD2 and BES2 may be presumed to be normal ear variants, even though they represent partial occlusion.
We speculate that BSD and BES may have a tendency to contain some dislodged saccular otoconia as normal events because they form part of the longitudinal flow of the endolymph pathway to the endolymphatic duct.
As BRD3–6, BSD3, and BES3 were not seen in the normal healthy ears, the occlusion tendency of these BRDs, BSD, and BES, is characteristic of MD.
Our data support the reports by Schuknecht showing several blockage points in the inner ear as the temporal bone pathology of MD patients [Citation4].
The affected and the non-affected side ears of MD showed similar findings that differed from normal ears, suggesting that the non-affected side ears of MD are candidates for MD and that MD is not a completely unilateral disease.
There are reports that the endolymphatic duct and sac in MD patients were narrower than those in healthy ears [Citation11,12]. This incidence may be related to the phenomenon of the dislodged saccular otoconia, by which the endolymphatic duct and sac may become obstructed. Further research is warranted.
The number of MD patients in the present study was not sufficient to assess the proportions of BRD, BSD, and BES of the individuals in each stage of MD. When we discuss MD stages with this restriction, the rates of BRD1–2 and BRD3–6 in each stage were not statistically different. There were no significant differences in BES among the stages. Significant differences were seen between stage 1 and stage 2, between stage 2 and stage 3, and between stage 2 and stage 4 in BSD, but other stages were not different in BSD. We do not have a definitive explanation for this inconsistent incidence. It was presumably due to the small number of MD patients, especially in stage 2 and 3. We found no definite differences of BRD, BSD, and BES among stages for all combinations of stage. We must clarify the difference between MD stages with greater numbers of patients in the future.
Apart from the morphological data, there have been many reports regarding psychosomatic aspects of MD patients that are closely related with the incidence of MD [Citation13–16]. However, it is still unclear whether and which psychological factors constitute a cause or an effect of MD. House et al. reported that MD causes emotional problems, but emotional problems do not appear to cause MD [Citation15]. It will be necessary to investigate these and other factors in more detail.
Our study investigated radiological aspects of MD, rather than the real pathophysiology. However, 3D CT images can give information on the living body. The otoconia of the vestibule can become dislodged, due to either natural turnover as a physiological event or some pathological event [Citation17–19], and the saccule is more susceptible than the utricle [Citation17]. Dislodged otoconia from the utricle is a known cause of benign paroxysmal positional vertigo (BPPV) [Citation20]. Therefore, dislodged otoconia from a more susceptible saccule cannot be neglected as a potential cause of problems in the inner ear. We cannot conclude whether the dislodged otoconia from the saccule is a cause of MD or an effect of MD. Although our strategy has a limit to assess enough inner ear disease, when we consider the large differences in 3D CT image findings between the ears of patients with MD and normal healthy ears in this study, the dislodged saccular otoconia clearly have an important role in MD.
The relationship between the symptoms of MD and the occlusions of RD, SD, and ED must be investigated in the future. For example, although MD stage is defined by the hearing level, the hearing level may be not reflected in MD stages in the present study. Also, the present study did not examine the differences among BRD, BSD, and BES in each individual. All these should be elucidated using larger numbers of patients with MD in the future.
Declaration of interest: The authors report no conflicts of interest. The authors alone are responsible for the content and writing of the paper.
References
- Sajjadi H, Paparella M. Meniere's disease. Lancet 2008;732:406–14.
- Yamakawa K. Über die pathologishe Veränderung bei einem Meniere-Kranken. J Otorhinolaryngol Soc (Jpn) 1938;44:2310–2.
- Hallpike CS, Cairns H. Observation on the pathology of Meniere's syndrome. J Laryngol Otol 1938;53:625–55.
- Schuknecht HF, Rüther A. Blockage of longitudinal flow in the endolymphatic hydrops. Eur Arch Otorhinolaryngol 1991;248:209–17.
- Kimura RS, Schuknecht HF. Membranous hydrops in the inner ear of the guinea pig after obliteration of the endolymphatic sac. Pract Otorhinolaryngol 1965;27:343–54.
- Yamane H, Takayama M, Sunami K, Sakamoto H, Anniko M. Assessment of the reuniting duct by three-dimensional CT rendering. Acta Otolaryngol 2009;129:1166–8.
- Yamane H, Takayama M, Sunami K, Sakamoto H, Imoto T, Anniko M. Blockage of reuniting duct in Meniere's disease. Acta Otolaryngol 2010;130:233–9.
- Yamane H, Takayama M, Sunami K, Sakamoto H, Imoto T, Anniko M. Visualization and assessment of saccular duct and endolymphatic sinus. Acta Otolaryngol 2011;131:469–73.
- Yamane H, Sunami K, Iguchi H, Sakamoto H, Imoto T, Rask-Andersen H. Assessment of Meniere's disease from a radiological aspect – saccular otoconia as a cause of Meniere's disease? Acta Otolaryngol 2012;132:1054–60.
- Committee on Hearing and Equilibrium. Committee on hearing and equilibrium guidelines for the diagnosis and evaluation of therapy in Meniere' disease. Otolaryngol Head Neck Surg 1995;113:181–5.
- Stahle J, Wilbrand H. The vestibular aqueduct in patients with Meniere's disease. A tomographic and clinical investigation. Acta Otolaryngol 1974;78:36–48.
- Yamamoto E, Mizukaimi C, Isono M, Ohmura M, Hirono Y. Observation of the external aperture of the vestibular aqueduct using three-dimensional surface reconstruction imaging. Laryngoscope 1991;101:480–3.
- Jongkees LBW. Some remarks on the patient suffering from Meniere's disease. Trans Am Acad Ophthalmol Otolaryngol 1971;75:374–8.
- Groen JJ. Psychosomatic aspects of Meniere's disease. Acta Otolaryngol 1983;95:407–16.
- House JW, Cray WG, Wexler M. The inter-relationship of vertigo and stress. Otolaryngol Clin North Am 1980;13:625–9.
- Wexler M, Crary WG. Meniere's disease: the psychosomatic hypothesis. Am J Otol 1986;7:93–6.
- Igarashi M, Saito R, Mizukoshi K, Alford BR. Otoconia in young and elderly persons: a temporal bone study. Acta Otolaryngol Suppl 1993;504:26–9.
- Yamane H, Imoto T, Nakai Y, Igarashi M, Rask-Andersen H. Otoconia degradation. Acta Otolaryngol Suppl 1984;406:263–70.
- Gussen R, Adkins WY. Jr. Saccule degeneration and ductus reunions obstruction. Arch Otolaryngol 1974;99:132–5.
- Schuknecht HF. Cupulolithiasis. Arch Otolaryngol 1969;90:765–78.