Abstract
Mass spectrometry today is the only analytical technology which allows the specific determination of all known vitamin D metabolites. During the last few years the number of published methods rapidly increased and quantitative HPLC-MS/MS procedures are described for all the major metabolites including 25(OH)D3, 3-epi25(OH)D3, 24,25(OH)2D3, 25(OH)D2 and 1,25(OH)2D3. For the first time these new methods have made the systematic study of the clinical relevance of vitamin D metabolites possible. In parallel to the development of methods for new metabolites, significant progress was made in improving the performance of HPLC-MS/MS for quantifying 25(OH)D3 concentrations which has resulted in very short run times and thus enabling high throughput analysis for routine use and large sample sets.
Introduction and recent developments
The principle of isotope dilution (ID) with stable isotope labeled internal standard compounds and mass spectrometric (MS) detection is generally accepted as yielding the highest attainable analytical accuracy (trueness and precision). The physicochemical behavior of stable isotope labeled compounds with respect to sample preparation and signal generation is practically identical to that of the native unlabeled analyte. However, labeled and unlabeled analytes can be clearly separated by mass spectrometric detection; thus any matrix effect of an MS based assay is fully compensated by ID standardization.
In mass spectrometric vitamin D assays, samples which are spiked with labeled internal standard are allowed to equilibrate over an extended period of time, during which the labeled compound is bound to vitamin D-binding protein in the same manner as the target analyte. The characteristics of release from the binding protein can be assumed to be identical to that of the native unlabeled analyte as well. Therefore, isotopically labeled internal standards ensure trueness of the results.
The number of publications on vitamin D determination by mass spectrometry has increased rapidly during the last years. There are excellent reviews [Citation1,Citation2] on the methods used for HPLC-MS/MS quantification of vitamin D and metabolites covering the literature up to 2010. Most of the reviewed publications are focused on quantifying 25(OH)D3 and 25(OH)D2 concentrations but only a few methods are published describing quantifying other vitamin D metabolites. As summarized by El-Khoury [Citation1] reviewing the literature up to January 2010, quantification of 24,25(OH)2D3 is shown by [Citation3–5], quantifying 3epi25(OH)D3 by [Citation6] and 1,25(OH)2D3 by [Citation7,Citation8]. In 2010 and 2011 there was a number of publications with special focus on vitamin D metabolites; separation and quantifying 3epi25(OH)D3 is described by [Citation9–15], 24,25(OH)2D3 by [Citation16–18] and 1,25(OH)D3 by [Citation15,Citation17,Citation19]. Shah et al. [Citation12] also reported identification and separation of other isobaric compounds as 1-α-(OH)D3 and 7-α-hydroxy-4-cholesten-3-one (7αC4). Simultaneous quantification of five metabolites 25(OH)D3, 25(OH)D2, 24,25(OH)2D3, 1,25(OH)2D3 and 1,25(OH)2D2 was demonstrated by Ding et al. [Citation20] after protein precipitation and derivatization followed by ultra-high performance liquid chromatography–tandem mass spectrometry with short runtime below 5 minutes. For routine application, recent developments are commercially available test kits (example: Recipe, Chromsystems and Perkin Elmer) containing HPLC columns, reagents, controls, calibrators and internal standard together with application instructions for different mass spectrometric hardware.
The unique features of mass spectrometry
While the specificity of conventional analytical techniques such as photometry, potentiometry, and immunoassay in detecting clinically important substances is often limited, methods based on mass spectrometry allow highly specific detection of target compounds at the level of their respective molecular structure. Mass spectrometry has contributed significantly to the advancement of medical science in recent decades, particularly in relation to drug development and in-vitro diagnostics. Its role has widened significantly in recent years, thanks to the development of soft ionization techniques and complex ion analysis in particular [Citation21–24].
Basic steps of mass spectrometry are: (i) Generation of ions in the gas phase (ion source), (ii) separation of these ions according to the molecular mass and the charge state by electromagnetic fields (mass analyzer I), (iii) collision activated fragmentation (collision cell), (iv) separation of fragment ions by mass and charge state (mass analyzer II), (v) detection and counting of the individual ions (detector) (). Usually a chromatographic separation (HPLC) is combined prior to mass spectrometric detection; this is necessary to reduce complexity of the sample, to enrich the analytes of interest and to reduce potential matrix effects. Historically mass spectrometric use in clinical chemistry is known in combination with GC-MS. Newer developments in “soft” ionization techniques like ESI (electrospray ionization), APCI (atmospheric pressure chemical ionization) and MALDI (matrix assisted laser desorption ionization) within the last twenty years initiated a quantum leap in the use of this detection technology. The Nobel Prize in chemistry was awarded in 2002 to J. Fenn and K. Tanaka “for the development of methods for identification and structure analyses of biological macromolecules” and “for their development of soft desorption ionization methods for mass spectrometric analyses of biological macromolecules”.
Figure 1. Schematic drawing of tandem-mass spectrometry.
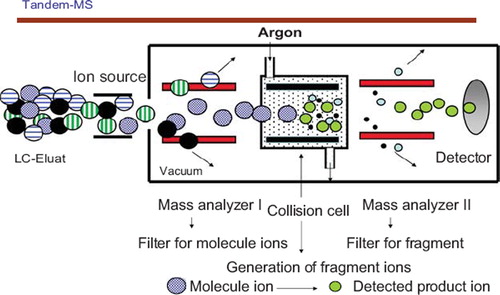
With ESI, the analyte containing solution is sprayed by an electrically charged capillary generating small nano to micro droplets from which the charged analyte molecules are released into high vacuum. This process allows the ionization of thermally instable and also highly polar molecules enabling the analysis of almost all biochemical analytes of interest by mass spectrometry.
The use of mass spectrometric methods with isotope dilution standardization is well accepted in the field of reference method development [Citation25]. Resulting from this, there are very high expectations for performance and trueness also for the use as routine methods. However, similar to other analytical principles, performance of mass spectrometry is strongly kept within the interaction triangle of detectability, specificity and throughput. Performance characteristics of mass spectrometry are exhaustively reviewed by Grebe et al. [Citation24]. The trueness of measurement results is firmly linked to the quality of the calibrator materials used and the precision is depending on details of the procedures used for sample preparation and HPLC-MS/MS measurement. Despite the obvious strength of mass spectrometric detection, there is no self-evidence for precision and trueness. Quality of mass spectrometric results is always depending on the entire measurement procedure which has to be adapted to the intended use. With respect to vitamin D reference measurement this is clearly documented by Stepman et al. and Phinney et al. [Citation14,Citation26] who recently published well validated reference measurement procedures.
In general the procedure for HPLC-MS/MS measurement of Vitamin D concentration consists of:
a) Spiking of serum sample with an exactly defined amount of internal standard
b) Sample preparation by protein precipitation or solid phase extraction
c) HPLC separation on either two dimensional or one dimensional reversed phase system with C18, CN or PFP types of columns
d) ESI or APCI ionization and tandem mass spectrometric detection by MRM (multiple reaction monitoring) with different ions used for MRM transition, either monitoring loss of water (–18) or monitoring of smaller fragment ions resulting from complex rearrangement reactions
HPLC runtimes are covering a wide range from 2.5 minutes up to 40 minutes depending on the intended use. Long runtimes are usually associated with higher resolution and robustness of the method and are therefore used for reference standardization measurement like certification of standard reference materials such as SRM 972 [Citation14,Citation26]. Also measurements which are used for standardization [Citation27] of routine assays like binding assays need more stringent conditions than for routine use. Standardization against dedicated mass spectrometric methods ensures traceability to reference methods of higher order as it is mandatory by the in-vitro diagnostics directive IVD 78/79 EC.
For routine measurements the sample throughput is a critical factor; therefore run time has to be shortened as much as possible. This can be achieved by using fast gradients and ultrahigh resolution HPLC systems. Nevertheless, short runtimes are often associated with loss of resolution, precision and trueness.
Vitamin D metabolites measured by mass spectrometry
Affinity based assays poorly differentiate specific Vitamin D metabolites. In contrast HPLC-MS/MS methods can clearly separate components with different molecular mass or different fragmentation pattern within the fragment ion formation. For isobaric and structurally similar components, MS needs good chromatographic separation. For example, methods which use reversed phase (C18) based chromatographic conditions are not able to differentiate between 3-epi-25(OH)D3 and 25(OH)D3 because these are co-eluted on the stationary phase and exhibit identical mass spectra. The possibility to identify and quantify these vitamin D metabolites depends on mass spectrometric detection combined with specific high resolution chromatographic separation. Methods that became available during the last two years are still not routine for high throughput measurements. Isobaric Vitamin D metabolites can be separated on cyanopropyl (CN) and on pentafluorophenyl (PFP) stationary phases. This separation is still more time consuming than chromatography on standard C18 material.
Simultaneous quantification of 25(OH)D, 3-epi-25 (OH)D, 24,25(OH)2D3 und 25(OH)D2 was shown by Baecher S. [Citation28,Citation29]. Baseline chromatographic separation is achieved for all analytes (). This method was used to measure a set of patient samples with 25(OH)D3 concentrations covering the interval of < 25 nmol/L to 175 nmol/L. The measured concentration of 3-ep-25(OH)D3 was between < 2.5 nmol/L and 20 nmol/L, the concentration of 24,25(OH)2D3 between < 2.5 nmol/L and 30 nmol/L. For both metabolites the concentration correlates nonlinearly with the 25(OH)D3 concentration (). This finding is in agreement with [Citation16] which also reported concentrations between 3.25 and 30 nmol/L for 24,25(OH)2D3 and has shown a slightly nonlinear correlation at higher concentrations of 25(OH)D3.
Figure 2. HPLC-MS/MS separation for a serum sample containing a) 25(OH)D3, b) 3-epi-25(OH)D3, c) 25(OH)D2, d) 24,25(OH)2D3 and e) d6-25(OH)D3, internal standard.
Figure 3. Concentration of epi25OHD3 and 24,25(OH)2D3 relative to 25(OH)D3 concentration in a set of patient samples.
The measured concentrations for epi25(OH)D3 of up to 20 nmol/L are in good agreement with Stepman et al. [Citation13] who reported a concentration of 2.5 % to 17 % relative to 25(OH)D3 but in discrepancy to Keevil [Citation10] who found 0 to 8.5 nmol/L, only. Investigations on larger sample sets and different types of patients are necessary to get a clearer understanding.
Conclusions
HPLC mass spectrometry has found its place for Vitamin D concentration measurements in clinical laboratories; it is used for routine measurements of the concentration of different vitamin D metabolites and is the only analytical method today with allows for the specific and simultaneously quantification of these structurally similar compounds. Within non-routine applications, MS is used for reference standardization of Vitamin D and for value assignment of certified control materials. Compared with other fully automated routine assays, the only limitation currently is the need for special sample preparation including manual steps which compromise sample throughput and convenience.
Questions and Answers
G Jones, Canada
I go back to the question I asked the last speaker. From the curvature of the final plot you have presented, it appears that 24,25(OH)2D3 becomes a much more significant problem at higher 25(OH) concentrations. We are told it represents 10–15 % of the total but the curvilinear nature suggests that any correction you would make in a binding assay would start to become a problem as 25(OH)D concentration climbs.
The question was referred to B Ofenloch-Haehnle:
This raises a very interesting matter i.e. the reason for this higher percentage of 24,25(OH)2D3 as 25(OH)D rises. There may be an overflow mechanism in the over-supplementation scenario, so that more metabolites are generated. Is there a role for the measurement of 24,25(OH)2D3 to indicate toxicity? Indeed the total number of metabolites at high concentrations may be an indicator of toxicity. Now we have the MS methods to measure these we should look at the situation in more detail.
G Jones
In the research laboratory we have studied such phenomena and pointed out that 24,25(OH)2D3 accumulates in the blood because of its strong affinity for D-binding protein and because of its metabolism to other compounds. So mass spectrometry is telling us that there is a problem with immunoassays at high 25(OH)D concentrations.
B Ofenloch-Haehnle
We have used this MS data to adjust our standardisation at the high end of the assay, because you can correct the recovery in a non-linear fashion. This is the basis of the data you have seen. We establish an internal working calibrator and we can therefore compensate appropriately.
G Jones
I would describe it as a ‘hope’.
G Beastall, UK
We are getting tot measure 25(OH)D concentrations and to the situation we have experienced for many analytes over the years where, with improved specificity and analytical technology, the laboratory is getting ahead of the clinic. If we think about the action limits we have heard about; these are based on results from immunoassays, which measure everything. If we believe a nominal 20 % may be contributed to by 24,25(OH)2D3, epimers or whatever, then a measured 50 nmol/L is equivalent to an actual 40 nmol/L of 25(OH)D. So, we need to revisit, with our clinical colleagues, what these cut-offs actually mean in practice. As assays improve, we need to consider what the clinical implications are and change reference intervals, action limits etc. appropriately.
Declaration of interest: The author report no conflicts of interest. The author alone is responsible for the content and writing of the paper.
References
- El-Khoury JM, Reineks EZ, Wang S. Progress of liquid chromatography-mass spectrometry in measurement of vitamin D metabolites and analogues. Clin Biochem 2011;44:66–76.
- Vogeser M. Quantification of circulating 25-hydroxyvitamin D by liquid chromatography-tandem mass spectrometry. J Steroid Biochem Mol Biol. 2010;121:565–573.
- Tsugawa N, Suhara Y, Kamao M, Okano T. Determination of 25-hydroxyvitamin D in human plasma using high-performance liquid chromatography-tandem mass spectrometry. Anal Chem. 2005;77:3001–3007.
- Aronov PA, Hall LM, Dettmer K, Stephensen CB, Hammock BD. Metabolic profiling of major vitamin D metabolites using Diels-Alder derivatization and ultra-performance liquid chromatography-tandem mass spectrometry. Anal Bioanal Chem. 2008;391:1917–1930.
- Higashi T, Awada D, Shimada K. Determination of 24,25-dihydroxyvitamin D-3 in human plasma using liquid chromatography-mass spectrometry after derivatization with a Cookson-type reagent. Biomed Chromatogr. 2001;15: 133–140.
- Singh RJ, Taylor RL, Reddy GS, Grebe SKG. C-3 epimers can account for a significant proportion of total circulating 25-hydroxyvitamin D in infants, complicating accurate measurement and interpretation of vitamin D status. J Clin Endocrinol Metab 2006;91:3055–3061.
- Priego Capote F, Ruiz Jimenez J, Mata Granados JM, Luque de Castro MD. Identification and determination of fat-soluble vitamins and metabolites in human serum by liquid chromatography/triple quadrupole mass spectrometry with multiple reaction monitoring. Rapid Commun Mass Spectrom. 2007;21:1745–1754.
- Casetta B, Jans I, Billen J, Vanderschueren D, Bouillon R. Development of a method for the quantification of 1 alpha,25(OH)(2)-vitamin D(3) in serum by liquid chromatography tandem mass spectrometry without derivatization. Eur J Mass Spectrom 2010;16:81–89.
- Higashi T, Suzuki M, Hanai J, Inagaki S, Min JZ, Shimada K, Toyo'oka T. A specific LC/ESI-MS/MS method for determination of 25-hydroxyvitamin D(3) in neonatal dried blood spots containing a potential interfering metabolite, 3-epi-25-hydroxyvitamin D(3). J Sep Sci 2011;34: 725–732.
- Keevil B. Does the presence of 3-epi-25(OH)D3 affect the routine measurement of vitamin D using liquid chromatography tandem mass spectrometry? Clin Chem Lab Med. 2011 online. http://www.degruyter.com/view/j/cclm.ahead-of-print/cclm.2011.755/cclm.2011.755.xml, Accessed 3. March 2012.
- Schleicher RL, Encisco SE, Chaudhary-Webb M, Paliakov E, McCoy LF, Pfeiffer CM. Isotope dilution ultra performance liquid chromatography-tandem mass spectrometry method for simultaneous measurement of 25-hydroxyvitamin D2, 25-hydroxyvitamin D3 and 3-epi-25-hydroxyvitamin D3 in human serum. Clin Chim Acta 2011;412: 1594–1599.
- Shah I, James R, Barker J, Petroczi A, Naughton DP. Misleading measures in Vitamin D analysis: A novel LC-MS/MS assay to account for epimers and isobars. Nutr J. 2011;10:46.
- Stepman HCM, Vanderroost A, Stockl D, Thienpont LM. Full-scan mass spectral evidence for 3-epi-25-hydroxyvitamin D(3) in serum of infants and adults. Clin Chem Lab Med. 2011;49:253–256.
- Stepman HCM, Vanderroost A, Van Uytfanghe K, Thienpont LM. Candidate Reference Measurement Procedures for Serum 25-Hydroxyvitamin D(3) and 25-Hydroxyvitamin D(2) by Using Isotope-Dilution Liquid Chromatography-Tandem Mass Spectrometry. Clin Chem. 2011;57: 441–448.
- Strathmann FG, Laha TJ, Hoofnagle AN. Quantification of 1 alpha,25-Dihydroxy Vitamin D by Immunoextraction and Liquid Chromatography-Tandem Mass Spectrometry. Clin Chem. 2011;57:1279–1285.
- Wagner D, Hanwell HE, Schnabl K, Yazdanpanah M, Kimball S, Fu L, Sidhom G, Rousseau D, Cole DEC, Vieth R. The ratio of serum 24,25-dihydroxyvitamin D(3) to 25-hydroxyvitamin D(3) is predictive of 25-hydroxyvitamin D(3) response to vitamin D(3) supplementation. J Steroid Biochem Mol Biol. 2011;126:72–77.
- Wang Z, Senn T, Kalhorn T, Zheng XE, Zheng S, Davis CL, Hebert MF, Lin YS, Thummel KE. Simultaneous measurement of plasma vitamin D(3) metabolites, including 4 beta,25-dihydroxyvitamin D(3), using liquid chromatography-tandem mass spectrometry. Anal Biochem. 2011;418: 126–133.
- Ding S, Schoenmakers I, Jones K, Koulman A, Prentice A, Volmer DA. Quantitative determination of vitamin D metabolites in plasma using UHPLC-MS/MS. Anal Bioanal Chem. 2010;398:779–789.
- Yuan C, Kosewick J, He X, Kozak M, Wang S. Sensitive measurement of serum 1 alpha,25-dihydroxyvitamin D by liquid chromatography/tandem mass spectrometry after removing interference with immunoaffinity extraction. Rapid Commun Mass Spectrom. 2011;25: 1241–1249.
- Ding S, Schoenmakers I, Jones K, Koulman A, Prentice A, Volmer DA. Quantitative determination of vitamin D metabolites in plasma using UHPLC-MS/MS. Anal Bioanal Chem. 2010;398:779–89.
- Vogeser M, Parhofer KG. Liquid chromatography tandem-mass spectrometry (LC-MS/MS) - Technique and applications in endocrinology. Exp Clin Endocrinol Diabetes. 2007;115:559–570.
- Vogeser M, Seger C. A decade of HPLC-MS/MS in the routine clinical laboratory - Goals for further developments. Clin Biochem. 2008;41:649–662.
- Vogeser M, Kobold U, Seidel D. Massenspektrometrie in der Medizin – Stellenwert der molekularen Analytik. Deutsches Ärzteblatt 2007;104:2194–2200.
- Grebe SK, Singh RJ. LC-MS/MS in the Clinical Laboratory - Where to From Here? Clin Biochem Rev. 2011;32:5–31.
- Stockl D, Franzini C, Kratochvila J, Middle J, Ricos C, Siekmann L, Thienpont LM. Analytical specifications of reference methods compilation and critical discussion. Eur J Clin Chem Clin Biochem. 1996;34:319–337.
- Phinney KW, Bedner M, Tai SS, Vamathevan W, Sander LC, Sharpless KE, Wise SA, Yen JH, Schleicher RL, Chaudhary-Webb M, Pfeiffer CM, Betz JM, Coates PM, Picciano MF. Development and certification of a standard reference material for vitamin D metabolites in human serum. Anal Chem. 2012;84:956–962.
- Vogeser M, Kyriatsoulis A, Huber E, Kobold U.Candidate reference method for the quantification of circulating 25-hydroxyvitamin D-3 by liquid chromatography-tandem mass spectrometry. Clin Chem. 2004;50:1415–1417.
- Baecher S. Development of a HPLC-MS/MS-method for quantification of Vitamin D and Vitamin-D-derivatives in serum and plasma samples. Master-Thesis, LMU Munich, Departement of Pharmacy 2011.
- Leinenbach A. Absolute Quantifizierung von 25(OH)-, 3-Epi-25(OH)-, 24,25(OH)2-Vitamin D3 und 25(OH)-Vitamin D2 in Serum- und Plasma-Proben mittels HPLC-MS/MS. DGKL, Tagungsbericht des 9. LC-MS/MS- Anwendertreffens 2011 http://www.dgkl.de/PA105756_DE_VAR100?sid=f257853M69m971. Accessed 3. March 2012.