Abstract
Dietary reference intervals relate to the distribution of dietary requirement for a particular nutrient as defined by the distribution of physiological requirement for that nutrient. These have more commonly been called Dietary Reference Values (DRV) or Dietary Reference Intakes (DRI), amongst other names. The North American DRI for vitamin D are the most current dietary reference intervals and arguably arising from the most comprehensive evaluation and report on vitamin D nutrition to date. These are a family of nutrient reference values, including the Estimated Average Requirement (EAR), the Recommended Dietary Allowance (RDA), the Adequate Intake, and Tolerable Upper Intake Level. In particular, the EAR is used for planning and assessing diets of populations; it also serves as the basis for calculating the RDA, a value intended to meet the needs of nearly all people. The DRVs for vitamin D in the UK and the European Community have been in existence for almost two decades, and both are currently under review. The present paper briefly overviews these three sets of dietary reference intervals as case studies to highlight both the similarities as well as possible differences that may exist between reference intervals for vitamin D in different countries/regions. In addition, it highlights the scientific basis upon which these are based, which may explain some of the differences. Finally, it also overviews how the dietary reference intervals for vitamin D may be applied, and especially in terms of assessing the adequacy of vitamin D intake in populations.
Introduction
Dietary reference intervals relate to the distribution of dietary requirement for a particular nutrient as defined by the distribution of physiological requirement for that nutrient, and have been more commonly called Dietary Reference Values (DRV) or Dietary Reference Intakes (DRI), amongst other names. The North American DRI for vitamin D [Citation1] are the most current dietary reference intervals and arguably arising from the most comprehensive evaluation and report on vitamin D nutrition to date. The DRV for vitamin D in the UK [Citation2] and in the EU [Citation3] have been in existence for almost two decades, and both are currently under review. A brief overview of these three sets of dietary reference intervals as case studies show both the similarities as well as possible differences that may exist between reference intervals for vitamin D in different countries/regions. In addition, this review will highlight the scientific basis upon which these are based, which may explain some of the differences. Finally, it will overview how DRV/DRI for vitamin D may be applied and especially in terms of assessing the adequacy of vitamin D intake in populations.
Brief overview of Dietary Reference Intervals
In the UK, nutrient requirement values have evolved from singular reference figures such as Recommended Intakes in 1969 [Citation4] and Recommended Daily Amounts in 1979 [Citation5] to an interval of intakes (DRV) in 1991, which were based as far as possible on its assessment of the distribution of requirements for each nutrient [Citation2]. In 1993, the Scientific Committee for Food (SCF) established DRV for nutrient and energy intakes for the European Community (EC) [Citation3].
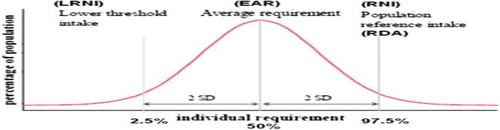
Although information is usually inadequate to calculate the precise distribution of requirements in a group of individuals for a nutrient, it has been assumed to be normally distributed [Citation2,Citation3]. This gives a notional Average Requirement (AR) or Estimated Average Requirement (EAR) (about half of a group of people will usually need more than this value, and half less) with the inter-individual variability around this (). For example, in the UK and the EC the Reference Nutrient Intake (RNI) and Population Reference Intake (PRI), respectively, was a point on the distribution that is two notional standard deviations above the EAR (), representing an amount that is enough, or more than enough, for virtually all (∼97.5 %) people in a population group [Citation2,Citation3]. A point on the distribution that is two notional standard deviations below the EAR, referred to as the Lower Reference Nutrient Intake (LRNI) in the UK and Lowest Threshold Intake (LTI) in the EC (), represents the lowest intakes which will meet the needs of some individuals in the group (i.e., those who have low needs). Intakes below this reference value are almost certainly inadequate for almost all individuals [Citation2,Citation3]. While this 3 benchmark DRV was the generalised situation for nutrients and energy, in the case of vitamin D only a RNI and PRI were established in the UK (1991) and EC (1993) DRVs, respectively, and at that only for certain age groups (see below). These relatively dated dietary reference intervals for vitamin D are at present being re-evaluated (see later).
Figure 1. Dietary reference intervals for vitamin D, assuming the requirement has a normal distribution. LRNI, lower reference nutrient intake; EAR, estimated average requirement; RNI, lower reference nutrient intake; RDA, recommended dietary allowance. Modified from (6).
In 2010, European Food Safety Authority (EFSA) issued an opinion on the general principles for development and application of DRV which suggested that similarly to the earlier SCF Report in 1993, the EFSA panel proposed to again derive PRI, AR and LTI [Citation6]. In addition, the panel also proposed to derive an Adequate Intake (AI) when a PRI cannot be established for a nutrient because an AR cannot be determined [Citation6]. An AI is the average observed daily level of intake by a population group (or groups) of apparently healthy people that is assumed to be adequate. The panel indicated that they will not address the Tolerable Upper Intake Level (UL; the maximum level of total chronic daily intake of a nutrient (from all sources) judged to be unlikely to pose a risk of adverse health effects to humans) as this has been assessed previously by EFSA [Citation7].
The North American DRI framework of reference values (established in the mid 1990s and replacing the Recommended Dietary Allowances (RDA) in the US and Reference Nutrient Intakes in Canada), similar to the EFSA proposed DRV equivalents, include an EAR, RDA and AI (if necessary), but also an UL [Citation1]. They do not, however, include a LRNI/LTI equivalent [Citation1].
Selection of criteria to establish nutrient adequacy: vitamin D
In defining nutrient requirement the selection of criteria to establish nutrient adequacy is an important step. Differences in dietary reference intervals for vitamin D (see below and ], relate, at least in part, to their underpinning specific criteria of nutrient adequacy. The difference in choice of criteria used for vitamin D DRV and DRI is itself a construct of the level of evidence within the hierarchy of criteria available over two decades ago (for DRV) compared to that available subsequently and especially in recent years (for DRI). All agencies briefed with establishing dietary requirements for vitamin D have used serum/plasma 25(OH)D as the biochemical indicator of vitamin D exposure/status [Citation1–3,Citation8,Citation9]. This is not surprising as it has been shown to be a robust indicator of vitamin D exposure [Citation10], albeit it has some potential limitations [Citation11]. Up until recently many, if not all, of these agencies have used a serum 25(OH)D cut-off of ∼25–30 nmol/L as the lower threshold for vitamin D status (largely on the basis of rickets and osteomalacia) [Citation1–3,Citation8,Citation9]. For example, the UK DRV panel indicated that prolonged deficiency of vitamin D in children results in rickets, which occur in the plasma 25(OH)D concentration interval from not detectable to ∼20 nmol/L (8 ng/mL) [Citation2]. In adults, hypovitaminosis D as presented as osteomalacia occurs at plasma 25(OH)D concentrations less than 10 nmol/L (4 ng/mL) [Citation2], however more recent data suggests a much higher serum 25(OH)D concentration [Citation12] which has lead to considerable debate following publication of the recent North American DRI [Citation1]. The SCF in 1993 also highlighted rickets and osteomalacia as well as alterations in metabolism of calcium, bone and muscle as signs of vitamin D deficiency and suggests that subclinical signs of vitamin D deficiency have been found in some healthy adults with serum 25(OH)D concentrations below 25 nmol/L (10 ng/mL) [Citation3].
Table I. Dietary reference intervals for vitamin D (amounts in μg/d).
In North America, the DRI panel for calcium and related nutrients in 1997 only specified an AI (and UL) value for vitamin D as there was insufficient evidence to set EAR and thus RDA values [Citation9]. The AI for vitamin D was set on the basis of intakes necessary to achieve “normal” intervals of serum 25(OH)D concentrations, with a lower concentration of 30 nmol/L [Citation9]. Following a ten-year period of review of the process of the DRI development in North America, documented across several reports [Citation13–15], the Institute of Medicine (IOM) committee approached the task of revising DRIs for calcium and vitamin D using the risk assessment framework commonly applied to setting UL [Citation15].
The risk assessment framework used by the DRI committee on vitamin D and calcium, outlined in more detail elsewhere [Citation1,Citation11], is organized across four steps, summarised below:
Step 1: Hazard identification. In the decade or more since the 1997 DRI for vitamin D [Citation9], the research output in the field of vitamin D increased exponentially, yielding a considerable body of data to inform the 2010 DRI consensus committee in its deliberations. The extensive data evaluation and analysis undertaken by the DRI committee as part of Step 1 of the framework, was facilitated greatly by the outcomes of two Agency for Healthcare Research and Quality (AHRQ) Systematic Evidence-Based Reviews (SEBR) from the Ottawa [Citation16] and Tufts [Citation17] evidence-based practice centres, commissioned by several US and Canadian federal government agencies. The committee used these SEBR to identify, describe and rate potential indicators (including clinical outcomes, biomarkers of effect, functional outcomes and biomarkers of exposure) to be used in developing the DRIs for vitamin D and calcium and to select the critical indicators [Citation1]. While there has been an increasing body of data on the relationship between vitamin D status and a wide range of non-skeletal health outcomes, the DRI committee concluded that many of the studies of non-skeletal health effects provided often mixed and inconclusive results which led the committee to question their reliability [Citation1]. The DRI committee instead prioritized bone health outcomes as the basis for establishing the new DRI values for vitamin D (and calcium) [Citation1].
Step 2: Hazard characterization. This step of the framework is concerned with specification of the DRIs on the basis of clarifying the relationship of the nutrient exposure and the reference level of the critical indicator(s), taking into consideration gender, life stage and vulnerable groups [Citation1]. Taking indicators of bone health, including rickets and osteomalacia, bone mineral density and calcium absorption, for which there was sufficient evidence to provide a reasonable and supportable basis for DRI development, the committee integrated data from these indicators (rather than use of only one bone indicator such as rickets or osteomalacia, as in previous DRI [Citation9]). The committee identified the concentrations of serum 25(OH)D within different age groups at which risk of adverse outcomes in these bone parameters increases. For children and adolescents, risk increased occurred within the serum 25(OH)D interval of 30 to 50 nmol/L, which lead the committee to select 40 nmol/L (from the middle of the interval) as a serum 25(OH)D concentration that would meet median requirements (above which approximately half the population might meet its vitamin D requirement and below which half might not; and thus referred to as an EAR-like value) [Citation1]. In order to estimate the serum 25(OH)D concentration that would meet the requirement of nearly all (i.e. 97.5 %) of the population, two coefficients of variation (30 %) were added to the 40 nmol/L to yield 50 nmol/L, and referred to as an RDA-like value. For adults, the committee felt that it was not possible to estimate the concentration of serum 25(OH)D at which 50 % of the population is at increased risk of osteomalacia, instead the evidence suggested that most adults are covered by a serum 25(OH)D concentration of 50 nmol/L and this was used as the RDA-like value, and a value of 40 nmol/L was estimated as the EAR-like value [Citation1]. Thus, overall serum 25(OH)D concentrations of 40 and 50 nmol/L, which reflect exposure to vitamin D from a combination of sun-derived endogenous synthesis and diet, were used to specify EAR and RDA values, respectively, for vitamin D intakes in all age and gender subgroups in the population above 1 y, assuming minimal ultraviolet blue (UVB) sunlight exposure (see below). Furthermore, the committee also indicated that a serum 25(OH)D concentration below 30 nmol/L (the lower end of the requirement range) was consistent with risk of vitamin D deficiency [Citation1].
Step 3: Intake assessment. This step of the framework compares the EAR and UL values specified in Step 2 to habitual population intake data [Citation1].
Step 4: Risk characterization. This is essentially the reporting step of the framework where the committee details each aspect of the approach used, outcomes, decisions, special concerns and uncertainties relevant to risk managers and regulatory bodies charged with public health policy and scientists [Citation1]. Risk management agencies implement the DRIs.
Dietary reference intervals for vitamin D
The DRV and DRI values for vitamin D in the UK/EC and North America, respectively, are shown in . For any one age-group, the dietary reference intervals for vitamin D can vary from no dietary reference interval value, to a specific value, to an intake interval. The UK and EC DRV for vitamin D established around two decades ago [Citation2,Citation3] had a very different approach in relation to the impact of UVB sunshine exposure on vitamin D status and thus dietary requirements compared to the more recent North American DRI [Citation1]. In particular, the UK DRV panel suggested that in relation to adults aged 18–65 years of age as the plasma 25(OH)D concentration normally well exceeded the 10 nmol/L [4 ng/mL] cut-off for osteomalacia (due to exposure of skin to UVB sunshine), no dietary intake was necessary for individuals living a normal life-style [Citation2], for whom the panel set no DRVs (]. Likewise for children aged 4–17 y. For those confined indoors, the panel agreed an RNI of 10 μg/d for vitamin D [Citation2]. The panel established RNI values (between 7 and 10 μg/d) for some population groups [Citation2] (]. The Asian community was also identified as one at risk of low vitamin D status, and which may require supplementary vitamin D [Citation2]. These DRV were re-evaluated in 1998 [Citation18], but were unchanged. In 2010, UK Scientific Advisory Committee on Nutrition (SACN) agreed to review the data on vitamin D because a substantial amount of evidence has subsequently become available even since their position statement ‘Update on Vitamin D’ in 2007 [Citation19] which concluded that there was insufficient evidence, at that time, to amend the existing vitamin D DRV. This exercise is ongoing at present and thus, the UK DRV may, or may not, change over the next two years or so. Very recently the Chief Medical Officers of the four Departments of Health in the UK, concerned that some of the UK population may be at risk of vitamin D deficiency, issued advice on supplements for at risk groups [Citation20] (see ).
The SCF suggest that the vitamin D requirement was considered in their 1993 report as that necessary to maintain circulating 25(OH)D concentrations in the ‘desirable’ interval of 25–100 nmol/L (10–40 ng/mL) [Citation3]. They suggest that healthy adults who do not exposure themselves to sunshine, or live in countries with only a short season of useful ultraviolet (UV) radiation, may have serum 25(OH)D concentrations as low as 15–20 nmol/L (6–8 ng/mL) [Citation3]. Of note, the SCF suggested that a problem in trying to agree a dietary requirement for vitamin D is that many individuals maintain their circulating 25(OH)D concentrations in the desirable interval by endogenous synthesis of vitamin D (upon exposure of skin to UVB sunlight), and so need none in the diet, whereas those that do not produce sufficient vitamin D by endogenous synthesis need some dietary supply [Citation3]. Furthermore, they suggest there will thus be considerable variation between different geographical regions in Europe (latitude, climate and air pollution) and perhaps between social and ethnic groups in a given geographical region (calcium and phosphate intake, exposure to sunlight) [Citation3]. The SCF specified a PRI for some population groups which may have difficulty in obtaining their needs by endogenous synthesis, and supplementation may be prudent in these groups [Citation3]. For other groups, an interval of values up from zero indicates that all members of the group should be able to produce adequate vitamin D for themselves by exposure to (UVB) sunlight, and most will, with no need for a dietary supply (). The higher end of the interval is the estimated dietary requirement of an individual with minimal endogenous synthesis. As mentioned above, these EC DRV are under review by EFSA and may, or may not, change over the next two years or so. It should be noted also that dietary reference intervals for vitamin D in a number of individual European member states/regions (as well as elsewhere in the globe) are being re-evaluated at this time.
The current North American DRI are based on an assumption of minimal UVB sunshine exposure [Citation1]. This is a precautionary approach and it is accepted that DRI are over-estimates of dietary requirement during summer time when most individuals will have some UVB sun exposure. For individuals aged 1 y and older the DRI committee choose serum 25(OH)D concentrations of 40 and 50 nmol/L as the EAR-like and RDA-like values respectively. These served as the target serum concentrations upon which to base an EAR and RDA for dietary vitamin D, respectively [Citation1]. In terms of translating the serum 25(OH)D concentration targets into the EAR and RDA, the DRI committee used data from nine vitamin D intervention studies of individuals aged 6 to > 60 y performed at northern latitudes in Europe (>49.5 °N) and Antarctica (78 °S) during their respective winter seasons to establish regression equations of the simulated response of serum 25(OH)D concentration to total vitamin D intake. The EAR and RDA for vitamin D of 10 and 15 μg/d (20 μg/d for those >70 y), respectively, were derived from this regression analysis to approximate conditions of minimal UVB sun exposure [Citation1] (). The estimates from this regression analysis were mean values as the committee did not have sufficient data on variability of response to estimate vitamin D intakes that would keep 97.5 % of individuals above the serum 25(OH)D threshold. This was a move away from the conventional approach of defining the dietary EAR and adding two SDs to estimate to RDA (). Insufficient data in infants permitted the committee to set an AI value (10 μg/d of vitamin D) for those aged less than 1 year.
The DRI UL values for vitamin D range from 25–75 μg/d for children of different ages, to 100 μg/d for adolescents and adults, including pregnant and lactating women [Citation1] (). These were based on evidence of risk of hypercalcemia. These UL (except for those aged 0–12 months) are higher than the UL specified by an EFSA panel in 2006: 25 μg/d for children (0–10 years) and 50 μg/d for those aged 11 + years [Citation7].
Application of dietary reference intervals for vitamin D
There are a number of general considerations underpinning the establishment of DRV/DRI which need to be borne in mind when considering potential applications of dietary reference intervals:
DRV apply to groups of healthy people and are not necessarily appropriate for those with different needs arising from disease [Citation1,Citation2,Citation3].
DRV for any one nutrient presuppose that requirements for energy and all other nutrients are met [Citation1,Citation2,Citation3]. For example, despite the strong interactions between vitamin D and calcium, the DRV/DRI for vitamin D are set on the assumption that requirements for calcium are met and vice versa.
The reference values are expressed per person per day. This does not mean that those amounts should be taken every day; conceptually they represent the average intake over a period of time [Citation2].
Mindful of the above considerations, DRV/DRI can be used for different purposes, which include:
assessing the diets of groups [Citation2,Citation3]/assessing the risk of (in)adequacy of nutrient intake in populations [Citation1,Citation6]
assessing the diets of individuals [Citation2,Citation3]/assessing the risk of (in)adequacy of nutrient intake in individuals [Citation6]
for prescribing diets or provisions of food supplies [Citation2,Citation3]/dietary planning [Citation1,Citation6]
for food labelling purposes [Citation1,Citation2,Citation3,Citation6]
in establishing food based dietary guidelines [Citation6]
For the purposes of this review, I will only briefly refer to the first potential use, as assessing the adequacy of nutrient intake in populations is of relevance to Step 3 of the risk assessment framework. I will also distinguish this from use of RDV/DRI in assessing the adequacy of nutrient intake in individuals. The use of DRV/DRI in dietary planning, food labelling and in establishing food based dietary guidelines have been discussed in detail elsewhere [Citation2,Citation6]. In terms of assessing the risk of (in)adequacy of nutrient intake in populations, EFSA recently suggested in their 2010 opinion that the AR can be used to estimate the prevalence of inadequate intakes of micronutrients [Citation6], if the distribution of nutrient intakes is normal, and intakes are independent from requirements. The percentage of the population with a habitual daily nutrient intake lower than the AR is taken as an estimate of the percentage of the population with probable inadequate intakes. For example, at a median intake equal to the AR, 50 % of a population group will have intakes that may be inadequate for the chosen criterion of nutritional status [Citation6]. At a median intake level around the PRI, intakes are considered adequate for 97.5 % of the population group. However, as the PRI is an intake level that covers the requirement of 97–98 % of all individuals when requirements of the group have a normal distribution, it should therefore not be used as a cut-point for assessing nutrient intakes of groups because a certain overestimation of the proportion of the group at risk of inadequacy would result [Citation6]. Groups with mean intakes at or above the AI can be assumed to have a low prevalence of inadequate intakes for the defined criterion of nutritional status [Citation6]. Higher intakes convey no additional health benefit.
In terms of assessing diets of individuals, EFSA suggested in their 2010 opinion that while usual nutrient intakes of individuals may be compared with specific DRV (even though dietary intake data alone cannot be used to ascertain an individual's nutritional status), such comparisons are of limited use because of inherent problems in the validity of the assessment of usual dietary intake in individuals [Citation6], which is, in general, a sentiment supported by other agencies [Citation1–3]. Ideally, usual intake data should be combined with anthropometric, biochemical (status), and clinical information to provide a valid assessment of an individual's nutritional status [Citation6]. If DRV are going to be used for assessing diets of individuals, observed intakes below the LTI (if one will be set for vitamin D in the EFSA micronutrient DRV re-evaluation) have a very high probability of inadequacy; observed intakes of an individual below the AR very likely are inadequate because the probability of inadequacy is up to 50 %, and an intake between the AR and the PRI may be adequate because the probability of adequacy is higher than 50 % [Citation6]. For nutrients with an AI (i.e. without an AR), if an individual's usual intake equals or exceeds the AI, it can be concluded that the diet is almost certainly adequate. If, however, an individual's intake falls below the AI, no quantitative (or qualitative) estimate can be made of the probability of nutrient inadequacy.
The concept of the LTI/LRNI within the DRV framework could be extremely useful both for assessing the nutrient intake of individuals and the population as it would represent an intake below which metabolic integrity can not be maintained in most individuals [Citation6].
For nutrients for which a UL has been established chronic intakes above the UL may be associated with increased prevalence of adverse effects in the population and an increased risk of adverse effects in individuals, and should therefore be avoided [Citation6].
It is clear that with that much variability in current DRV/DRI, assessing the risk of (in)adequacy of vitamin D intake in individuals or populations one needs to be mindful of currency of the dietary reference intervals. Benchmarking European population intakes against the North American EAR may be a wise approach until such time as the UK and EU DRV re-evaluation process is finished. Readers are referred to the paper by Kiely & Black (in this issue) for more detailed analysis of population intakes of vitamin D from select countries relative to the EAR [Citation21].
Research requirements and conclusions
The DRI's for vitamin D have been the subject of intense controversy since the IOM report was launched in November 2010 [Citation22,Citation23], which is largely due to the persistence of fundamental knowledge gaps in vitamin D. These can be identified at the levels of exposure, metabolism, storage, status, dose-response, function and beneficial or adverse health effects in healthy individuals and in patient groups, as well as safe and effective application of intake recommendations at the population level through sustainable food-based approaches [Citation11].
In relation to the hazard identification and characterization steps of the DRV/DRI framework, the scarcity of information in some life-stages, particularly pregnancy, infancy and adolescence, as well as insufficient experimental data in human volunteers for non-skeletal health indicators, were all identified by the DRI committee as obstacles to defining vitamin D requirements using any but the indices of bone health listed above [Citation1]. Experimental data in appropriately designed studies, including randomized controlled trials (RCTs), are required to progress the debate and enable consideration of data appropriate to potentially vulnerable life-stages as well as clarify the putative role for vitamin D in non-skeletal health outcomes [Citation11]. Agencies that are currently re-evaluating dietary reference intervals for vitamin D over the next few years may well benefit from new data that has emerged since 2010 and which will continue to emerge in relation to relationship of health indicators to vitamin D status. Furthermore, such agencies may have scope to further refine the regression analysis and models used by the IOM DRI committee in setting the EAR and RDA, as the committee highlighted that the regression analysis had several assumptions and/or uncertainties [Citation1]. In addition, as the IOM DRI regression models were developed with serum 25(OH)D concentration targets of 40 and 50 nmol/L in mind, target concentrations below, or indeed above, these have important implications for use of these regression models and may require different models, as highlighted recently [Citation24]. This would be particularly the case for deriving a LRNI/TLI which might be based on a serum 25(OH)D concentration of ∼30 nmol/L, a cut-off suggested by the IOM to define vitamin D deficiency [Citation1] but also the value if one uses two coefficients of variation (30 %) below the IOM suggested EAR-like serum 25(OH)D concentration of 40 nmol/L [Citation1] (see ).
Because dermal production of vitamin D upon exposure to UVB radiation has such an important impact on vitamin D status, possibly stores, and consequently on vitamin D requirements, there is an urgent need for further consideration and investigation on whether a minimal or threshold UVB exposure level is possible to both enable subcutaneous vitamin D synthesis and avoid risk of skin cancer. Such information would greatly facilitate DRV revisions, as all agencies up to now have grabbled with the contribution of sun to vitamin D status and its implications for DRV/DRI. An example of the impact of sun on the North American DRI for vitamin D can be seen if one takes the IOM's regression equation arising from ‘winter-based’ RCTs performed in the latitude band 40–49.5oN (conducted between from October to May or part therein). These were not chosen for derivation of the EAR or RDA because there was evidence of some UVB contribution to vitamin D status within the RCTs even though the true summer months (June-September), when status could be dramatically improved, were avoided. The regression equation from these RCT predicts a vitamin D RDA of only 3.5 μg/d (140 IU/d) using serum 25(OH)D of 50 nmol/L, notably lower than the recommended 15 μg/d (600 IU/d) which come from data from RCTs conducted at >49.5°N/S where conditions of minimal UVB sun exposure were met [Citation1].
In conclusion, while the North American DRI are currently the most up to date, the revised DRV over the next few years may have an opportunity to capture the latest data and evidence.
Questions and answers
I Young, UK
In terms of translating the recommendations into what people actually eat, do you think that the estimated data index can be achieved by most of the population in the absence of food fortification or do you think that mandates for fortification will be required?
K Cashman
If you strip what we eat down to the bare bones we are getting very little from natural food containing vitamin D and it is extremely hard to convince people to eat more of those kinds of food, so part of the solution has to be the addition of vitamin D to certain foods. The option will be with at the EU member state level as to whether there will be mandatory inclusion in a number of foods or whether voluntary fortification is encouraged. Considering the food industry, in the IOM report, the upper level for vitamin D fortification has increased. One of the reasons why fortification is a worry for them is the risk of doing harm and that there was a small window between the recommended and the upper amount. With this increase, the upper amount has gone up as well and it should encourage them to look at it more seriously.
P Brannon, USA
I completely agree with Dr Cashman but I want to comment the Egg Board in the US has sponsored research which has been successful in increasing the vitamin D level in egg from 40 to 100 μg per egg. I think we can argue as to whether this is fortification or not; perhaps it is bio-fortification. It might be more value accepted than fortification by addition, since it has at least gone through a biological process. I think we are also going to see promotion of irradiated mushrooms, which are very high in vitamin D in the form of ergocalciferol. There are some interesting examples of bio-fortification which may change the nature of the food supply in the future.
K Cashman
There is a further diversion to bio-fortification whether it is eggs or meat in that you can, in eggs and in the tissue, certainly increase the vitamin D amount, but you can also increase the concentration of 25(OH)D3. You are going to get a five times higher response from 25(OH)D3 in food than you get from vitamin D. So additively you get a much bigger effect from some of the food delivery systems coming from the animal kingdom.
Acknowledgement
This study has been carried out with partial financial support from the Commission of the European Communities, specific RTD Programme “Quality of Life and Management of Living Resources”, within the 6th Framework Programme (Contract No. FP6-036196-2 EURRECA: EURopean micronutrient RECommendations Aligned). This manuscript does not necessarily reflect the views of the Commission and in no way anticipates the future policy in this area.
Declaration of interest: The author report no conflicts of interest. The author alone is responsible for the content and writing of the paper.
References
- Institute of Medicine Food and Nutrition Board. Dietary reference intakes for calcium and vitamin D. Washington, DC: National Academy Press, 2011.
- Department of Health. Dietary Reference Values for Food Energy and Nutrients for the United Kingdom. London, United Kingdom: Her Majesty's Stationery Office (Report on Health and Social Subjects; 41, 1991.
- Commission of the European Communities. Vitamin D. In Nutrient and Energy Intakes of the European Community. Report of the Scientific Committee for Food (31st series), pp. 132–139, Brussels, Luxembourg, 1993.
- Department of Health and Social Security. Recommended Intakes for Nutrients for the United Kingdom. London: HMSO, 1969.
- Department of Health and Social Security. Recommended Daily Amounts for Food Energy and Nutrients for Groups of People in the United Kingdom. London: HMSO, 1979.
- EFSA Panel on Dietetic Products, Nutrition, and Allergies (NDA); Scientific Opinion on principles for deriving and applying Dietary Reference Values. EFSA 2010; 8:1458. [30 pp.]. Available online: www.efsa.europa.eu.
- EFSA Panel on Dietetic Products, Nutrition, and Allergies (NDA); An opinion on tolerable upper intake levels for vitamins and minerals. Published in February 2006. Available online: www.efsa.europa.eu/en/science/nda/nda_opinions.html.
- Nordic Council of Ministers. Nordic Nutrition Recommendations 2004. Integrating nutrition and physical activity. Århus, Denmark: Scanprint as. 2004.
- Institute of Medicine. Dietary Reference Intakes for Calcium, Phosphorus, Magnesium, Vitamin D, and Fluoride. Washington, DC: National Academy Press, 1997.
- Seamans KM, Cashman KD. Existing and potentially novel functional markers of vitamin D status: a systematic review. Am J Clin Nutr 2009;89:1997S–2008S.
- Cashman KD, Kiely M. Towards prevention of vitamin D deficiency and beyond - knowledge gaps and research needs in vitamin D nutrition and public health. Brit J Nutr 2011;106:1617–27.
- Priemel M, von Domarus C, Klatte TO, Kessler S, Schlie J, Meier S, . Bone mineralization defects and vitamin D deficiency: histomorphometric analysis of iliac crest bone biopsies and circulating 25-hydroxyvitamin D in 675 patients. J Bone Miner Res 2010;25:305–12.
- IOM. Dietary Reference Intakes: The Essential Guide to Nutrient Requirements. Washington, DC: The National Academies Press, 2006.
- IOM. The Development of DRIs 1994–2004: Lessons Learned and New Challenges: Workshop Summary. Washington, DC: The National Academies Press, 2008.
- Taylor CL (2008) Framework for DRI Development: Components “Known” and Components “To Be Explored”. Washington, DC, 2008.
- Cranney A, Horsley T, O'Donnell S, Weiler H, Puil L, Ooi D, . Effectiveness and Safety of Vitamin D in Relation to Bone Health. Evidence Report/Technology Assessment No. 158 (Prepared by the University of Ottawa Evidence-based Practice Center (UO-EPC) under Contract No. 290–02–0021]. AHRQ Publication No. 07-E013. Rockville, MD: Agency for Healthcare Research and Quality, 2007.
- Chung M, Balk EM, Brendel M, Ip S, Lau J, Lee J, . Vitamin D and Calcium: A Systematic Review of Health Outcomes. Evidence Report No. 183 (Prepared by the Tufts Evidence-based Practice Center under Contract No. HHSA 290–-–2007-10055-I.) AHRQ Publication No. 09-E015. Rockville, MD: Agency for Healthcare Research and Quality, 2009.
- UK Department of Health. Nutrition and Bone health: with particular reference to calcium and vitamin D. Report on Health and Social Subjects (49). London, United Kingdom: The Stationary Office, 1988.
- Scientific Advisory Committee on Nutrition (SACN). Update on vitamin D: position statement by the Scientific Advisory Committee on Nutrition, 2007. http://www.sacn.gov.uk/pdfs/sacn_position_vitamin_d_2007_05_07.pdf
- Chief Medical Officers of the UK. Vitamin D – advice on supplements for at risk groups. 2012. http://www.dh.gov.uk/en/Publicationsandstatistics/Lettersandcirculars/Dearcolleagueletters/DH_132509.
- Kiely M, Black LJ. Dietary strategies to maintain adequacy of circulating 25-hydroxyvitamin D concentrations. Scand J Clin Lab Invest, 2012;72(Suppl 243):14–23.
- Holick, M.F, Binkley NC, Bischoff-Ferrari HA, Gordon CM, Hanley DA, Heaney RP, Murad MH, Weaver CM, Endocrine Society. Evaluation, treatment, and prevention of vitamin d deficiency: an endocrine society clinical practice guideline. J Clin Endocrinol Metab 2011;96(12):3908.
- Cashman KD, Kiely M. Nutrition: new guidelines on vitamin D-ficiency—clear or confusing? Nat Rev Endocrinol 2011;7:566–8.
- Cashman KD, Fitzgerald AP, Kiely M, Seamans KM. (2011). A systematic review and meta-regression analysis of the vitamin D intake-serum 25-hydroxyvitamin D relationship to inform European recommendations. Br J Nutr 2011;106:1638–48.