
ABSTRACT
To report a time course of the ganglion cell complex (GCC) and circumpapillary retinal nerve fibre layer (cpRNFL) thicknesses using spectral-domain optical coherence tomography in patients with non-arteritic anterior ischaemic optic neuropathy (NAION), five patients with unilateral NAION were studied (the average age of 66.8 ± 7.8 years old). Forty-one age-matched normal controls were also enrolled. The GCC and cpRNFL thicknesses were measured at the initial visit and at 1, 3, 6, and 12 months using RTVue-100. The GCC thickness and the cpRNFL thickness of the patients were compared with those of the normal controls. The GCC thickness in the NAION patients was 96.49 μm at the initial visit, 84.28 μm at 1 month, 74.26 μm at 3 months, 71.23 μm at 6 months, and 69.51 μm at 12 months. The values at 1, 3, 6, and 12 months were significantly reduced (p < 0.01). The cpRNFL thickness at the initial visit was significantly increased, whereas the values at 6 and 12 months were significantly reduced (p < 0.01). The GCC thickness is more useful for the detection of retinal ganglion cell loss at an early stage than the cpRNFL thickness, because the GCC thickness is unaffected by optic disc swelling at the initial visit, unlike the cpRNFL thickness.
Introduction
Non-arteritic anterior ischaemic optic neuropathy (NAION) is caused by ischaemia in the peripheral side of the lamina cribrosa of the optic disc, which leads to indolent acute unilateral visual loss. NAION is often observed in middle-aged patients older than 50 years old with a sudden onset of painless unilateral visual loss.Citation1 The main visual field defects observed are inferior altitudinal visual field defects and a central scotoma.Citation2,Citation3 The risk factors for the development of the disease are hypertension, arteriosclerosis, diabetes, cardiovascular disease, and internal carotid artery occlusion. These factors may result in axonal swelling when the flow of axons is inhibited by dense axons in the lamina cribrosa of small optic discs. The axonal swelling tends to occur in crowded optic discs.Citation4–Citation6
Optical coherence tomography (OCT) is a non-invasive imaging technique that makes it easy to obtain retinal tomographic images, and is also capable of quantifying the circumpapillary retinal nerve fibre layer (cpRNFL). Several studies of the cpRNFL thickness using OCT in patients with NAION have been reported.Citation7–Citation9 However, the presence of retinal ganglion cell loss at an early stage may be masked by a significantly increased cpRNFL thickness in patients with NAION due to severe optic disc swelling. Therefore, cpRNFL thickness measurements may not be able to detect the retinal ganglion cell loss at an early stage in NAION.
Spectral-domain (SD) OCT provides clear advantages over other techniques in terms of its high-speed scans with high resolution, the ability to perform an advanced imaging analysis, and more accurate segmentation of the retinal layer compared with that of conventional OCT. Moreover, SD-OCT is capable of evaluating more detailed pathological changes.Citation10–Citation13 In particular, an analysis of the macular inner retinal layer thickness is useful for detecting retinal ganglion cell loss in patients with glaucoma.Citation14–Citation18
As part of our investigations of optic neuropathy, we previously reported that two patients showed rapid thinning of the ganglion cell complex (GCC) starting early after the onset of paediatric optic neuritis.Citation19 In patients with optic neuritis, atrophy of the GCC occurs due to the apoptosis of retinal ganglion cells induced by demyelination beginning early after the onset of the disease. Our results revealed that the papillomacular bundle and cpRNFL suffer progressive loss even after treatment, and these changes are irreversible. Syc et al.Citation20 also reported that ganglion cell layer and inner plexiform layer measurement are useful for evaluating the retinal thickness in the acute stage of optic neuritis. Therefore, we hypothesised that measurement of the macular inner retinal thickness would be able to detect the retinal ganglion cell loss at an early stage in NAION patients with severe disc swelling.
Recently, a few studies utilizing SD-OCT have reported that the GCC thickness is reduced in NAION patients.Citation21–Citation22 However, to our knowledge, there have been no reports of the time course of changes in NAION using the GCC thickness, which is considered to be unaffected by optic disc swelling. Thus, the purpose of the present study was to evaluate the time course of the GCC thickness using SD-OCT in patients with NAION.
Materials and methods
Patients with NAION diagnosed by ophthalmic examination agreed to participate in this study at the Department of Ophthalmology in Kawasaki Medical School Hospital. Normal subjects recruited as an age-matched control group were also enrolled. The study protocol adhered to the tenets of the Declaration of Helsinki and was approved by the institutional review board of Kawasaki Medical School.
All patients underwent ocular examinations, including measurements of the best-corrected visual acuity, a slit-lamp examination, intraocular pressure measured with Goldmann applanation tonometry, the critical flicker frequency (CFF) using the Handy Flicker HF (Neitz Instruments Co., Ltd., Tokyo, Japan), funduscopy, fundus photography, fluorescein fundus angiography (FA), visual field tests using a Humphrey field analyser (Carl Zeiss Meditec, Dublin, CA, USA), Goldmann perimetry (Haag-Streit, Bern, Switzerland), SD-OCT, and magnetic resonance imaging. Normal control subjects underwent evaluations with a Humphrey field analyser using the central 30-2 Swedish Interactive Threshold Algorithm (SITA) program.
A normal visual field was defined as the absence of any cluster of at least three points with p < 5%, one point with p < 0.5% or 1% on the pattern deviation probability plot, excluding the two points above and below the blind spot and within the normal limits in the glaucoma hemifield test and the 95% confidence interval. Reliable visual field results obtained with the Humphrey field analyser were defined as those with a fixation loss of less than 20% and false-positive and false-negative errors of less than 20%.
The inclusion criteria for the normal control subjects were as follows: best-corrected visual acuity 20/40 or better, range of spherical refractive power from −5.75 dioptres (D) to +2.75 D, cylinder refractive power within ±3.00 D, intraocular pressure <22 mm Hg, and no history of intraocular surgery or trauma, retinal diseases including diabetic retinopathy, optic nerve diseases such as glaucoma, or any other disease affecting the visual field. The patients with moderate cataracts affecting the quality of SD-OCT images were also excluded.
Measurement of the GCC and cpRNFL thicknesses using SD-OCT
The SD-OCT examinations were performed using an RTVue-100 (Optovue, Fremont, CA, USA) device at the initial visit and at 1, 3, 6, and 12 months. The specifications for SD-OCT were such that the light source was a 840-nm superluminescent diode with a spectrum band width of 50 nm, axial resolution of 5.0 μm, A-scan/second of 26,000, and a focus range of −15.00 D to +20.00 D. The RTVue-100 software program version 4.0 was used for the data analysis.
A GCC protocol was used to obtain the GCC thickness and parameters. The GCC measurements consisted of one horizontal line scan 7 mm in length (467 A-scans) and 15 vertical line scans 7 mm in length (each 400 A-scans) taken at 0.5-mm intervals. The centre of the measurement was shifted 0.75 mm temporally and covered a 7 × 7 mm rectangular area. This scan configuration provided 14,810 A-scans in 0.58 s. The GCC thickness was defined as the distance between the inner limiting membrane (ILM) and the outer border of the inner plexiform layer (IPL) (). The GCC measurements included the GCC thickness as a total, the superior and inferior hemiretinas, and GCC parameters such as the focal loss volume (FLV) and global loss volume (GLV). The FLV was represented as a focal thinning of the GCC within the scan area. The GLV was represented as a global thinning of the GCC in the scan area.
The optic nerve head map (ONH) protocol was used to obtain the cpRNFL thickness and optic disc parameters. This protocol was based on the three-dimensional baseline mode where a 6 × 6 mm area scan was centred on the optic disc. The shape of the optic disc margin and anchoring point of the retinal pigment epithelium were automatically defined according to the three-dimensional baseline mode. Then, 13 concentric circle ring scans of 1.3 to 4.9 mm in diameter (425–965 A-scans each) and 12 radial line scans of 3.4 mm (452 A-scans each) were centred on the optic disc in a 4.9 mm area. The cpRNFL thickness on a circle at 3.45 mm in diameter from the centre of the optic disc was calculated (). The ONH measurements included the total cpRNFL thickness and superior and inferior hemiretinas.
Figure 1. Measurements of the GCC and cpRNFL thicknesses using the RTVue-100. (A) The GCC protocol. The GCC measurements consisted of one horizontal line scan 7 mm in length and 15 vertical line scans 7 mm in length taken at 0.5-mm intervals in a 7 × 7 mm area. The GCC thickness was defined as the distance between the inner limiting membrane and the outer border of the inner plexiform layer. (B) The ONH protocol. The ONH measurements were performed with 13 concentric circle ring scans and 12 radial line scans. GCC = ganglion cell complex; cpRNFL = circumpapillary retinal nerve fibre layer; ONH: optic nerve head map; RE: right eye.
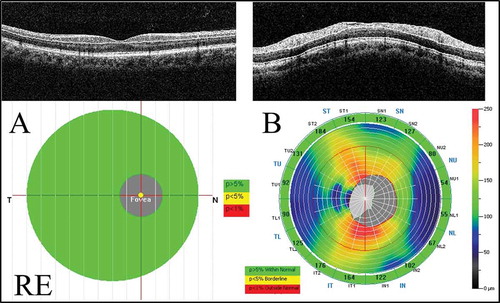
The significance maps of the GCC and cpRNFL thickness are presented in comparison with the age-matched normal control database. The map is colour-coded. The colour code was divided into three colours, where green represents a value within the normal limits (p value 5–95%), yellow represents a borderline value (p value <5%), and red represents a value outside of normal (p value <1%).
The GCC and cpRNFL thickness measurements were performed several times, and the most reliable data were selected. Images with signal strength index scores <45 or with segmentation errors were excluded. The SD-OCT examinations were performed by experienced technicians (K.G., S.A.), and the results were analysed by neuro-ophthalmology specialists (A.M., Y.I.).
Statistical analysis
The statistical analyses were performed using the Statistical Package for Social Science software package version 22.0 (SPSS, IBM, Tokyo, Japan). The Mann-Whitney U test was used to detect differences in the characteristics between normal control subjects and NAION patients. The GCC and cpRNFL thicknesses were compared with those of normal control subjects using a one-way analysis of variance (one-way ANOVA). Steel and Tukey post hoc multiple comparisons were used if there was a significant difference in the one-way ANOVA. A statistically significant difference was defined by a value of p < 5%.
Results
Five patients with NAION and 41 normal control subjects were included in this study. The clinical data for NAION patients are shown in . The NAION patients were three males and two females with an average age of 66.8 ± 7.8 years. Their average spherical equivalent was 0.80 ± 1.27, and the average disease duration was 8.6 ± 8.5 days. The normal control subjects were 14 males and 27 females with an average age of 63.0 ± 7.6 years (51 to 77 years). Their average refractive error in spherical equivalents was −0.38 ± 1.68 (+2.25 to −5.75 D). There was no significant difference in the age or refractive error between NAION eyes and normal control eyes. There was a significant difference between groups in both the mean deviation and pattern standard deviation of the visual field parameters ().
Table 1. The clinical data for the patients with non-arteritic anterior ischaemic optic neuropathy.
Table 2. The demographic characteristics of the normal control subjects and patients with NAION.
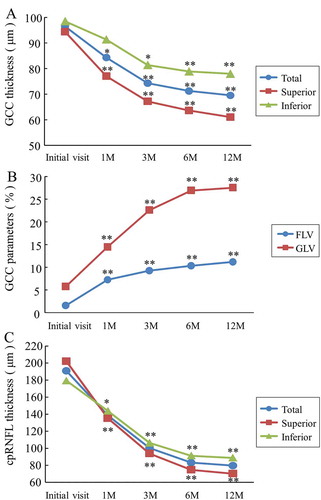
shows the time course of GCC thickness, its parameters, and the cpRNFL thickness. The total GCC thicknesses in the NAION patients, at 1, 3, 6, and 12 months, were significantly reduced compared with that of the normal controls (p < 0.01) and decreased over time. Thinning of the superior and inferior GCC thicknesses was observed at 1 and 3 months, respectively, compared with that of the normal controls (p < 0.01). In addition, the total and superior GCC thicknesses at 1, 3, 6, and 12 months in the NAION patients were significantly reduced compared with those at the initial visit (p < 0.05) ().
Table 3. The time course of the GCC and cpRNFL thicknesses determined using SD-OCT in patients with NAION.
The FLV was 1.58 ± 0.72% at the initial visit, 7.25 ± 2.39% at 1 month, 9.25 ± 2.42% at 3 months, 10.30 ± 2.16% at 6 months, and 11.17 ± 2.59% at 12 months, and increased over time. The FLVs in the NAION patients at the initial visit and at 1, 3, 6, and 12 months were significantly increased compared with the average of 0.52 ± 0.55% of the normal controls (at the initial visit: p < 0.05; 1, 3, 6, and 12 months: p < 0.01). Similarly, the GLVs at 1, 3, 6, and 12 months were significantly increased compared with those of the normal controls (p < 0.01) and increased over time. In addition, the FLVs and GLVs at 1, 3, 6, and 12 months in the NAION patients were significantly increased compared with the initial visit (p < 0.01) ().
The total cpRNFL thickness at the initial visit in the NAION patients was significantly increased compared with that of the normal controls, and the values at 6 and 12 months were significantly reduced compared with those of the normal controls (p < 0.01). Thinning of the superior and inferior cpRNFL thicknesses were observed at 6 and 12 months, respectively (p < 0.01 and p < 0.05, respectively). In addition, the total and superior cpRNFL thicknesses at 1, 3, 6, and 12 months in the NAION patients were significantly reduced compared with that at the initial visit (p < 0.01) ().
Figure 2. The time course of SD-OCT parameters in the NAION patients. (A) The GCC thickness. There was a significant reduction of the total and superior GCC thicknesses observed at 1 month compared with those at the initial visit (*p < 0.05 and **p < 0.01, respectively). (B) The GCC parameters. The FLV and GLV were significantly increased at 1 month compared with the initial visit (**p < 0.01). (C) The cpRNFL thickness. Each cpRNFL thickness was significantly reduced at 1 month compared with the value at the initial visit (total and superior: **p < 0.01, inferior: *p < 0.05). SD-OCT = spectral domain optical coherence tomography; NAION = non-arteritic anterior ischaemic optic neuropathy; FLV = focal loss volume; GLV = global loss volume.
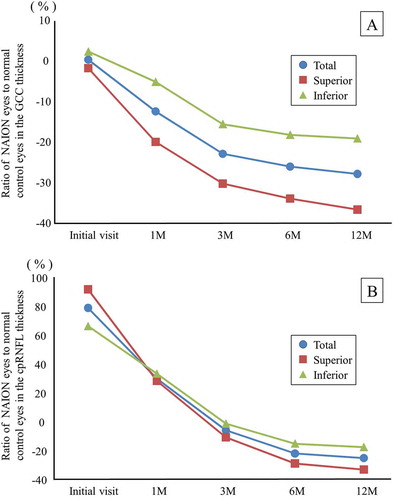
shows the time course of the mean ratio of the NAION eyes to the normal control eyes in terms of the GCC and cpRNFL thicknesses. The GCC thicknesses did not show any significant change at the initial visit, but were reduced over time. At 12 months, the average loss rate of the total GCC thickness was 27.44%, that of the superior GCC thickness was 36.24%, and that of the inferior GCC thickness was 18.67% (). The cpRNFL thicknesses showed a significant increase at the initial visit by 78.38% on total, 91.24% in the superior region, and 65.81% in the inferior region. The cpRNFL thicknesses were reduced over time, and the loss rates were 25.67% on total, 33.60% in the superior region, and 17.93% in the inferior region at 12 months ().
Figure 3. The time course of the mean ratio of the GCC and cpRNFL thickness in the NAION eyes to the normal control eyes. (A) The GCC thickness. The reduction rate of the GCC thickness at 12 months was the highest in the superior region. (B) The cpRNFL thickness. The superior cpRNFL thickness was significantly increased at the initial visit, and the loss rate was the highest at 12 months.
Case reports
Case 1
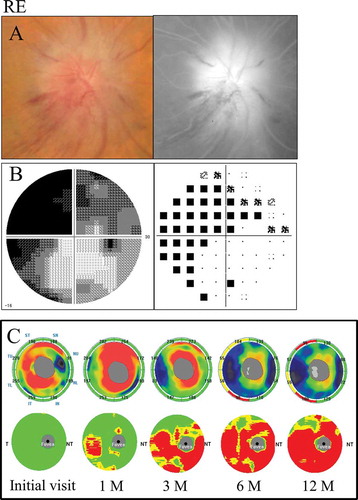
A 66-year-old female with hypertension was referred to us with 2-day history of acute left visual loss. Her corrected visual acuity was 1.5 in the right eye and 1.2 in the left eye. Her intraocular pressure was 13 mm Hg in the right eye and 11 mm Hg in the left eye. The pupil reaction was incomplete in the left eye and a relative afferent pupillary defect (RAPD) OS was present. The CFF was 35 Hz in the right eye and 30 Hz in the left eye. Optic disc swelling was observed in the fundus examination. The FA images showed leakage of the optic disc (). Inferior altitudinal field loss was demonstrated by a Humphrey field analyser ().
The GCC significance map indicated thinning of the superior hemisphere corresponding to the inferior hemifield loss at 1 month after the onset, and the thinning area along the horizontal meridian gradually expanded over time. On the other hand, the cpRNFL significance map showed a significant reduction in the superior temporal sectors at 3 months ().
Figure 4. A 66-year-old female with inferior altitudinal field loss (case 1). (A) Left: a fundus photograph showed optic disc swelling; Right: FA images showed leakage of the optic disc. (B) Left: grey scale; Right: pattern deviation. The Humphrey visual field test showed inferior altitudinal field loss along the horizontal meridian. (C) Top: the cpRNFL significance map; Bottom: the GCC significance map. The cpRNFL significance map was increased at the initial visit and at 1 month due to optic disc swelling, and a significant reduction was observed at 3 months in the superior temporal sectors. The GCC significance map at 1 month showed thinning of the superior hemifield along the horizontal meridian corresponding to the inferior altitudinal field loss. The thinning area gradually spread over time. LE = left eye.

Case 5
A 72-year-old male with diabetes and stenosis of the internal carotid artery was referred to us with 3-week history of acute unilateral visual loss. His corrected visual acuity was 0.3 in the right eye and 1.2 in the left eye. His intraocular pressure was 11 mm Hg in the right eye and 13 mm Hg in the left eye. The pupil reaction was incomplete in the right eye and RAPD OD was present. The CFF was 23 Hz in the right eye and 32 Hz in the left eye. Severe optic disc swelling with splinter haemorrhage was observed in the fundus examination. The FA images showed leakage of the optic disc and a filling delay in the inferior area (). Diffuse visual field loss denser superiorly was detected by a Humphrey field analyser ().
The GCC significance map indicated predominant thinning of the inferior hemifield corresponding to the diffuse visual field loss denser superiorly at 3 months after the onset. However, the thinning area expanded beyond the horizontal meridian over time. On the other hand, the cpRNFL significance map showed a significant reduction in the inferior sectors beginning at 6 months and in the superior and inferior sectors at 12 months ().
Figure 5. A 72-year-old male with diffuse visual field loss that was more dense superiorly (case 5). (A) Left: a fundus photograph showed severe optic disc swelling with splinter haemorrhage; Right: FA images showed the leakage of the optic disc and a filling delay in the inferior region. (B) Left: grey scale; Right: pattern deviation. The Humphrey visual field test showed diffuse visual field loss that was more dense in the superiorly. (C) Top: the cpRNFL significance map; Bottom: the GCC significance map. The cpRNFL significance map was increased until 3 months due to optic disc swelling, and significant thinning was observed in the inferior sectors at 6 months and in the superior and inferior sectors at 12 months. The GCC significance map showed thinning of the area at 1 month after the onset. Moreover, the GCC thickness at 3 months indicated predominant thinning of the inferior hemifield corresponding to the diffuse visual field loss, which was denser in the superior region. However, the thinning area expanded beyond the horizontal meridian over time. The GCC significance map showed good agreement with the visual field loss pattern. RE = right eye.
Discussion
Our results indicated that the GCC thickness in NAION patients was already significantly reduced at 1 month after the onset compared with that of the normal controls, whereas the cpRNFL thickness was only found to be significantly reduced at 6 months. We found that the retinal ganglion cell loss in NAION patients had occurred within 1 month after the onset, and the GCC thickness further decreased over time. Therefore, we demonstrated that GCC thickness measurement is capable of detecting the ganglion cell loss earlier after the onset than cpRNFL thickness measurement.
Some authors have previously reported the time course of cpRNFL thickness in NAION patients using OCT.Citation7–Citation9 For example, Savini et al.Citation7 and Bellusci et al.Citation8 reported that the cpRNFL thickness during the acute phase in NAION patients was increased in all quadrants due to severe disc swelling. The cpRNFL thickness in the chronic phase was reduced in all quadrants.Citation8 Contreras et al.Citation9 reported that the cpRNFL thickness during the acute phase in the affected eye was 200.9 ± 52.3 μm (96.4%), which was significantly increased compared with that in the unaffected eye. The percentage of cpRNFL thickness loss was 42.3% at 6 months, when its reduction reached a plateau. The cpRNFL thickness loss at 6 months in each quadrant was 51.5% in the superior, 28.5% in the nasal, 41.2% in the inferior, and 38.2% in the temporal, and the reduction in the superior quadrant was more apparent than that in other quadrants. Contreras et al.Citation9 reported that this finding was in accordance with the high prevalence of inferior visual field loss in NAION patients.
In our study, the total cpRNFL thickness at the initial visit in patients with NAION was significantly increased by 78.38% compared with that of the normal controls, and the cpRNFL thickness at 6 and 12 months was significantly decreased by 22.43% and 25.67%. The reduction rate of the superior cpRNFL thickness was highest in the cpRNFL parameters, and the value at 12 months was 33.60%. This result was in agreement with the high percentage of patients who had an inferior hemifield loss in our study. In addition, the thinning of the cpRNFL thickness reached a plateau at 6 months, similar to the finding in a previous reportCitation9 that utilized Stratus OCT. It is clear from our results and the previous reports that cpRNFL measurement in NAION patients cannot detect the retinal ganglion cell and axonal loss during the acute phase. This is because the cpRNFL thickness was significantly increased by disc swelling in the acute stage, resulting in masked retinal ganglion cell loss. In fact, the ratio of superior cpRNFL thickness was the most increased at the initial visit and was the most decreased at 12 months. These results suggest that the increase in the cpRNFL thickness during the acute stage implies a degree of ischaemia.
Using SD-OCT, Aggarwal et al.Citation21 reported that the pattern of altitudinal GCC loss in chronic NAION corresponded to the visual field loss. Gonul et al.Citation22 reported that the GCC thickness in chronic NAION was significantly reduced compared with that in normal controls. Furthermore, the FLV and GLV of the GCC parameters had the strongest abilities to detect ganglion cell loss among the various OCT parameters and were comparable to the cpRNFL thickness. Larrea et al.Citation23 reported that the average GCC thickness determined using Cirrus OCT was 68.33 μm during the acute phase and 54.87 μm at 6 months, and there was a significant reduction between the acute and chronic phases. The percentage reduction in the average GCC thickness from the acute to the chronic phases was 19.7%. Moreover, Larrea et al.Citation23 found that a GCC analysis in the macular region could detect early axonal damage during the acute onset of NAION.
To our knowledge, this is the first report to include a detailed time course of the GCC thickness in NAION patients. Our study revealed that the total GCC thickness was significantly reduced, although the cpRNFL thickness was increased, at 1 month after the onset. The percentage of total GCC loss compared with the value in normal controls was 12.03% at 1 month and 27.44% at 12 months. The loss rate of the superior GCC thickness was the highest, and the value at 12 months averaged 36.24%. This result was consistent with the finding that the loss rate of the cpRNFL thickness was the highest in the superior area (33.60%). In addition, FLV and GLV parameters were significantly increased at the initial visit and at 1 month, respectively. This result suggests that ganglion cell loss has already occurred at the acute stage, whereas the cpRNFL thickness was significantly increased due to optic disc swelling. Therefore, we consider that the FLV parameter can detect the ganglion cell loss earlier than any other GCC or cpRNFL parameter. Moreover, the GCC significance maps in our patients indicated that the thinning area corresponded well with the visual field loss pattern, similar to a previous report.Citation21 The pattern of GCC thinning may have reflected detailed structural changes caused by ischaemia of the optic nerve.
In experimental AION models and histological studies, Lee et al.Citation24 reported that RGC axons showed severe degenerative changes within 1 week after the ischaemic event. Slater et al.Citation25 reported that apoptosis of the RGC occurs maximally in the 2 to 3 weeks after an infarct. In experimental animal models of AION evaluated using SD-OCT, Ho et al.Citation26 reported that the manually segmented GCC thickness 1 day after an ischaemic event using circular scan centred at the optic disc showed a 31% increase compared with that of the normal controls. The value was thinner at 2 weeks and showed a gradual thinning, which reached a plateau at 3 weeks, when it showed a reduction of 11%. Maekubo et al.Citation27 reported that the automatically segmented inner retinal thickness in 3 mm diameter circle area centred at the optic disc significantly increased until 1 week after insult, returned to the baseline at 2 weeks, and decreased gradually until 3 months. Our present results showing that ganglion cell loss was detected by the FLV parameter at the initial visit are consistent with the findings in experimental models and histological studies.
There are several limitations associated with the present study. First, this study included a small number of patients. Therefore, a subgroup analysis could not be performed by classification according to the pattern of visual field loss due to the small sample size. Second, optic disc swelling at the initial visit has the potential to affect the structure of the nasal retina in the macular region. Third, in some patients with NAION, subretinal fluid associated with NAION has been observed in the subfoveal space,Citation28 so there is a possibility that an error in the analysis of the GCC segmentation accuracy might occur. Therefore, GCC measurements may not be accurate in all patients with NAION. Further research with a larger sample size is necessary to fully elucidate the time course of the GCC thickness in patients with each visual field loss pattern category.
In conclusion, measurements of the GCC thickness and the FLV and GLV parameters using SD-OCT are suitable for the objective evaluation and early detection of ganglion cell loss during the acute stage of NAION. Moreover, GCC thickness measurements can demonstrate the ganglion cell loss in the early stage when cpRNFL measurements cannot detect the axonal loss due to optic disc swelling.
Funding
Japan Society for the Promotion of Science (JPSP) provided financial support in the form of KAKENHI Grants-in-Aid funding (grant number 26462703). The sponsor had no role in the design or conduct of this research.
Declaration of interest
The authors report no conflicts of interest. The authors alone are responsible for the content and writing of the paper.
Additional information
Funding
References
- Hattenhauer MG, Leavitt JA, Hodge DO, Grill R, Gray DT. Incidence of nonarteritic anterior ischemic optic neuropathy. Am J Ophthalmol 1997;123:103–107.
- Hayreh SS, Zimmerman B. Visual field abnormalities in nonarteritic anterior ischemic optic neuropathy: their pattern and prevalence at initial examination. Arch Ophthalmol 2005;123:1554–1562.
- Gerling J, Meyer JH, Kommerell G. Visual field defects in optic neuritis and anterior ischemic optic neuropathy: distinctive features. Graefes Arch Clin Exp Ophthalmol 1998;236:188–192.
- Beck RW, Servais GE, Hayreh SS. Anterior ischemic optic neuropathy. IX. Cup-to-disc ratio and its role in pathogenesis. Ophthalmology 1987;94:1503–1508.
- Jonas JB, Xu L. Optic disc morphology in eyes after nonarteritic anterior ischemic optic neuropathy. Invest Ophthalmol Vis Sci 1993;34:2260–2265.
- Burde RM. Optic disk risk factors for nonarteritic anterior ischemic optic neuropathy. Am J Ophthalmol 1993;116:759–764.
- Savini G, Bellusci C, Carbonelli M, Zanini M, Carelli V, Sadun AA, Barboni P. Detection and quantification of retinal nerve fiber layer thickness in optic disc edema using stratus OCT. Arch Ophthalmol 2006;124:1111–1117.
- Bellusci C, Savini G, Carbonelli M, Carelli V, Sadun AA, Barboni P. Retinal nerve fiber layer thickness in nonarteritic anterior ischemic optic neuropathy: OCT characterization of the acute and resolving phases. Graefes Arch Clin Exp Ophthalmol 2008;246:641–647.
- Contreras I, Noval S, Rebolleda G, Muñoz-Negrete FJ. Follow-up of nonarteritic anterior ischemic optic neuropathy with optical coherence tomography. Ophthalmology 2007;114:2338–2344.
- Sander B, Larsen M, Thrane L, Hougaard JL, Jørgensen TM. Enhanced optical coherence tomography imaging by multiple scan averaging. Br J Ophthalmol 2005;89:207–212.
- Sakamoto A, Hangai M, Yoshimura N. Spectral-domain optical coherence tomography with multiple B-scan averaging for enhanced imaging of retinal diseases. Ophthalmology 2008;115:1071–1078.
- Hangai M, Yamamoto M, Sakamoto, Yoshimura N. Ultrahigh-resolution versus speckle noise-reduction in spectral-domain optical coherence tomography. Opt Express 2009;17:4221–4235.
- Nukada M, Hangai M, Mori S, Nakano N, Nakanishi H, Ohashi-Ikeda H, Nonaka A, Yoshimura N. Detection of localized retinal nerve fiber layer defects in glaucoma using enhanced spectral-domain optical coherence tomography. Ophthalmology 2011;118:1038–1048.
- Tan O, Chopra V, Lu AT, Schuman JS, Ishikawa H, Wollstein G, Varma R, Huang D. Detection of macular ganglion cell loss in glaucoma by Fourier-domain optical coherence tomography. Ophthalmology 2009;116:2305–2314.
- Mwanza JC, Oakley JD, Budenz DL, Chang RT, Knight OJ, Feuer WJ. Macular ganglion cell-inner plexiform layer: automated detection and thickness reproducibility with spectral domain-optical coherence tomography in glaucoma. Invest Ophthalmol Vis Sci 2011;52:8323–8329.
- Mwanza JC, Durbin MK, Budenz DL, Sayyad FE, Chang RT, Neelakantan A, Godfrey DG, Carter R, Crandall AS. Glaucoma diagnostic accuracy of ganglion cell-inner plexiform layer thickness: comparison with nerve fiber layer and optic nerve head. Ophthalmology 2012;119:1151–1158.
- Choi YJ, Jeoung JW, Park KH, Kim DM. Glaucoma detection ability of ganglion cell-inner plexiform layer thickness by spectral-domain optical coherence tomography in high myopia. Invest Ophthalmol Vis Sci 2013;54:2296–2304.
- Mwanza JC, Budenz DL, Godfrey DG, Neelakantan A, Sayyad FE, Chang RT, Lee RK. Diagnostic performance of optical coherence tomography ganglion cell-inner plexiform layer thickness measurements in early glaucoma. Ophthalmology 2014;121:849–854.
- Goto K, Mizukawa K, Miki A, Yamashita T, Araki S, Kiryu J. Two cases of optic neuritis in children with rapid thinning of the ganglion cell complex. Nihon Ganka Gakkai Zasshi 2013;117:1004–1011.
- Syc SB, Saidha S, Newsome SD, Ratchford JN, Levy M, Ford E, Crainiceanu CM, Durbin MK, Oakley JD, Meyer SA, Frohman EM, Calabresi PA. Optical coherence tomography segmentation reveals ganglion cell layer pathology after optic neuritis. Brain 2012;135:521–533.
- Aggarwal D, Tan O, Huang D, Sadun AA. Patterns of ganglion cell complex and nerve fiber layer loss in nonarteritic ischemic optic neuropathy by Fourier-domain optical coherence tomography. Invest Ophthalmol Vis Sci 2012;53:4539–4545.
- Gonul S, Koktekir BE, Bakbak B, Gedik S. Comparison of the ganglion cell complex and retinal nerve fibre layer measurements using Fourier domain optical coherence tomography to detect ganglion cell loss in non-arteritic anterior ischaemic optic neuropathy. Br J Ophthalmol 2013;97:1045–1050.
- Larrea BA, Iztueta MG, Indart LM, Alday NM. Early axonal damage detection by ganglion cell complex analysis with optical coherence tomography in nonarteritic anterior ischaemic optic neuropathy. Graefes Arch Clin Exp Ophthalmol 2014; 252:1839–1846.
- Lee GH, Stanford MP, Shariati MA, Ma JH, Liao YJ. Severe, early axonal degeneration following experimental anterior ischemic optic neuropathy. Invest Ophthalmol Vis Sci 2014;55:7111–7118.
- Slater BJ, Mehrabian Z, Guo Y, Hunter A, Bernstein SL. Rodent anterior ischemic optic neuropathy (rAION) induces regional retinal ganglion cell apoptosis with a unique temporal pattern. Invest Ophthalmol Vis Sci 2008;49:3671–3676.
- Ho JK, Stanford MP, Shariati MA, Dalal R, Liao YJ. Optical coherence tomography study of experimental anterior ischemic optic neuropathy and histologic confirmation. Invest Ophthalmol Vis Sci 2013;54:5981–5988.
- Maekubo T, Chuman H, Kodama Y, Nao-I N. Evaluation of inner retinal thickness around the optic disc using optical coherence tomography of a rodent model of nonarteritic ischemic optic neuropathy. Jpn J Ophthalmol 2013;57:327–332.
- Hedges TR 3rd, Vuong LN, Gonzalez-Garcia AO, Mendoza-Santiesteban CE, Amaro-Quierza ML. Subretinal fluid from anterior ischemic optic neuropathy demonstrated by optical coherence tomography. Arch Ophthalmol 2008;126:812–815.