
Abstract
The combination of stable isotope labeling of amino acids in mammals (SILAM) and laser capture microdissection (LCM) for selective proteomic analysis of the targeted tissues holds tremendous potential for refined characterization of proteome changes within complex tissues such as the brain. The authors have applied this approach to measure changes in relative protein abundance in ventral tegmental area (VTA) of the rat brain that correlate to pharmacological perturbations. Enriched 13C615N2-lysine was introduced in vivo via diet. These animals were sacrificed during the middle of the 12-hour light period to extract isotopically “heavy” proteins, which were then used as a reference for extracts from dosed, unlabeled rats. Animals were administered an orexin peptide (Ox-B), an orexin receptor antagonist (ORA), or a mixture of both (Ox-B + ORA). All samples were obtained at same phase of the sleep cycle. Labeled-pair identification and differential quantitation provided protein identification and expression ratio data. Five proteins were found to exhibit decreased relative abundance after administration of an ORA, including α-synuclein and rat myelin basic protein. Conversely, six proteins showed increased relative abundance upon antagonist treatment, including 2’,3’-cyclic nucleotide 3’-phosphodiesterase.
INTRODUCTION
Biochemical characterization of complex biology and diseases is a common challenge facing scientists in the biomedical and pharmaceutical sciences. A reductionist approach, breaking the system into more basic elements and studying the interaction of those elements, is one method towards understanding the nature of complex biology. In vitro models, although powerful and oftentimes predictive, are at many times insufficient and lack an appropriate level of contextual specificity for particular areas of biomedical research. For example, neuropathic pain and modulation of the sleep/wake cycle are two areas that are difficult to investigate based on in vitro models. Indeed, these and many other biochemical processes may be dynamically entwined with the intracellular, extracellular, and organ- and organism-level environments and require a system-wide approach.
Increased levels of orexin neuropeptides promote and maintain arousal and wakefulness, whereas a reduction in orexin signaling promotes sleep (for review, see (CitationMieda & Sakurai, 2013)). The activity of orexin neurons oscillates over a 24-hour period, with orexin peptide release rising during wakefulness, peaking late in the active phase and rapidly decreasing throughout the normal inactive phase (CitationGotter et al., 2013; CitationTaheri et al., 2000; CitationZeitzer et al., 2003). Pharmacological antagonism of the orexin system affords a novel approach for treating insomnia and has demonstrated efficacy in rodents, dogs, and humans, including patients with insomnia (CitationWinrow et al., 2011; CitationBrisbare-Roch et al., 2007; CitationHoever et al., 2013; CitationHerring et al., 2012; CitationBettica et al., 2012). The ability to regulate biologically important patterns, such as the sleep/wake cycle, with predictable periodicity is typically associated with the suprachiasmatic nuclei region of the mammalian brain. However, recent genetic evidence revealed that the ventral tegmental area (VTA) also displays activity that correlates to the normal sleep cycle in mammals (CitationWinrow et al., 2009). Physiologically, the VTA serves as the central region of the mesocorticolimbic dopamine system, which regulates cognition, motivational processing, and reward impulses.
Recent advances in mammalian tissue proteomics, such as in vivo stable isotope labeling amino acids in cells (SILAC; CitationKruger et al., 2008), have enabled accurate relative quantitation within rodent model systems (a.k.a. “SILAC Mouse” and stable isotope labeling amino acids in mammals [SILAM]; CitationMcClatchy et al., 2007). These approaches incorporate selective labeling of one or more amino acid residues in vivo. The result is the generation of endogenously translated, chemically identical, yet molecular weight–modified, labeled proteins in tissue that can be mixed in reference to a control or perturbed state for differential analysis through quantitative mass spectrometry. Examples of sample preparations that incorporate such heavy-isotope labeling schemes from diverse tissue types have been reported, including those for neuronal applications (CitationIshihama et al., 2005) and experiments that introduced 15N-label into Sprague-Dawley rats via enriched food pellets (CitationWu et al., 2004; CitationMcClatchy et al., 2007). Further optimization of these results indicated that progressive labeling of second-generation rats yielded as much as a 94% efficiency among all tissues examined (CitationMcClatchy et al., 2007). The use of a more selective 13C6-lysine in second- to fourth-generation mice demonstrated even further improved labeling efficiency while generating less complex mass spectra (CitationKruger et al., 2008). In addition, high-precision surgical technologies coupled with laser capture microdissection (LCM) now make it possible to isolate targeted nuclei with single-cell precision from surgically removed tissue. This approach has been used to successfully characterize the protein content or differential genomic profiles of a number of specific cell populations and organ substructures (CitationLiotta & Petricoin, 2000; CitationGeho et al., 2004; CitationSanders et al., 2008; CitationPatel et al., 2008).
Here, we apply 13C615N2-lysine SILAC labeling in combination with targeted tissue selection of the VTA and a multiarm dosing method for investigating the specific biochemical activity of a recently described orexin receptor antagonist (“compound 18,” referred to here as ORA; CitationMercer et al., 2013) in rat models. This antagonist exhibits ˜1400-fold binding selectivity and a 24-fold functional selectivity for orexin receptors OX2R over OX1R, with > 100-fold selectivity in a functional screen of 165 other targets, and significantly reduces active wake and promotes both rapid eye movement (REM) and non-REM sleep in rat electroencephalographic (EEG) studies (CitationMercer et al., 2013). Our group and others have demonstrated that structurally distinct OX2R antagonists effectively promote sleep in rodents and that administration of Ox-B peptide is sufficient to promote wakefulness (CitationDugovic et al., 2009; CitationMercer et al., 2013; CitationWinrow et al., 2010). Animals were given either the activating Ox-B peptide to promote wakefulness, the orexin receptor antagonist (ORA) to promote sleep or a combined treatment (Ox-B + ORA). Relative changes in peptide abundance were measured for labeled-pairs and then filtered based on the changes that correlate to locomotor activity, including increases relative to control with stimulant, decreases relative to control with antagonist, or intermediate to peptide and antagonist with combined treatment (or the opposite).
MATERIALS AND METHODS
Food Preparation, In Vivo Labeling, and Tissue Collection
Unmodified control rat diet and 13C615N2-lysine modified diet (100 g labeled Lys per 10 kg diet) were prepared by and purchased from Harlan-Teklad (Boston, MA), shipped at − 70°C, and kept frozen upon arrival. 13C615N2-lysine (> 98%) used in the modified diet was purchased from Sigma-Aldrich (St. Louis, MO). The in vivo labeling method was followed as reported by CitationMcClatchy et al. (2007; Protocol 2). Briefly, 2-day pregnant Sprague-Dawley rats (Taconic, Germantown, NY) were provided ad libitum access to water and 25 g of diet per day. Two dames were fed unmodified lysine (light) control diet and two dames were fed diet enriched with 13C615N2-lysine. The dames fed the unmodified diet were designated (light dame) LD1 and LD2 and the dames fed the heavy-isotope enriched diet were designated (heavy dame) HD1 and HD2. The pregnant dames were subjected to a 12 hours lights on (6:00 am) / 12 hours lights off (6:00 pm) schedule up until weaning, and the pups were continued on this schedule and their respective diets for up to seven additional weeks prior to necropsy. All pups were carefully inspected and deemed healthy. After birth, dame feed portions were increased to 50 g/day for 3 weeks. At weaning, males were selected to reduce potential experimental complexity due to the female reproductive cycle. Each weanling rat was housed individually and fed approximately 15 g/day of their respective diet for the next 4 weeks. At the end of 7 weeks, rats were euthanized for tissue preparation as described below. All animals used in this study were handled and housed in agreement with the federal animal welfare guidelines. All studies were approved in advance by the Institutional Animal Care and Use Committee at Merck Research Laboratories at West Point.
Beam Break Activity Measurement and Compound Administration
Male Sprague-Dawley rats (250–280 g) with surgically implanted intracerebroventricular (ICV) cannulas (Taconic Farms, surgical model no. SU009; lateral ventricle) were individually housed upon delivery. Rats had free access to food and water and were maintained on a 12 hours lights on (6:00 am) / 12 hours lights off (6:00 pm) schedule. Approximately 24 hours prior to dosing, each animal was placed within an infrared photobeam array that tracked activity in a xy-plane (ambulations and fine movements) and in the z-plane to record rearing behavior (Columbus Instruments, Columbus, OH). Baseline activity was recorded after all animals were placed in the array. Activity data (total beams interrupted) were analyzed using a customized Excel template and calculated as area under curve. Rats were placed into one of three treatment groups: Ox-B (RSGPPGLQGRAQRLIQASGNHAAGILTM, Ala11, D-Leu15, C-terminal amide; Tocris Bioscience, Ellisville, MO) (2 mM), ORA (30 mg/kg), or Ox-B+ ORA. The treatment groups were established as follows: on the day of the study, the orexin antagonist or vehicle was administered orally starting at ˜10:30 am and dosing was staggered at 7–8-minute intervals. After dosing, rats were returned to their home cage in the beam break array. Sixty minutes after ORA or vehicle dosing, each rat received an ICV infusion of either xxx cerebrospinal fluid artificial CSF (aCSF) (CMA Microdialysis, North Chelmsford, MA) or aCSF containing Ox-B using a CMA Microdialysis pump delivering 5 μL over 60 seconds. The injector cannula was left in place for an additional 30 seconds to allow dispersion into the CSF. Rats were then returned to the beam break array where the locomotor activity was recorded for another 60 minutes. At the end of the 60-minute period, rats were euthanized by decapitation, brains removed, rinsed in phosphate-buffered saline, and rapidly frozen on dry ice. Brains were isolated at 7 hours after “lights on” ± 30 minutes, representing the middle of the light period, and stored at − 80°C for future studies.
Laser Capture Microdissection and Protein Extraction
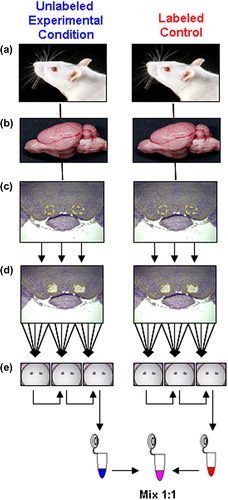
The process for isolation of specific brain regions is shown schematically in . Brain tissue sections (20 μm diameter) were prepared on polyethylene napthalate (PEN)-membrane slides (Molecular Devices, Sunnyvale, CA) from SILAC-labeled or compound-treated rats as described above. Specific brain regions were identified by cressyl violet staining using the LCM Staining Kit (Molecular Devices) (). shows the visualized regions that were then targeted and isolated by automated laser microdissection using the VERITAS platform (Molecular Devices), optimized for single-cell accuracy (CitationRodriguez et al., 2008). Two VTA sections were mounted on an individual CapSure Macro LCM Cap (MacroCap; Molecular Devices) for an average volume of 0.13 mm3 of VTA tissue per cap (). Samples were frozen at − 70°C immobilized on the MacroCap and mounted securely into the opening of 0.65-mL Eppendorf tubes. A modified version of the protocol, outlined by CitationEricsson et al. (2007), was used to extract whole protein from the immobilized brain sections. Briefly, proteins were extracted from the MacroCap-immobilized sections using sodium dodecyl sulfate–polyacrylamide gel electrophoresis (SDS-PAGE)–compatible extraction buffer consisting of 100 mM Tris-HCl (Sigma Aldrich, St. Louis, MO, USA), 0.2% Rapigest (Waters Corporation, Milford, MA, USA) and 1 × Protease Inhibitor Cocktail (Calbiochem, Billerica, MA, USA). While the samples were still frozen, 100 μL of extraction buffer per 0.13 mm3 of tissue was added to an Eppendorf tube and fitted with a MacroCap, one tube was used to pool all MacroCaps from each treatment group. Tubes were gently vortexed for 1 minute at room temperature, then inverted and incubated for 30 minutes at 70°C with shaking at 800 Hz. The tubes were then centrifuged at 13,300 × g for 10 minutes at 4°C. The extraction from the first MacroCap of each treatment group was used to serially extract the remaining two MacroCaps, resulting in a pooled extract for each treatment group (). Samples were frozen at − 20°C and stored until further processing. See Supplementary Materials (available online at http://informahealthcare.com/doi/abs/10.3109/01677063.2014.883389) for details regarding sample fractionation and liquid chromatography–tandem mass spectrometry (LC-MS/MS) analysis.
Figure 1. Isolation of specific brain regions from labeled and unlabeled rats. (a) Male F1 generation rats fed either control or isotopically labeled lysine–enriched chow (see Materials and Methods). (b) Rat brain regions are surgically isolated. (c) Ventral tegmental area (VTA; outlined in yellow) is removed, stained, and cut into defined volumes. (d) LCM produces five sections per slice (outlined in yellow), by laser-melding onto MacroCaps (see Materials and Methods). (e) Three MacroCaps are used per single sample, three rats and five slices per Macrocap. (f) Protein eluates are produced by serially extracting each group of MacroCaps in the same 100 μL of extraction buffer (see text).
Labeled-Pair Selection and Peptide Identification
The LC-MS data were processed using Elucidator version 3.2 (RosettaBiosoft, Seattle, WA) (CitationPaweletz et al., 2010). Briefly, the experimental definition was built using the “Differential-Labeled” design type and three technical replicates from sample were combined and aligned using the PeakTeller algorithm. Labeled-pairs (corresponding heavy and light peptides) were selected using the Labeled-Pair Ratio Builder in Elucidator with the following settings: a label of K8 (8.014 Da, 13C6 + 15N2), a maximum of three labels per peptide, 10 ppm error, and a retention time tolerance of ± 0.2 minutes. Raw intensity data for all “good” labeled-pairs (those meeting the above-mentioned criteria) were exported to Microsoft Excel for further analysis described below. In a separate analysis of the raw data in Elucidator, DTAs (text files corresponding to m/z and intensities from a given MS/MS spectra) were generated for all features and searched against concatenated rat forward and reverse sequenced database (38,401 forward protein sequences with entries from the Universal Protein Resource (www.uniprot.org), National Center for Biotechnology Information Reference Sequence (www.ncbi.nlm.nih.org), and proprietary data sets compiled as of 22 May 2010), using MASCOT (version 2.1; Matrix Science, London, UK). The following search parameters were used: trypsin cleavage, 0.3 precursor ion and 0.8 amu fragment ion tolerances, variable modifications including methionine oxidation, acetylation of cysteine side chains, and K8. Peptide sequences returned from Mascot were further filtered at a 1% peptide false-positive rate using Elucidator's PeptideTeller algorithm, an extension of the Prophets algorithm for estimating the accuracy of peptide identifications (CitationKeller et al., 2002).
Ratio Calculation, Logic Test, and Statistical Analysis
All ratio calculations and statistical analyses were performed using an R-language (CitationMuenchen & Hilbe, 2010) script developed in-house. Labeled-pairs selected based on m/z and retention time as described above, and their respective unlabeled and labeled intensities, were exported from Elucidator. Labeled-pairs that returned a zero-intensity for the heavy-labeled peak in control samples (untreated labeled mixed with untreated unlabeled) were removed from the data set. All other zero-intensities were replaced with one-half of the minimum intensity (400 units). We performed mixing error corrections, a label incorporation correction (as detailed in Supplementary Figure 1 available online at http://informahealthcare.com/doi/abs/10.3109/01677063.2014.883389), and a logic test of the data. Briefly, unlabeled-to-labeled ratios were calculated for each experimental condition (observed ratio, Robs) and control samples (label incorporation ratio, Rincorp) based on exported intensity values. To correct for mixing errors, the median (Robs) for each group was divided by the control Rincorp,median (Rincorp,median=0.62), resulting in the corrected observed ratios (Rcorr). To account for label incorporation differences for individual labeled-pairs, we divided the Rcorr by its corresponding Rincorp, resulting in the final ratio (Rnorm) as described by others (CitationSpellman et al., 2008; CitationLiao et al., 2008). The Rnorm values were then subjected to a logic test. Specifically, an Rnorm value must be > 1.2-fold for both Ox-B and ORA groups as well as satisfy one of the following conditions: either (Ox-B ratio > Ox-B+ ORA ratio > ORA ratio) or (ORA ratio > Ox-B+ ORA ratio > Ox-B ratio). Statistical simulations were performed to estimate the false-positive rate of correcting and selecting labeled-pairs using the above-described approach. It was assumed that intensities from each condition have a t-distribution with a mean equal to that of the control (CitationVelten, 2009). In addition, correlation matrices were constructed to ensure that simulated data (labeled and unlabeled intensities) from different conditions were comparable to the experimental data. This method is designed to estimate the number of peptide pairs falsely selected (i.e., the false-positive rate) in the absence of true differences between conditions (CitationVelten, 2009). The same procedures used for processing the experimental data were also applied to the simulated data for the calculation of Rnorm values.
RESULTS AND DISCUSSION
Heavy SILAC Labeling, Weight Gain, and Litter Size
During the observation period of 2 weeks, the four litters were physically inspected and weighed at days 6, 9, 13, and 16 post weaning. All animals had the same food consumption and showed similar weight gain and litter size regardless of chow type (). The populations of male littermates consisted of 15 animals with isotopically labeled lysine and 15 control animals. To measure 13C615N2-lysine incorporation into the brain proteome, VTA brain proteins were isolated, resolved by SDS-PAGE, digested in-gel, and peptides measured by high-resolution LC-MS. Protein labeling efficiencies were calculated among the labeled-pairs identified by LC-MS, as described in Materials and Methods and shown in . The results show a distribution of heavy label incorporation, which is likely due to differences in rates of protein turnover in the brain and incomplete heavy label incorporation (CitationChevalier et al., 2009). The median isotopic-label incorporation efficiency among confidently identified proteins was 76.9%. These results are similar to the 71.9% of total 15N incorporation in brain in weaned pups by CitationMcClatchy et al. (2007). Although the incorporation efficiency was not > 90% for all proteins, most were sufficiently labeled for quantitative analysis.
Figure 2. Litter size and weight on normal and heavy isotope diet. Mean litter weights were reported as a function of the number of days postweaned pups were fed labeled or unlabeled rat chow (error bars are included but the standard deviations are minimal and thus not visible). HD = heavy dame (placed on the labeled diet 2 days into confirmed pregnancy); LD = light dame (fed similar, but unaltered, diet); n = the number of male pups included in each birth group. The data point for day 1 represents n = 1 per cohort.
Figure 3. In vivo heavy isotope labeling of proteins measured in ventral tegmental (VTA). Percent heavy label incorporation for labeled-pairs from 13C615N2-lysine–labeled F1 generation rat ventral tegmental tissue taken at 7 weeks post weaning. These data were calculated from raw MS labeled-pair intensities (N = 297 labeled-pairs with intensity ≥ 1E5) with median %Incorporation (μ1/2) = 76.9%. Heavy label incorporation calculations predicted > 100% incorporation for 22 labeled-pairs (average: 108%), demonstrating a small contribution of error to labeled-pair ratio calculations likely from mixing and changes in isotopic distributions between heavy and light amino acid–containing peptides.
Beam Break Activity Measurement and Compound Administration
Phenotypic effects of the administered compounds were assessed by subjecting the cohorts to a beam break behavioral data assay. The data show the orexin receptor antagonist was effective at lowering basal locomotor activity relative to vehicle prior to Ox-B administration (). As previously demonstrated, animals treated with Ox-B showed a marked increase in activity relative to control (CitationWinrow et al., 2010). Pretreatment with the orexin receptor antagonist significantly inhibited the Ox-B–induced locomotor response (). Animals administered Ox-B an hour after ORA administration showed a modulated response, resulting in ˜500 beam breaks above baseline of Ox-B administration (˜1800 beam breaks), demonstrating that the antagonist effectively inhibited Ox-B–induced locomotor activity.
Figure 4. Orexin receptor antagonist response based on beam break behavioral data. Locomotor activity in response to orexin (Ox-B) and orexin receptor antagonist (ORA). Animals were treated with control (vehicle) or ORA at 10:30 am (as indicated, ▲) and treated with aCSF or orexin peptide at 11:30 am (as indicated, ↑). Significant ORA differences between control (vehicle) vs. Ox-B and ORA vs. Ox-B (#P value < 0.05) and between ORA vs. Ox-B and ORA vs. aCSF (*P value < 0.05) are shown.
Laser Capture Microdissection of Proteins From the VTA, Labeled-Pair Selection, and Peptide Identification
The primary purpose of performing differential proteomic analysis on a very specific subregion of the brain in these studies is to reduce the tissue heterogeneity and to increase the likelihood of identifying proteins related to sleep biology. The disadvantage of this approach is that a more complicated sample processing is required and protein recovery is greatly reduced if compared with whole brain protein homogenates. The Elucidator results returned 44,163 detected features (with specific retention times, m/z, and intensity values), which collapsed into 28,354 isotope groups. Labeled-pairs were selected in a “counterclockwise” fashion whereby the specific measurable characteristics (m/z and retention time, criteria described in Materials and Methods) of individual isotope groups were used to establish links between heavy- and light-labeled species, resulting in the selection of 239 labeled-pairs. This approach is deemed “counter” to the typical “clockwise” approach to SILAC data where pairs are determined based on peptide identification, making confidently assigned tandem mass spectra a prerequisite for any analysis of labeled-pairs. The counterclockwise approach allows for selection of pairs based on accurate mass with the quantitative characteristics of interest, independent of peptide identification. A separate data analysis was performed in Elucidator to determine what proteins were identified via data-dependent MS/MS (shot-gun) in this experiment, resulting in the identification of 548 proteins. Additional targeted analyses were performed to generate tandem mass spectra (MS/MS) for label pairs of interest that were not generated by shot-gun MS/MS analysis.
In total, as shown in , 15 labeled-pairs were determined to be of interest either (Ox-B ratio > Ox-B+ ORA ratio > ORA ratio) or (ORA ratio > x-B+ ORA ratio > Ox-B ratio) based on the data treatment and criteria described in Materials and Methods and Supplementary Figure 1 available online at http://informahealthcare.com/doi/abs/10.3109/01677063.2014.883389 (false-positive rate estimated to range from 16% to 38% with n = 500 simulations and 2–20 degrees of freedom as described in Materials and Methods). Eleven of the 15 selected pairs had tandem mass spectra present in the original experiment that allowed for confident peptide identification, 2 were sequenced with a targeted approach using inclusion lists of m/z values, and 2 remain unidentified due to insufficient quality MS/MS spectra. Among the 13 identified pairs of interest, 7 increased in relative abundance in response to orexin receptor antagonist treatment and were identified as peptides derived from: l-lactate dehydrogenase A (LDHA), Na/K-transporting ATPase (ATP1B1), 2-,3’-cyclic nucleotide 3’-phosphodiesterase (CNP), synaptotagmin (SYT1), tubulin (TUB), and 14-3-3ϵ (YWHAH). Six labeled-pairs decreased in relative abundance as a result of antagonist treatment and were identified as peptides from myelin basic protein (MBP), mitochondrial malate dehydrogenase, peptidyl-prolyl cis/trans isomerase A (PPIA), α-synuclein (SNCA), and ADP-ribosylation factor 3 (ARF1). Notably, two proteins were identified by two individual peptides each (). Both labeled-pair ratios for P13233 (CNP) showed down-regulation upon ORA treatment, with higher variability with respect to Ox-B treatment (coefficient of variability [CV] = 81%) than Ox-B+ ORA (20.4%) and ORA (33.6%); however, all ratios trended in the same direction. P10111 (PPIA) was up-regulated similarly with regard to Ox-B treatment (CV = 0.6%), and closely tracked in both Ox-B+ ORA (3.5%) and ORA (15.7%) treatments. Supplementary Figures 2 and 3 available online at http://informahealthcare.com/doi/abs/10.3109/01677063.2014.883389 contain the MS/MS spectra for peptides presented in .
Table 1. Regulated labeled-pairs.
Recent findings by CitationWaanders et al. (2009) showed that as few as 2000–4000 cells can provide a sufficient number of cells for protein differential analysis in pancreatic islets. In addition, recently published LCM–LC-MS/MS data, using a similar workflow to the one presented here, showed that it is feasible to identify and differentially quantitate a significant number of proteins from microdissected neuronal tissue (CitationHan et al., 2008; CitationWaanders et al., 2009). Due to regional volume constraints in the VTA in these studies, two 13-mm2 tissue sections (average area as calculated by the Veritas LCM software; Molecular Devices) were captured per animal (), with three animals pooled per condition. Based on a total tissue volume of 0.39 mm3 with a mean eukaryotic cell diameter of 20 μm, we estimate the cell count at approximately 180,000 per condition. It is likely that a small portion of this disparity between the number of proteins identified in these experiments versus the number identified by CitationWaanders et al. (2009) can be attributed to obvious cell type difference between neurons and islets, primarily the large membrane to cell volume ratio in neurons resulting from highly complex cellular process structure as well as myelination. In addition, in this procedurally complex, multiarm study several important factors seem to be at the center of ensuring overall reproducibility and reducing sample loss during biochemical processing. First, in vivo isotopic labeling of F1 generation rats results in incomplete label incorporation due to different turnover rates found among the protein population. Continuous labeling into a second F2 generation cohort have distinct benefits as reported by CitationMcClatchy et al. (2007), resulting in increased label incorporation in neuronal tissue. These studies, however, were limited by the time lines associated with labeling a second generation of rats. Second, consistent VTA sample volumes were not strictly obtainable (usually ± 1 mm3). Specific normalization measures were incorporated to correct for this error by standardizing protein extraction buffer volume as a function of reported tissue volume; however, precise cell populations may not have been reproducibly solubilized, thereby perturbing intercellular peptide and protein concentrations between samples. The protein extraction buffer used in this experiment was not conducive to conventional protein concentration assays, and thus concentrations were normalized by the tissue volume provided by LCM calculations. Third, the lysis of neuronal tissue sections physically bound to MacroCap surfaces may be inconsistent between samples due to the lack of physical agitation (e.g., sonication or hypertonic disruption). Therefore, certain proteins, especially those bound to membranes, may not have been consistently represented. The extraction buffer used was optimized for total protein content and “distribution” along the lane as revealed by Coomassie blue staining on an SDS-PAGE gel (data not shown), but it too could be further optimized or expanded to perform stepwise solubility improvement and/or cellular fraction concentration.
Biological Relevance of Protein Identifications
To understand the functional significance of the alterations in protein expression, Ingenuity Pathway Analysis (Ingenuity Systems, Redwood City, CA) was used to interrogate the identified proteins and to identify overlapping associations with known orexin signaling. These observed associations, though intriguing, will benefit from further independent validation and are affected by the limited number of peptides identified in the current study. This evaluation revealed that key proteins involved in mammalian neuron growth, development, and energy metabolism were altered in response to the treatment conditions in the VTA along with several proteins with defined roles in synaptic function, behavior, and locomotion (). Additionally, many of these proteins have been associated with neurological disorders (ATP1B1, CNP, LDHA, MBP, PPIA, SNCA, SYT1, TUBA1A, YWHAH) (Supplementary Table 1 available online at http://informahealthcare.com/doi/abs/10.3109/01677063.2014.883389). A number of associations with neurodegenerative and psychiatric disorders were identified, including schizophrenia (CNP, SYT1, TUB1A, YWAH), Parkinson's disease (LDHA, MBP, SNCA, TUBA1A), Huntington's disease (LDHA, PPIA, TUBA1A), Alzheimer's disease (SNCA), and multiple sclerosis (MBP). Most of the proteins listed (10/11) are localized in the cytoplasm, with functions including synaptic transmission (ARF1, CNP, MBP, SNCA, SYT1), axonal morphology (CNP, MBP, SNCA, YWHAH), and neurotransmitter signaling (CNP, SNCA, SYT1). Importantly, many of the differentially expressed proteins have intersecting functional associations with orexin signaling. These include roles in synaptic transmission, neurotransmitter release, and neuronal survival. Further, given the clear increase in beam break activity following administration of Ox-B peptide, it is interesting to observe that CNP, MBP, and SNCA levels were altered, as these proteins are involved in neuronal activation and locomotor activity.
Figure 5. Ingenuity network analysis of differentially regulated labeled-pairs. proteins listed in were evaluated using Ingenuity Pathway Analysis (version 7.6) to determine interacting nodes. The top network identified was “Neurological Disease, Cell Death, Nervous System Development and Function” and is shown along with the L/H normalized ratios for each protein. Proteins with significant L/H ratios for Ox-B treatment are indicated in red and those with significant L/H ratios for antagonist treatment are shown in green, with ratios values shown below.
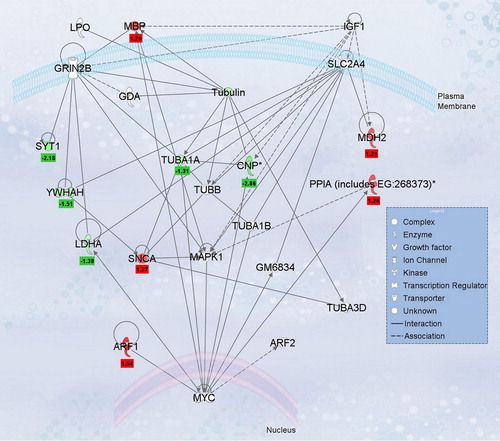
Although there were no direct physical connections identified between orexin receptors, peptides, and the altered proteins, the Ingenuity nodal analysis revealed associated overlapping ontological pathways, including those involved with the clock-controlled cell cycle gene Myc, which has shown circadian periodicity in cancer studies (CitationIurisci et al., 2006; CitationLevi et al., 2007). MBP, active in the myelination of nerves, is also associated with Myc functioning outside of the cellular space. MBP and SNCA (the “non-Aβ” component of Alzheimer's disease) are both down-regulated by the antagonist affecting a number of pathways, including central nervous system (CNS) morphology, nervous tissue cell viability, CNS development, and fibril formation. In addition, MBP and SNCA appear to have an opposing expression relationship with CNP (ambiguously associated with myelin) and YWHAH (involved in various signaling pathways) in neurite development and human neurological disorders.
CNP is also oppositely modulated compared with MBP under the influence of antagonist treatment. The proteins are conversely expressed during neuron and axon development, filament assembly, and, as appropriate for this study, locomotion. The alpha-1-A chain of tubulin (TUBA1A) interacts with both CNP and MBP () and is up-regulated with regard to receptor antagonist treatment. The functions of SNCA continue to emerge, and the question remains as to why CNP remains active during induced sleep whereas MBP appears to be decreased by the ORA treatment. The change in SNCA levels in response to Ox-B in the VTA is intriguing given the recent linkage of this gene with addictive behaviors in rodents (CitationSpence et al., 2009) and humans (CitationClarimon et al., 2007; CitationBonsch et al., 2005). Although many of the peptides identified have been linked with CNS function and some pathologies, the relevance of the observed changes in VTA in response to peptide or antagonist treatment remains to be determined.
SUMMARY
Several recent studies have shown the key role that orexin signaling plays in addictive behaviors modulated through the VTA, including the ability to block amphetamine sensitization and nicotine reinstatement with selective orexin receptor antagonists (CitationWinrow et al., 2010; CitationAston-Jones et al., 2009, Citation2010). The studies described here strengthen the role for orexin signaling through the VTA and point to a previously unknown connection between SNCA and orexin signaling in VTA function. It will be important to further confirm the peptide changes observed in the current study, and additional investigations will be required to understand the potential relevance of these changes in rodent VTA. In addition, improving the proteomics methodology to target an increased and a more diverse total protein extraction from LCM-isolated tissue is a reasonable expectation to strive for in future studies.
Supplementary Figure 1 and Table 1
Download PDF (2 MB)ACKNOWLEDGMENTS
The authors would like to thank Damon C. Barbacci and Francisco J. Dieguez-Acuña for their contributions towards the experimental design of the experiments described herein. The authors would also like to recognize Alison Rigby for her histology expertise and technical contributions.
Declaration of interest: The authors report no conflicts of interest. The authors alone are responsible for the content and writing of the paper.
REFERENCES
- Aston-Jones, G., Smith, R. J., Moorman, D. E., & Richardson, K. A. (2009). Role of lateral hypothalamic orexin neurons in reward processing and addiction. Neuropharmacology, 56(Suppl 1), 112–121.
- Aston-Jones, G., Smith, R. J., Sartor, G. C., Moorman, D. E., Massi, L., Tahsili-Fahadan, P., et al. (2010). Lateral hypothalamic orexin/hypocretin neurons: A role in reward-seeking and addiction. Brain Res, 1314, 74–90.
- Bettica, P., Squassante, L., Zamuner, S., Nucci, G., Danker-Hopfe, H., & Ratti, E. (2012). The orexin antagonist SB-649868 promotes and maintains sleep in men with primary insomnia. Sleep, 35, 1097–1104.
- Bonsch, D., Lederer, T., Reulbach, U., Hothorn, T., Kornhuber, J., & Bleich, S. (2005). Joint analysis of the NACP-REP1 marker within the alpha synuclein gene concludes association with alcohol dependence. Hum Mol Genet, 14, 967–971.
- Brisbare-Roch, C., Dingemanse, J., Koberstein, R., Hoever, P., Aissaoui, H., Flores, S., et al. (2007). Promotion of sleep by targeting the orexin system in rats, dogs and humans. Nat Med, 13, 150–155.
- Chevalier, L., Bos, C., Gryson, C., Luengo, C., Walrand, S., Tome, D., et al. (2009). High-protein diets differentially modulate protein content and protein synthesis in visceral and peripheral tissues in rats. Nutrition, 25, 932–939.
- Clarimon, J., Gray, R. R., Williams, L. N., Enoch, M. A., Robin, R. W., Albaugh, B., et al. (2007). Linkage disequilibrium and association analysis of alpha-synuclein and alcohol and drug dependence in two American Indian populations. Alcohol Clin Exp Res, 31, 546–554.
- Dugovic, C., Shelton, J. E., Aluisio, L. E., Fraser, I. C., Jiang, X., Sutton, S. W., et al. (2009). Blockade of orexin-1 receptors attenuates orexin-2 receptor antagonism-induced sleep promotion in the rat. J Pharmacol Exp Ther, 330, 142–151.
- Ericsson, C., Peredo, I., & Nister, M. (2007). Optimized protein extraction from cryopreserved brain tissue samples. Acta Oncol, 46, 10–20.
- Geho, D. H., Petricoin, E. F., & Liotta, L. A. (2004). Blasting into the microworld of tissue proteomics: A new window on cancer. Clin Cancer Res, 10, 825–827.
- Gotter, A. L., Winrow, C. J., Brunner, J., Garson, S. L., Fox, S. V., Binns, J., et al. (2013). The duration of sleep promoting efficacy by dual orexin receptor antagonists is dependent upon receptor occupancy threshold. BMC Neurosci, 14, 90.
- Han, M. H., Hwang, S. I., Roy, D. B., Lundgren, D. H., Price, J. V., Ousman, S. S., et al. (2008). Proteomic analysis of active multiple sclerosis lesions reveals therapeutic targets. Nature, 451, 1076–1081.
- Herring, W. J., Snyder, E., Budd, K., Hutzelmann, J., Snavely, D., Liu, K., et al. (2012). Orexin receptor antagonism for treatment of insomnia: A randomized clinical trial of suvorexant. Neurology, 79, 2265–2274.
- Hoever, P., Hay, J., Rad, M., Cavallaro, M., van Gerven, J. M., & Dingemanse, J. (2013). Tolerability, pharmacokinetics, and pharmacodynamics of single-dose almorexant, an orexin receptor antagonist, in healthy elderly subjects. J Clin Psychopharmacol, 33, 363–370.
- Ishihama, Y., Sato, T., Tabata, T., Miyamoto, N., Sagane, K., Nagasu, T., et al. (2005). Quantitative mouse brain proteomics using culture-derived isotope tags as internal standards. Nat Biotechnol, 23, 617–621.
- Iurisci, I., Filipski, E., Reinhardt, J., Bach, S., Gianella-Borradori, A., Iacobelli, S., et al. (2006). Improved tumor control through circadian clock induction by Seliciclib, a cyclin-dependent kinase inhibitor. Cancer Res, 66, 10720–10728.
- Keller, A., Nesvizhskii, A. I., Kolker, E., & Aebersold, R. (2002). Empirical statistical model to estimate the accuracy of peptide identifications made by MS/MS and database search. Anal Chem, 74, 5383–5392.
- Kruger, M., Moser, M., Ussar, S., Thievessen, I., Luber, C. A., Forner, F., et al. (2008). SILAC mouse for quantitative proteomics uncovers kindlin-3 as an essential factor for red blood cell function. Cell, 134, 353–364.
- Levi, F., Filipski, E., Iurisci, I., Li, X. M., & Innominato, P. (2007). Cross-talks between circadian timing system and cell division cycle determine cancer biology and therapeutics. Cold Spring Harb Symp Quant Biol, 72, 465–475.
- Liao, L., Park, S. K., Xu, T., Vanderklish, P., & Yates, J. R., III (2008). Quantitative proteomic analysis of primary neurons reveals diverse changes in synaptic protein content in fmr1 knockout mice. Proc Natl Acad Sci U S A, 105, 15281–15286.
- Liotta, L. A., & Petricoin, E. F. (2000). Beyond the genome to tissue proteomics. Breast Cancer Res, 2, 13–14.
- McClatchy, D. B., Dong, M. Q., Wu, C. C., Venable, J. D., & Yates, J. R., III (2007). 15N metabolic labeling of mammalian tissue with slow protein turnover. J Proteome Res, 6, 2005–2010.
- McClatchy, D. B., Liao, L., Park, S. K., Venable, J. D., & Yates, J. R. (2007). Quantification of the synaptosomal proteome of the rat cerebellum during post-natal development. Genome Res, 17, 1378–1388.
- Mercer, S. P., Roecker, A. J., Garson, S., Reiss, D. R., Meacham, H. C., Murphy, K. L., et al. (2013). Discovery of 2,5-diarylnicotinamides as selective orexin-2 receptor antagonists (2-SORAs). Bioorg Med Chem Lett, 23, 6620–6624.
- Mieda, M., & Sakurai, T. (2013). Orexin (hypocretin) receptor agonists and antagonists for treatment of sleep disorders. Rationale for development and current status. CNS Drugs, 27, 83–90.
- Muenchen, R. A., & Hilbe, J. M. (2010). R for Stata users. New York, New York: Springer.
- Patel, V., Hood, B. L., Molinolo, A. A., Lee, N. H., Conrads, T. P., Braisted, J. C., et al. (2008). Proteomic analysis of laser-captured paraffin-embedded tissues: A molecular portrait of head and neck cancer progression. Clin Cancer Res, 14, 1002–1014.
- Paweletz, C. P., Wiener, M. C., Bondarenko, A. Y., Yates, N., Song, Q., Liaw, A., et al. (2010). Application of an end-to-end biomarker discovery platform to identify target engagement markers in cerebro spinal fluid by high resolution differential mass spectrometry. J Proteome Res, 9, 1392–1401.
- Rodriguez, A. S., Espina, B. H., Espina, V., & Liotta, L. A. (2008). Automated laser capture microdissection for tissue proteomics. Methods Mol Biol, 441, 71–90.
- Sanders, M. E., Dias, E. C., Xu, B. J., Mobley, J. A., Billheimer, D., Roder, H., et al. (2008). Differentiating proteomic biomarkers in breast cancer by laser capture microdissection and MALDI MS. J Proteome Res, 7, 1500–1507.
- Speicher, K., Kolbas, O., Harper, S., & Speicher, D. (2000). Systematic analysis of peptide recoveries from in-gel digestions for protein identifications in proteome studies. J Biomol Tech, 11, 74–86.
- Spellman, D. S., Deinhardt, K., Darie, C. C., Chao, M. V., & Neubert, T. A. (2008). Stable isotopic labeling by amino acids in cultured primary neurons: Application to brain-derived neurotrophic factor-dependent phosphotyrosine-associated signaling. Mol Cell Proteomics, 7, 1067–1076.
- Spence, J. P., Liang, T., Liu, L., Johnson, P. L., Foroud, T., Carr, L. G., et al. (2009). From QTL to candidate gene: A genetic approach to alcoholism research. Curr Drug Abuse Rev, 2, 127–134.
- Taheri, S., Sunter, D., Dakin, C., Moyes, S., Seal, L., Gardiner, J., et al. (2000). Diurnal variation in orexin A immunoreactivity and prepro-orexin mRNA in the rat central nervous system. Neurosci Lett, 279, 109–112.
- Velten, K. (2009). Mathematical modeling and simulation: Introduction for scientists and engineers. Weinheim: WILEY-VCH Verlag GmbH & Co. KGaA.
- Waanders, L. F., Chwalek, K., Monetti, M., Kumar, C., Lammert, E., & Mann, M. (2009). Quantitative proteomic analysis of single pancreatic islets. Proc Natl Acad Sci USA, 106, 18902–18907.
- Winrow, C. J., Gotter, A. L., Cox, C. D., Doran, S. M., Tannenbaum, P. L., Breslin, M. J., et al. (2011). Promotion of sleep by suvorexant—A novel dual orexin receptor antagonist. J Neurogenet, 25, 52–61.
- Winrow, C. J., Tanis, K. Q., Reiss, D. R., Rigby, A. M., Uslaner, J. M., Uebele, V. N., et al. (2010). Orexin receptor antagonism prevents transcriptional and behavioral plasticity resulting from stimulant exposure. Neuropharmacology, 58, 185–194.
- Winrow, C. J., Tanis, K. Q., Rigby, A. M., Taylor, R. R., Serikawa, K., McWhorter, M., et al. (2009). Refined anatomical isolation of functional sleep circuits exhibits distinctive regional and circadian gene transcriptional profiles. Brain Res, 1271, 1–17.
- Wu, C. C., Maccoss, M. J., Howell, K. E., Matthews, D. E., & Yates, J. R., III (2004). Metabolic labeling of mammalian organisms with stable isotopes for quantitative proteomic analysis. Anal Chem, 76, 4951–4959.
- Zeitzer, J. M., Buckmaster, C. L., Parker, K. J., Hauck, C. M., Lyons, D. M., & Mignot, E. (2003). Circadian and homeostatic regulation of hypocretin in a primate model: Implications for the consolidation of wakefulness. J Neurosci, 23, 3555–3560.