Abstract
Introduction: Contact flexible microstrip applicators (CFMA) are applied for superficial hyperthermia. In the clinic these flexible applicators are mostly applied bent along the body curvature. This paper investigates the specific absorption rate (SAR) patterns of CFMA applicators, when bent around an elliptical tissue-equivalent phantom.
Methods: The 2H (aperture size 14.8 × 14.3 cm2), 3H (28.7 × 20.7 cm2), 4H (19.6 × 19.6 cm2) and 5H (19.7 × 28.5 cm2) applicators were examined. Measurements were performed for the 5H applicator; existing measurement data were analysed for the 3H applicator. Finite difference time domain (FDTD) simulations with a resolution of 2 × 2 × 1 mm3 were performed for all applicators. Applicators were bent around the top and the side of the elliptical phantom to examine different curvatures. The SAR deposition, effective field size (EFS) and effective heating depth (EHD) were evaluated and compared to results for straight applicators.
Results: Bending the applicators generally yielded a focusing effect of the SAR, which was most pronounced with a strong curvature, but especially the 5H applicator showed a stronger power absorption at the sides of the applicator, compared to the centre region. The EFS became smaller when bending the applicators; this effect was also more pronounced for a strong curvature. The EHD increased for bent applicators, but the degree depended strongly on the location.
Conclusion: The behaviour of bent CFMA applicators is not trivial and the SAR deposition is not similar for all applicators. The EFS decreases and the EHD increases, but very locally. Therefore, it is generally advisable to analyse the SAR distribution of flexible applicators in both straight and bent state.
Introduction
Hyperthermia has proven its effectiveness in addition to radiotherapy and/or chemotherapy, by improving clinical outcome Citation[1–5]. Superficial hyperthermia can be applied as a radio-sensitiser in treatment of chest wall recurrences. Treatment options for these malignancies include resection and re-irradiation, but since the tumour site has been previously irradiated, the radiation dose will be limited. Additional hyperthermia is then an appropriate option to achieve good tumour control Citation[6].
The effective heating depth (EHD) of electromagnetic hyperthermia devices decreases with increasing frequency. Superficial devices usually operate at a frequency in the range of 434–2450 MHz. Several applicators for superficial hyperthermia have been developed Citation[7–11]. At our institute, the Academic Medical Center (AMC), contact flexible microstrip applicators (CFMA) Citation[7] are used, operating at 434 MHz. These flexible applicators are available in different sizes and can be bent in order to fit the curved body contour.
Since clinical outcome depends on the achieved tumour temperatures Citation[12–15], it is important to pursue optimal control over the temperature distribution and to obtain as much temperature information as possible during treatment. During treatments at the AMC, temperatures are measured at the skin, using several multi-sensor thermocouple probes, and one or two thermometry probes are inserted into tumour tissue. To avoid implant risks for the patient Citation[16], invasive thermometry is sparse, and thus limited information about the temperature distribution is available during treatment.
Hyperthermia treatment planning can be used as a tool to provide more insight in the heating properties of a specific applicator type Citation[17], Citation[18] and simulations can help to optimise the treatment strategy. In a previous publication Citation[19], the performance of straight CFMA applicators was investigated. Some variations in the measurements were observed and finite difference time domain (FDTD) simulations showed that these variations could be explained by the presence of possible air layers between the rubber frame and the electrode plates. These air layers were found to have a strong impact on the shape and size of the iso-SAR contours with a value higher than 50%, but a limited impact on both the effective field size (EFS, i.e. the region covered by the 50% iso-SAR contour) and the EHD.
For clinical applications, CFMA applicators are mostly applied with a certain curvature, bent around the patient's body. The different applicator sizes might result in different heating patterns when the applicator is bent. This paper investigates the heating patterns of the different CFMA applicators, when bent around an elliptical tissue-equivalent phantom, using measurements and finite difference simulations. SAR patterns, EFS and EHD are evaluated.
Methods
CFMA applicators
Contact flexible microstrip applicators are available with different aperture sizes. The applicators are manufactured by SRPC ‘Istok’ (Moscow) Citation[7]. A photograph of the applicators is shown in .
Figure 1. Left: photograph of CFMA antennas, type 3H, 4H and 5H. Right: Schematic drawing of the different applicator sizes, including the location of the exciting slot.
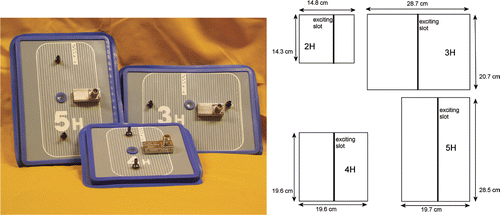
In this study, the radiative applicator types 2H (aperture size 14.8 × 14.3 cm2), 3H (28.7 × 20.7 cm2), 4H (19.6 × 19.6 cm2) and 5H (19.7 × 28.5 cm2) were examined. The orientation of the principal E-field direction is perpendicular to the lines on the surface of the applicator (see ). Bending is only possible around the axis perpendicular to these lines, which corresponds to the axis perpendicular to the exciting slot. This explains why type 3H and 5H cover roughly the same area, but with opposite long and short sides. A detailed description of the applicators has been published previously Citation[7].
The CFMA applicator consists of two coplanar active electrodes and a shield electrode, separated by a thin layer of fluoroplastic substrate (0.5–1.5 mm, depending on the frequency Citation[7]). The electrodes are excited as a plane dipole-like microstrip antenna by means of a slot of approximately 5 mm. The microstrip line is excited by the feeding pin of a coaxial cable. A short circuit is positioned at approximately ¼λs from the exciting slot, where λs is the wavelength of the field in the fluoroplastic substrate (∼44 cm).
The electrode plates are incorporated in a rubber frame, which is integrated with a thin rubber water bolus. The surface of the rubber frame, directed inside the bolus, is covered with 5 mm high lugs to prevent collapse of the water bolus. The water bolus thickness was measured from the 1 cm high rim of the rubber frame. A schematic picture of the CFMA applicator is shown in . At the AMC, all CFMA applicators are applied at 434 MHz.
Figure 2. Schematic representation of a CFMA applicator. The left picture shows a longitudinal cross section and the picture at the right hand side shows the electrodes. This picture was reproduced from Kok et al. Citation[34].
![Figure 2. Schematic representation of a CFMA applicator. The left picture shows a longitudinal cross section and the picture at the right hand side shows the electrodes. This picture was reproduced from Kok et al. Citation[34].](/cms/asset/fcffa6fd-e81a-4ba5-9bb0-57717bf66a8a/ihyt_a_439910_f0002_b.gif)
Tissue equivalent phantom
The SAR distributions were measured and simulated in an elliptical tissue-equivalent phantom. The phantom was filled with a saline solution (6 g/L NaCl). At a frequency of 434 MHz and room temperature (∼19.5°C), the electrical conductivity σ = 1.1 S m−1 and the relative permittivity εr = 0.78. The phantom was initially developed by Wust et al. Citation[20] and has a 1 cm artificial fat layer Citation[21]. The major and minor axes of the phantom measure 35.6 and 25.2 cm, respectively. The phantom is 97.5 cm long and an opening in the phantom provides access to insert a measurement probe. Applicators were bent around the top of the phantom as well as around the side of the phantom to examine different curvatures. When bent around the top of the elliptical phantom, the bending radius of the electrodes was ∼25 cm; for the side, the bending radius was ∼12 cm.
For simulations of flat applicators, a box-shaped muscle-equivalent phantom was modelled, also with a 1 cm fat layer and the same dielectric properties as the elliptical phantom.
Measurements
Measurements were performed in the H-plane (xz-plane), i.e. the plane perpendicular to the main E-field component (see also and ); the applicators were bent around the y-axis (perpendicular to the gap). The origin of the coordinate system is located at the fat–muscle interface at the top of the phantom. Equivalently, when the applicator is bent around the side of the phantom the origin is located at the fat–muscle interface at the side.
Figure 3. Schematic drawing of a CFMA applicator on the elliptical phantom and the location of the E-plane and H-plane. The origin of the coordinate system is located at the fat–muscle interface at the top of the phantom. Equivalently, when the applicator is bent around the side of the phantom the origin is located at the fat–muscle interface at the side.
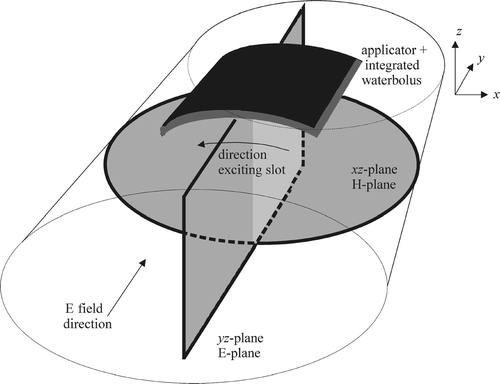
An earlier publication Citation[22] showed measurements in the H-plane for the 3H applicator bent around the elliptical phantom. For the 3H around the side of the phantom, the SAR distribution in the central xz-plane (y = 0) was measured; for the 3H at the top of the phantom, the SAR distribution in the xz-plane 6 cm off-centre was measured. For this study, the SAR pattern at the central xz-plane for the 5H applicator on top of the phantom was measured additionally. An E-field probe, attached to a plastic L-shaped scanning arm, was used to measure the E-field distribution in the saline solution. The scanning system was designed such that the probe can be moved horizontally and vertically in a selected H-plane. The E-field probe and the scanning system were developed at the Department of Radiation Oncology of the AMC Citation[23]. The E-field probe measures the electric field in the direction of alignment and only the dominant component of the E-field was measured, since previous measurements showed that the other components are negligible. The applied water bolus thickness was approximately 1 cm for all measurements.
Simulations
The treatment planning software used at our institute was initially developed in the Department of Radiotherapy of the University Medical Center, Utrecht and was expanded in our department. Simulations for this study were performed on an Intel® Xeon 5355 2.66 GHz system. The phantom, water bolus, and other parts of the applicator were described using the generic object format (GOF) Citation[24]. E-field simulations were performed using the finite difference time domain (FDTD) method Citation[25]. The resolution of the FDTD simulations was 2 × 2 × 1 mm3, with a spacing of 1 mm in depth (z-direction) to determine the EHD more accurately. The smallest wavelength is approximately 8 cm for 434 MHz in water. Thus, with the resolution applied, there are at least ∼40 voxels per wavelength everywhere in the computational domain, which is sufficient for accurate simulations Citation[26]. The width of the exciting slot was modelled as 4 mm and the lugs to prevent collapse of the water bolus were neglected, since they are small and occupy little space.
The source point was positioned in the inner conductor of the coaxial feeding cable. The dielectric material in the coaxial cable was modelled as Teflon. A nearly perfectly matched layer (NPML) Citation[27] absorbing boundary condition with a thickness of ten layers was applied to truncate the computational domain. The field absorption of an NPML is comparable to a standard perfectly matched layer Citation[28], as originally proposed by Berenger Citation[29]. An example of the modelled geometry for a straight and curved CFMA is shown in . Dielectric properties were obtained from literature Citation[22], Citation[30], Citation[31] and are listed in .
Figure 4. Longitudinal cross section of a modelled straight (yz-plane) and curved (xz-plane) CFMA antenna. The volume of interest, which is indicated by the dashed box, was truncated by an absorbing boundary condition and a perfect electric conductor (PEC) in all directions. Drawings are not to scale.

Table I. Dielectric properties applied in the simulations.
Simulations for the different CFMA applicators (2H, 3H, 4H and 5H) bent around the elliptical phantom were performed to examine the heating pattern, effective field size (EFS) and effective heating depth (EHD) of the different applicators. Simulations for flat CFMA applicators of all types were performed as well, in order to compare the EFS and EHD for flat and bent applicators. The 1.5 mm fluoroplastic substrate between the active electrodes and the shield electrode was modelled as 2 mm thick. The modelled water bolus thickness was 1 cm and full contact between the rubber frame and the electrode plates was assumed.
Temperature distributions usually differ from SAR distributions, due to the impact of thermal conduction and perfusion. Therefore, the impact of the SAR distribution on the steady-state temperature distribution was examined for the different applicators bent around the side of the phantom. For that purpose, the fat-equivalent layer and the saline solution were considered fat and muscle tissue, respectively. For local hyperthermia applications, the conventional bio-heat transfer equation Citation[32] is generally used in thermal models:where ρt is the tissue density (kg m−3) and ct the specific heat (J kg−1°C−1). The term ∇ · (kt ∇ T) represents the conductivity in tissue, with kt the thermal conductivity of tissue (W m−1°C−1). The term cbWb (T − Tart) is the heat sink term, with cb the specific heat of blood, Wb the volumetric perfusion rate (kg m−3 s−1) and Tart the local arterial temperature (37°C). The absorbed power is represented by P (W m−3). To model adequate tissue boundary conditions of 37°C, the computational volume for thermal simulations was enlarged with 10 voxels in y-direction (at both sides) and with 20 voxels in negative z-direction. An absorbed power of 0 W m−3 was assumed over these voxels. The water bolus temperature was kept constant at 41°C. For the 3H applicator, a total absorbed power of 75 W was assumed in tissue. The total absorbed power for the other applicators was scaled proportional to their sizes: 27, 48 and 71 W for the 2H, 4H and 5H applicators, respectively. Thermal properties were taken from literature Citation[33]: ρt, ct and kt were 888 kg m−3, 2387 J kg−1°C−1 and 0.22 W m−1°C−1 for fat tissue, respectively and 1050 kg m−3, 3639 J kg−1°C−1 and 0.56 W m−1°C−1 for muscle tissue. The modelled perfusion Wb was 3.6 kg m−3 s−1 and cb was 3600 J kg−1°C−1.
In a previous study analysing the SAR distributions of flat CFMA applicators, air between the rubber frame and the active electrode plates turned out have a large impact on the SAR distribution in regions with relative SAR value higher than 50%. Nevertheless, the impact on the EFS and EHD was found to be limited Citation[34]. In this study some simulations were also performed with air modelled between the rubber frame and the active electrode plates to determine the impact of possible air enclosure for bent CFMA applicators. Both air at the centre or air at the sides along the curved 3H and 5H applicators was modelled. For the 3H applicator, an air layer was assumed between the rubber and the electrodes ranging x = [–4; 4 cm] and full contact was modelled elsewhere, and vice versa. For the 5H applicator this range was x = [–6; 6 cm]. Air layers were assumed 2 mm thick and extended over the full length of the applicator in the E-plane (y-direction).
Analysis
After measurement or computation of the E-field, the SAR distribution was determined usingIn this equation, σ (S m−1) and ρ (kg m−3) are the electrical conductivity and the density of the material, respectively.
For measurements and simulations with a curved applicator, the SAR value at 1 cm depth in saline at the centre (x = 0, z =–1 cm) of the measured H-plane was normalised to 100%. The effective heating depth is defined as the additional depth at which the relative power deposition has decreased to 50% of the maximum value at 1 cm depth in the saline solution Citation[35]. The EHD was determined from the normalisation point. Simulated and measured SAR contour plots and EHDs were evaluated.
Furthermore, the simulated heating patterns for the 2H, 3H, 4H and 5H antenna were compared, both in the central H-plane (y = 0) as well as in the central E-plane (x = 0). To this end the simulated SAR distributions were normalised such that the relative SAR value at the centre of the central H-plane at 1 cm depth in saline ([x, y, z] = [0, 0, −1 cm]) was 100%. The EHD was determined at three different locations: (1) at the centre of the applicator, i.e. central H-plane and central E-plane, (2) at the position of the maximum value at 1 cm depth in saline at the central E-plane and (3) according to the Quality Assurance (QA) guidelines Citation[35]. Following the QA guidelines, the maximum SAR value along the elliptical shell at 1 cm depth in saline was determined and the EHD was evaluated along the line through that point, perpendicular to the elliptical shell. The first two definitions of the EHD are applied because determining the EHD along the line described under (3) is not practical for QA measurements of bent applicators and during measurements the EHD was also determined at the centre of the measured H-plane. These values were compared to EHDs of flat antennas.
The effective field size (EFS, i.e. the region covered by the 50% iso-SAR contour at 1 cm depth in muscle tissue Citation[35]) was also determined for the simulated SAR distributions of the bent applicators. To this end, the SAR distributions were scaled such that the maximum SAR value along the elliptical shell at 1 cm depth in saline was 100%. Since the applicator is bent around a curved object, the contour at 1 cm depth in saline is also curved. Therefore, the corresponding SAR values at 1 cm depth are not necessarily located at voxel centres, and interpolation is applied to determine the SAR values along the elliptical curvature at 1 cm depth in saline. The EFS for bent applicators was also compared to results for straight applicators.
Results
Simulations and measurements for the 3H and 5H applicator
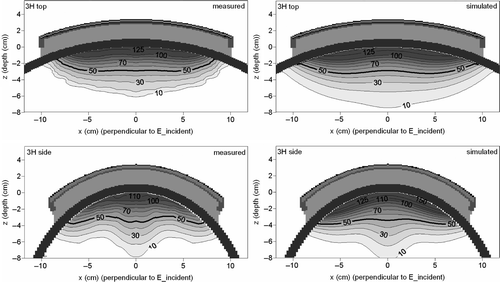
Contour plots of the measured and simulated SAR distribution in the xz-plane (H-plane), resulting from the 3H applicator bent around the top and the side of the elliptical phantom, are shown in . As stated in the Methods section, the measurement results were reconstructed from Lamaitre et al. Citation[22]. When bending the 3H applicator, a focusing effect of the SAR deposition becomes visible, which is most pronounced with a strong curvature. This focusing effect yields a strongly increased effective heating depth. The SAR patterns from the measurement and simulation are comparable. For the 3H applicator on top of the phantom, an EHD of 1.9 cm was found in both simulation and measurement in this plane (6 cm off-centre). For the 3H applicator at the side, both measurement and simulation yielded an EHD of 2.4 cm in the central H-plane.
Figure 5. Measured and simulated SAR patterns for the 3H applicator bent around the top or the side of the elliptical phantom. For the applicator on top of the phantom, the H-plane 6 cm off-centre is shown. For the applicator at the side, the central H-plane is shown.
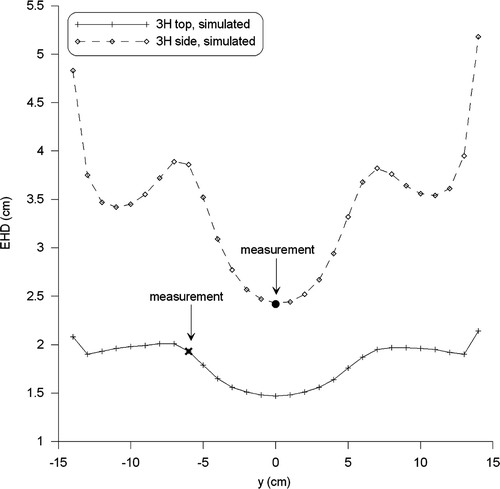
The location where the EHD is determined has a strong impact on the resulting value. shows the EHD along the y-axis determined from the simulations. The smallest EHD was found at the centre. The power deposition is strongest at the centre of the applicator (y = 0 cm) and relatively low near the outer sides of the applicator (y = ±14 cm). Consider, for example, the applicator at the side of the phantom, with the SAR at the central xz-plane normalised to 100% at 1 cm depth in saline. The relative SAR value at y = 13 cm in that case is only 14%. At about 5 cm depth in saline, the relative SAR has decreased to 7%, which makes the value for the EHD found here ∼4 cm. This large EHD is not very meaningful, because of these low SAR values.
Figure 6. The EHD for the 3H applicator at the top and the side of the phantom, determined from the simulations at different positions along the y-axis. The bold marks indicate the two measurements.
Contour plots of the measured and simulated SAR distribution in the central H-plane resulting from the 5H applicator bent around the top of the elliptical phantom are shown in . Again, measured and simulated SAR patterns are comparable. For the 5H applicator a stronger SAR deposition can be observed at the sides of the applicator compared to the centre region. This absence of a focusing effect results in a lower effective heating depth compared to the 3H applicator. The measured and simulated EHD was here 1.4 cm.
Figure 7. Contour plots of the measured and simulated SAR distribution in the central H-plane, resulting from the 5H applicator bent around the top of the elliptical phantom.

In both and , deviations between measurements and simulations are most pronounced in high gradient regions (i.e. near the fat layer of the phantom) and deeper in the phantom at very low SAR values, but outside these regions the SAR patterns are comparable.
Simulated SAR patterns for different applicator sizes
As observed from the results of the previous paragraph, the heating patterns of bent CFMA applicators can be dissimilar for different applicator types. Simulations were performed for all radiative applicators (2H, 3H, 4H and 5H) on top as well as at the side of the elliptical phantom. The simulated SAR patterns in the central xz-plane (H-plane, y = 0) and central yz-plane (E-plane, x = 0) for the applicators on top of the phantom are shown in . Both the 2H and 4H applicator show a focusing effect of the SAR and the relative SAR in the xz-plane is highest at the centre (x = 0). As observed in the previous paragraph, the 5H applicator shows a stronger power absorption at the sides, compared to the centre region. For the 3H applicator this is much less pronounced and the difference in SAR at the sides and the centre region is minimal.
Figure 8. Simulated SAR patterns in the central xz-plane (H-plane) and central yz-plane (E-plane) for different CFMA applicators on top of the elliptical phantom.
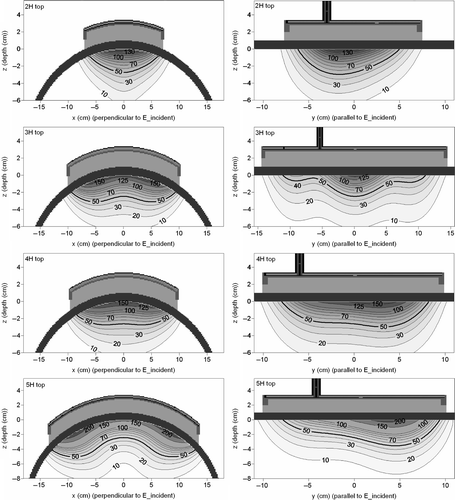
The SAR plots in the central E-plane show that the maximum power absorption is not necessarily at the location of the exciting slot, nor at the centre of the applicator. For the 3H applicator, the maximum SAR is located at the centre of the applicator, which coincides with the location of the exciting slot. This pattern is rather symmetric. For the 2H and 4H applicator, the maximum SAR value is off-centre (∼1.5–3 cm), but the strongest asymmetry is observed for the 5H applicator (∼4 cm off-centre).
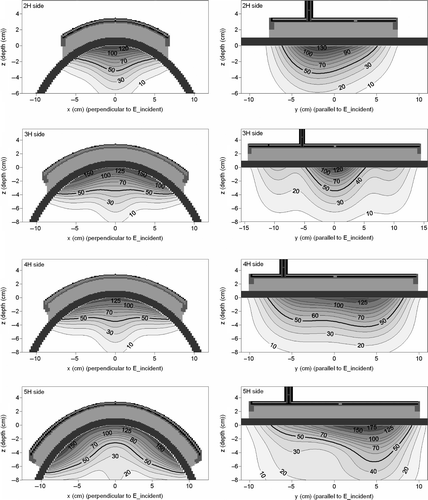
The simulated SAR patterns in the central xz-plane and the central yz-plane for the applicators at the side of the phantom are shown in . With a stronger curvature, the focusing effect of the SAR is more pronounced and heating is effective to a larger depth, since the distance between the 100% and 50% iso-SAR contours had increased, which means that the decay is slower. Furthermore, the maximum relative SAR value close to the fat layer, is lower compared to results in . The 5H applicator shows again a stronger power absorption at the sides, compared to the centre region, but here the difference is smaller, which means that the SAR distribution is less heterogeneous.
Figure 9. Simulated SAR patterns in the central xz-plane (H-plane) and central yz-plane (E-plane) for different CFMA applicators at the side of the elliptical phantom.
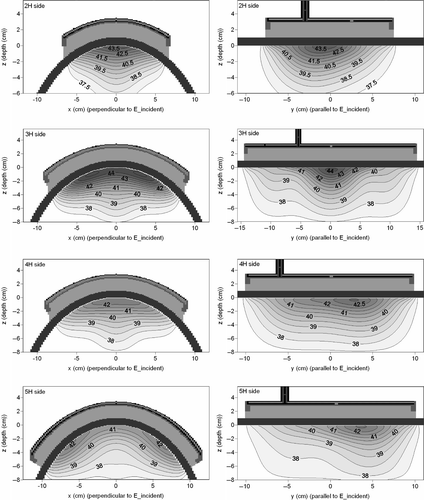
shows the steady-state temperature distributions for the different applicators bent around the side of the phantom. It can be observed that the patterns of the temperature distributions are rather similar to the SAR distributions of . Steady-state temperature levels were different for the four applicators, despite the fact that power scaling was proportional to the applicator sizes. For the thermal parameters assumed here, the relatively strong power absorption at the sides of the 5H applicator in the xz-plane resulted in a temperature distribution with approximately 1°C higher temperatures at the sides. However, for the other applicators the temperature distribution is actually more heterogeneous in the xz-plane; the temperature at the sides is lower compared to the centre region and this difference can be more than 2°C. A considerable temperature heterogeneity in axial direction (yz-plane) can be observed for all applicators.
Figure 10. Simulated steady-state temperature distributions in the central xz-plane (H-plane) and central yz-plane (E-plane) for different CFMA applicators at the side of the elliptical phantom. For this purpose, the fat-equivalent layer and the saline solution were considered fat and muscle tissue, respectively.
The EHD, (1) determined at the centre of the applicator, i.e. central H-plane and central E-plane, (2) at the position of the maximum value at 1 cm depth at the central E-plane and (3) determined according to the QA guidelines, is listed in together with the determined EFS. The EHD and EFS values for straight applicators are listed as well for comparison.
Table II. Effective field sizes for flat and bent applicators and the effective heating depth determined at different locations.
From it becomes clear that there can be a large difference in EFS for bent and flat applicators. In the direction parallel to the incident field the difference in EFS is minimal (<1 cm), except for the 3H applicator. For the 3H applicator the EFS is much smaller in this direction, which is probably an artefact (see Discussion). After bending, all applicators show a smaller EFS in the direction perpendicular to the incident field, i.e. along the curvature. This is more pronounced with a stronger curvature. The largest absolute difference observed was almost 7 cm, or ∼25%, for the 5H applicator bent around the side of the elliptical phantom. The largest relative difference was ∼37%, which was found for the 2H around the side.
The EHD increases when bending CFMA applicators, and this increase becomes larger with a stronger curvature. For example, the straight 2H applicator had an EHD of 1.6 cm, which became 1.8 and 2.3 cm (determined according to QA guidelines) after bending around the top and the side of the phantom, respectively. The values at different locations listed in show that the EHD value is strongly dependent on the location where it is determined. The largest difference from this table is about 6 mm (∼37%) for the 5H applicator, but at other locations the difference can be more than 1 cm. For straight applicators on the other hand, there is no significant difference in the EHD determined at different locations (data not shown).
Impact of air between rubber and active electrodes
Since for the flat applicators, air between the rubber frame and the active electrode plates had an impact on the SAR distribution, air layers were simulated for curved applicators as well.
Contour plots of the simulated SAR distributions in the central xz-plane (H-plane) with air at the centre or at the borders of the 3H and 5H applicator bent around the side of the elliptical phantom, are shown in . Air enclosure has a large impact on the SAR distribution and SAR patterns are very different from results in , where full contact was assumed. It becomes clear that air at the borders prevents SAR absorption at the sides of the bent applicator, since the coupling of the fields at the sides of the applicator becomes less efficient. Air at the centre on the other hand, yields more pronounced power absorption at the sides.
Figure 11. Simulated SAR patterns in the central xz-plane (H-plane) for the 3H and 5H applicators at the side of the elliptical phantom, assuming air between the rubber frame and the active electrodes. The air layers extended over the full applicator length in y-direction.
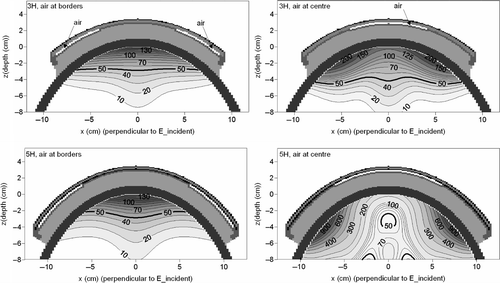
These air layers also have a large impact on the EHD. For example, for the 3H applicator, the EHD determined at the centre of the applicator was 1.9 and 3.2 cm when air was assumed at the borders or at the centre, respectively. Without any air assumed between the rubber and the electrodes, the EHD at the centre was 2.4 cm.
Discussion
This paper examined the SAR patterns of different CFMA applicators, when bent around a curved surface; in this case an elliptical fat–muscle phantom. Results showed that the SAR pattern, EFS and EHD depended on the applicator size.
Some deviation can be observed between the measured and simulated SAR patterns ( and ). Deviations are most pronounced in high gradient regions (i.e. near the fat layer of the phantom) and deeper in the phantom, at very low SAR values. When E-field values are very low, measurements become less reliable, which explains the deviations in those regions. The field distributions were measured using a rigid arm with an E-field probe attached to the end which can be moved horizontally and vertically in a selected xz-plane. Therefore, it is not possible to perform a measurement scan right along the curved fat layer, and some extrapolation is performed in these regions by the software generating the contour plots. Furthermore, the high SAR values are limited to small regions which are difficult to reach and measure accurately with a probe attached to a rigid arm. Nevertheless, the simulated and measured SAR patterns were comparable outside these regions and the results provided enough confidence in the simulated SAR patterns.
Measured SAR distributions of two applicators with two different curvatures that are comparable to the simulations are sufficient to be confident that the simulation results for all applicators are correct. Since E-field scanning measurements are very time consuming, a limited set of measurements was performed. The 3H and 5H applicator were selected for measurements, since these large applicators are more frequently used in the clinic than the 2H and 4H antennas. Furthermore, the antenna design of all radiative CFMA applicators is identical.
For straight applicators, air between the rubber frame and the active electrodes turned out to have a strong impact on the SAR distribution in regions with a relative SAR value above 50% and measurement results showed that in practice some (unknown and irreproducible) air enclosure can be present Citation[34]. The location and extent of air enclosure is unknown since the construction of the applicator does not allow any visual inspection of the contact between the rubber layer and the electrode plates. The simulated SAR patterns with air enclosure () were very different from those without any air assumed. Furthermore, the assumed air enclosure changed the EHD significantly. This shows that air enclosure would have a larger impact for curved applicators than for flat CFMAs. However, since all three patterns of the simulations without air and measurements in and were comparable and the measured and simulated EHD was equal, it is not likely that air will be present between the rubber and the electrodes in daily practice. This can be explained by the fact that bending the antenna compresses the rubber and thereby enforces contact between the rubber frame and the electrodes.
When bending a CFMA applicator, the EFS was found to decrease (), especially in the direction perpendicular to the incident field (i.e. along the curvature). This is attributable (at least in part) to the radial decrease in heated volume with increasing curvature. For the direction parallel to the field, the EFS was more or less stable, except for the 3H applicator. The large decrease in EFS found here is probably an artefact caused by staircase and dispersion errors. The SAR pattern in the yz-plane of the 3H applicator is more sensitive to such errors than the SAR pattern of the other three applicators (), since the 50% contour reaches to a larger depth at the centre of the applicator compared to the sides. This difference is less pronounced for the other applicators.
This study showed that the behaviour of the CFMA applicators is not trivial when bending the antenna around a curved (body) structure; it is not a simple extrapolation from the behaviour of flat applicators. Intuitively, a focusing effect would be expected, resulting in an increased EHD at the centre of the applicators, which is supposed to be stronger for applicators with a larger electrode length perpendicular to the incident field. Thus one would expect the smallest EHD at the centre for the 2H applicator and the largest EHD for the 5H. However, especially the 5H antenna showed a strongly pronounced pattern with a larger SAR deposition at the sides compared to the centre region. The behaviour of applicators is normally analysed in a flat state and the SAR pattern, EFS and EHD are determined. In view of the results of this study, showing that the SAR pattern, EFS and EHD are different for bent applicators, investigation of the heating pattern of other flexible applicators in a bent state is advisable. Simulations can be very useful for this purpose, since it is very difficult to measure the EHD and EFS according to the QA guidelines for bent antennas.
The absence of the focusing effect for the 5H applicator observed in this study for both measurements and simulations, is in contrast with previously published results of the SAR distribution for this applicator Citation[7]. The absence of the focusing effect can be explained by the strong contribution of the TE10 mode in this antenna Citation[36]. The TE10 mode is supported at 434 MHz if the excitation gap is longer than 21.86 cm. For the 5H applicator, the excitation gap is 28.5 cm long and the TE10 mode has a strong contribution to the field distribution. The focussing effect presented for the 5H applicator in the publication by Gelvich et al. Citation[7] can be explained when the SAR pattern is evaluated and scaled at a different location. As observed in this study, the EHD varies with the position at which it is determined and the SAR pattern in the central E-plane is asymmetric (). When the SAR distribution is evaluated and normalised in the H-plane 6 cm off-centre, a focussing effect will be observed Citation[36].
The relatively strong SAR deposition at the sides of the 5H applicator might lead to problems in clinical application. This applicator is often applied either on the thorax wall or bent around the patient's side. Due to the inhomogeneous SAR deposition, hot spots can be expected, for example near the rib bones. However, as a result of conduction and perfusion, the temperature distribution will be more homogeneous than the SAR distribution. In some cases, pain complaints near bones are registered during treatments at our department with the 5H applicator, but the clinical impact of the SAR distribution of the antennas needs to be investigated further, using temperature calculations and analysis of available clinical data.
For the thermal simulations in the fat-muscle geometry performed in this study, the overall distributions were very similar to the SAR distributions. The temperatures at the sides of the 5H applicator were approximately 1°C higher than at the centre (). However, these differences were not very large compared to the other applicators, where the temperature at the sides can be more than 2°C lower compared to the centre region. The commonly applied Pennes’ model was used for the thermal simulations, which has a drawback that it does not account for heat transport by (small) vessels and the direction of blood flow. A combined heat sink/keff model can be used for more realistic temperature calculations Citation[37], but information about the local blood flow is needed to estimate keff.
The clinical impact of the SAR distributions of curved CFMA antennas needs to be investigated further, but when selecting an applicator for treatment one should be aware that the EFS in the direction perpendicular to the incident field decreases significantly when the applicator is applied with a strong curvature. Furthermore, one should realise that the EHD is different for the different applicator sizes and not always significantly larger than for flat applicators. The EHD is also dependent on the curvature and on the location where it is determined. It is therefore better to use a lower frequency to guarantee a larger penetration depth of the EM power for tumour lesions with a deeper penetration in tissue compared to standard superficial indications. A 70 MHz CFMA applicator can be used for these purposes, combining flexibility with good penetration depth Citation[7].
The impact of the SAR deposition and the resulting temperature distribution of different curved CFMA applicators in patient anatomies is the subject of current research.
Conclusion
The behaviour of bent CFMA applicators is not a simple extrapolation from the behaviour of flat applicators and the SAR patterns are not similar for all applicator sizes. The 5H applicator especially shows a strong power absorption at the sides of the applicator, compared to the centre region. The EFS decreases when bending CFMA antennas and the EHD increases, but the EHD value depends strongly on the location where it is determined. In view of the results presented in this study, it is generally advisable to analyse the SAR distribution of flexible applicators in both straight and bent state.
Acknowledgements
This research is financially supported by the Dutch Cancer Society.
Declaration of interest: The authors report no conflicts of interest. The authors alone are responsible for the content and writing of the paper.
References
- Perez CA, Kuske RR, Emami B, Fineberg B. Irradiation alone or combined with hyperthermia in the treatment of recurrent carcinoma of the breast in the chest wall: a nonrandomized comparison. Int J Hyperthermia. 1986; 2: 179–187
- Overgaard J, Overgaard M. Hyperthermia as an adjuvant to radiotherapy in the treatment of malignant melanoma. Int J Hyperthermia. 1987; 3: 483–501
- Van der Zee J, Gonzalez GD, Van Rhoon GC, van Dijk JDP, van Putten WLJ, Hart AA. Comparison of radiotherapy alone with radiotherapy plus hyperthermia in locally advanced pelvic tumours: a prospective, randomised, multicentre trial. Dutch Deep Hyperthermia Group. Lancet. 2000; 355: 1119–1125
- Jones EL, Oleson JR, Prosnitz LR, Samulski TV, Vujaskovic Z, Yu D, Sanders LL, Dewhirst MW. Randomized trial of hyperthermia and radiation for superficial tumors. J Clin Oncol. 2005; 23: 3079–3085
- Issels RD. Regional hyperthermia in high-risk soft tissue sarcomas. Current Opinion in Oncology. 2008; 20: 438–443
- Jones EL, Marks LB, Prosnitz LR. Point: Hyperthermia with radiation for chest wall recurrences. J Natl Compr Canc Netw. 2007; 5: 339–344
- Gelvich EA, Mazokhin VN. Contact flexible microstrip applicators (CFMA) in a range from microwaves up to short waves. Ieee Transactions on Biomedical Engineering. 2002; 49: 1015–1023
- Stauffer PR, Rossetto F, Leoncini M, Gentilli GB. Radiation patterns of dual concentric conductor microstrip antennas for superficial hyperthermia. IEEE Trans Biomed Eng. 1998; 45: 605–613
- Rietveld PJ, van Putten WL, van der ZJ, Van Rhoon GC. Comparison of the clinical effectiveness of the 433 MHz Lucite cone applicator with that of a conventional waveguide applicator in applications of superficial hyperthermia. Int J Radiat Oncol Biol Phys. 1999; 43: 681–687
- Lee ER, Wilsey TR, Tarczy-Hornoch P, Kapp DS, Fessenden P, Lohrbach A, Prionas SD. Body conformable 915 MHz microstrip array applicators for large surface area hyperthermia. IEEE Trans Biomed Eng. 1992; 39: 470–483
- Gopal MK, Hand JW, Lumori ML, Alkhairi S, Paulsen KD, Cetas TC. Current sheet applicator arrays for superficial hyperthermia of chestwall lesions. Int J Hyperthermia. 1992; 8: 227–240
- Dewhirst MW, Sim DA, Sapareto S, Connor WG. Importance of minimum tumor temperature in determining early and long-term responses of spontaneous canine and feline tumors to heat and radiation. Cancer Res. 1984; 44: 43–50
- Sneed PK, Gutin PH, Stauffer PR, Phillips TL, Prados MD, Weaver KA, Suen S, Lamb SA, Ham B, Ahn DK. Thermoradiotherapy of recurrent malignant brain tumors. Int J Radiat Oncol Biol Phys. 1992; 23: 853–861
- Wust P, Rau B, Gellerman J, Pegios W, Loffel J, Riess H, Felix R, Schlag PM. Radiochemotherapy and hyperthermia in the treatment of rectal cancer. Recent Results Cancer Res. 1998; 146: 175–191
- Oleson JR, Samulski TV, Leopold KA, Clegg ST, Dewhirst MW, Dodge RK, George SL. Sensitivity of hyperthermia trial outcomes to temperature and time: implications for thermal goals of treatment. Int J Radiat Oncol Biol Phys. 1993; 25: 289–297
- Van der Zee J, Peer-Valstar JN, Rietveld PJM, Graaf-Strukowska L, Van Rhoon GC. Practical limitations of interstitial thermometry during deep hyperthermia. Int J Radiat Oncol Biol Phys. 1998; 40: 1205–1212
- Kroeze H, van de Kamer JB, De Leeuw AAC, Lagendijk JJW. Regional hyperthermia applicator design using FDTD modelling. Phys Med Biol. 2001; 46: 1919–1935
- de Bruijne M, Wielheesen DH, Van der Zee J, Chavannes N, Van Rhoon GC. Benefits of superficial hyperthermia treatment planning: five case studies. Int J Hyperthermia. 2007; 23: 417–429
- Kok HP, De Greef M, Correia D, Vörde Sive Vörding Zum, Van Stam PJ, Gelvich G, Bel EA, Crezee A, J. FDTD simulations to assess the performance of CFMA-434 applicators for superficial hyperthermia. Int J Hyperthermia. 2009; 25: 462–476
- Wust P, Fahling H, Jordan A, Nadobny J, Seebass M, Felix R. Development and testing of SAR-visualizing phantoms for quality control in RF hyperthermia. Int J Hyperthermia. 1994; 10: 127–142
- Allen S, Kantor G, Bassen H, Ruggera P. CDRH RF phantom for hyperthermia systems evaluations. Int J Hyperthermia. 1988; 4: 17–23
- Lamaitre G, Van Dijk JDP, Gelvich EA, Wiersma J, Schneider CJ. SAR characteristics of three types of Contact Flexible Microstrip Applicators for superficial hyperthermia. Int J Hyperthermia. 1996; 12: 255–269
- Wiersma J, van Dijk JDP, Sijbrands J, Schneider CJ. The measurement of fringing fields in a radio-frequency hyperthermia array with emphasis on bolus size. Int J Hyperthermia. 1998; 14: 535–551
- de Bree J. The development of a treatment planning system for interstitial hyperthermia. PhD Thesis. Utrecht University 1998.
- van de Kamer JB, De Leeuw AAC, Hornsleth SN, Kroeze H, Kotte ANTJ, Lagendijk JJW. Development of a regional hyperthermia treatment planning system. Int J Hyperthermia. 2001; 17: 207–220
- Taflove A, Hagness SC. Computational Electrodynamics, 2nd edition. Artech House, BostonLondon 2000
- Cummer SA. A simple, nearly perfectly matched layer for general electromagnetic media. Ieee Microwave and Wireless Components Letters. 2003; 13: 128–130
- Hu W, Cummer SA. The Nearly Perfectly Matched Layer is a Perfectly Matched Layer. IEEE Antennas and Wireless Propagation Letters. 2004; 3: 137–140
- Berenger JP. A Perfectly Matched Layer for the Absorption of Electromagnetic-Waves. Journal of Computational Physics. 1994; 114: 185–200
- Lide DR. CRC handbook of chemistry and physics : a ready-reference book of chemical and physical data. Chemical Rubber Company Press, Boca Raton, FL 2001
- Guy AW. Analyses of electromagnetic fields induced in biological tissues by thermographic studies on equivalent phantom models. IEEE Transactions on Microwave Theory and Techniques. 1971; 19: 205–214
- Pennes HH. Analysis of tissue and arterial blood temperatures in the resting human forearm. J Appl Physiol. 1948; 1: 93–122, 1948
- ESHO Taskgroup Committee. Treatment Planning and Modelling in Hyperthermia, a Task Group Report of the European Society for Hyperthermic Oncology (Rome, Italy: Tor Vergata).
- Kok HP, De Greef M, Correia D, Zum Vörde Sive Vörding PJ, Van Stam G, Gelvich EA, Bel A, Crezee J. FDTD simulations to assess the performance of CFMA-434 applicators for superficial hyperthermia (in press). Int J Hyperthermia. 2009.
- Hand JW, Lagendijk JJ, Bach AJ, Bolomey JC. Quality assurance guidelines for ESHO protocols. Int J Hyperthermia. 1989; 5: 421–428
- Correia D, Kok HP, De Greef M, Bel A, Van Wieringen N, Crezee J. Body conformal antennas for superficial hyperthermia: The impact of bending Contact Flexible Microstrip Applicators on their electromagnetic behavior (accepted). IEEE Trans Biomed Eng. 2009.
- COMAC-BME. Workshop on Modelling and Planning in Hyperthermia (Lagonissi 1990), conclusions subgroup Thermal Modelling (by J.J.W Lagendijk). COMAC-BME Hyperthermia Bulletin. 1990; 4: 47–49