Abstract
Purpose: High intensity focused ultrasound (HIFU) is used during hyperthermia cancer treatment to increase the tumour temperature. For an adequate and safe application it is important to measure the temperature in the heated region, preferably in a non-invasive manner and by the same modality as used for heating. The goal of this feasibility study is two-fold; first, it is investigated whether the acoustic non-linearity parameter B/A is most suitable for measuring temperature changes, second, a non-invasive thermometry method based on B/A is proposed and demonstrated.
Material and methods: Water is used to confirm that B/A is a sensitive acoustic medium parameter that is practically applicable for non-invasive thermometry. Next, a thermometry method is proposed that employs the ratios between the fundamental and the higher harmonic frequency components of a non-linear acoustic wave. The method determines these ratios for a measured acoustic pulse that has traversed a certain medium, and compares these with temperature dependent reference ratios for the same medium. The method is demonstrated using simulated measurements of an acoustic plane wave propagating in glycerol.
Results: Results obtained for water show that B/A is more sensitive for temperature changes than other practical acoustic parameters. For a combination of 16 simulated measurements, it is demonstrated that temperature can be predicted non-invasively with zero bias and a standard deviation of 2°C if the noise level does not exceed −40 dB.
Conclusion: The suitability of B/A as a basis for non-invasive thermometry is confirmed, and a non-invasive thermometry method based on B/A is proposed and successfully demonstrated.
Introduction
Therapeutic heat is applied to cancer treatment, either as an adjuvant (e.g. hyperthermia) to other therapies (e.g. chemo or radiation therapies) Citation[1–10] or as a stand-alone therapy (e.g. thermal ablation therapy) Citation[11–15]. Although various methods exist to increase the tumour temperature, high intensity focused ultrasound (HIFU) is particularly interesting Citation[16–19] in view of its focusing capabilities. With HIFU the intensity of the acoustic wave field increases to levels where its propagation is noticeably non-linear. This manifests itself in the time domain as distortion of the wave shape, and in the frequency domain as the formation of higher harmonic components, i.e. components with frequencies that are multiples of the frequencies of the source signal. The latter fact is significant for HIFU; absorption usually increases with frequency, and the occurrence of higher harmonics will cause dissipation to be larger than in the linear case Citation[20]. The magnitude of the non-linear effects depends, among others, on the acoustic non-linearity parameter B/A of the medium Citation[21], Citation[22].
Before starting a HIFU treatment, it will be optimised by making a treatment plan. This involves the selection of the desired temperature profile and thermal energy flow Citation[23], Citation[24], and the determination of the required acoustic wave field. The latter step should ideally take into account the non-linear propagation of the field in an attenuative medium Citation[25–29]. During the treatment it should be monitored whether the actual temperature increase in the tumour and the surrounding medium is according to the treatment plan. For both the patient and the clinician it is most convenient when this monitoring is done in a non-invasive manner. In the past, various methods have been investigated to achieve this goal: impedance tomography, active and passive microwave imaging, CT, as well as laser, infrared, magnetic resonance (MR), and ultrasound techniques Citation[30]. In terms of logistics (instrumentation and operation) and costs it may be advantageous to pursue another goal: to use the same modality for treatment and monitoring. Both of these goals may be achieved with ultrasound, since sound waves may be used for both non-invasive hyperthermia and non-invasive thermometry Citation[31]. In addition, ultrasound may be used for monitoring and control of the planned patient and applicator positions, which is an important issue as well Citation[32].
To non-invasively monitor the temperature profile using ultrasound, in the region of interest the value of an acoustic medium parameter that is sensitive to temperature changes should be tracked in time. Provided that the temperature dependence of that parameter is known in advance, the distribution of its value may next be translated into a temperature map. Although this procedure may sound simple, the practical application involves many difficulties. Some issues that should be overcome are: finding a suitable acoustical medium parameter, developing a method to extract the parameter value from noisy measurements, finding the temperature dependence of the parameter for various types of biomedical tissues, eliminating or compensating the temperature dependence of other acoustical parameters, eliminating or compensating the influence of tissue inhomogeneities and gas bubbles, and achieving spatial selectivity.
Regarding the issue of finding a suitable acoustical medium parameter, it may be observed that several parameters have been proposed as a basis for non-invasive thermometry, such as the speed of sound, the acoustic absorption coefficient, the volume coefficient of thermal expansion, and the acoustic non-linearity parameter B/A. In the literature, many thermometry methods have been described that are based on the latter parameter. Most methods for the measurement of B/A extract this parameter from the pressure dependence of the speed of sound by employing an arrangement with a pump wave and a probe wave Citation[33–38]. A different way of obtaining B/A is to consider the amplitude of the mixing components generated during the simultaneous propagation of two waves with different frequencies Citation[39]. Still another method obtains B/A from the amplitude of the second harmonic Citation[40], or the ratio between the second harmonic and the fundamental Citation[41], Citation[42]. Despite earlier interest in using B/A for thermometry, the question whether this is the most suitable parameter for this purpose still seems unanswered. The first goal of this paper is to quantitatively support the choice for B/A as a basis for non-invasive thermometry.
Regarding the issue of extracting the value of the relevant acoustic medium parameter from noisy measured data, it is observed that in the noise-free case the data contain redundancy. This fact may be employed to reduce the influence of noise. Therefore, the second goal of this paper is to formulate and demonstrate a non-invasive thermometry method that exploits redundancy for noise reduction.
To compare the suitability of different acoustic medium parameters as a basis for non-invasive thermometry, we need a medium with a well-known behaviour over a wide range of conditions. The best candidate for this is water; extensive data of the temperature dependence of acoustic medium parameters for biological tissues are not yet reported in literature. We will base our non-invasive thermometry method on non-linear acoustics, and we will use the redundancy between the higher harmonics to decrease the adverse influence of noise. The proposed method employs the ratios between the fundamental and the higher harmonics. For each measured acoustic pulse that has traversed a certain medium, these ratios are determined, and compared with the corresponding, temperature-dependent reference ratios for the same medium. This yields a prediction of the actual temperature of the medium. In this paper, we demonstrate the method by using simulated measurements of an acoustic plane wave propagating in glycerol. We use this material because of its increased tissue-like behaviour in comparison with water, and the fact that the temperature dependence of its acoustic parameters is well known. In the current context of a feasibility study, we restrict ourselves to a one-dimensional configuration with a homogeneous medium and a uniform temperature distribution. Issues such as compensating for the temperature dependence of other acoustical parameters, compensating for the influence of tissue inhomogeneities and gas bubbles, and achieving spatial selectivity, however important for the further development of the method, will currently be left unaddressed.
Theory and methods
We start by formulating the basic equation that describes the non-linear propagation of acoustic waves in biological tissue. Next, we show the cause of the temperature dependency of the acoustic non-linearity parameter B/A. Subsequently, we present a one-dimensional approximate method for the simulation of the non-linear acoustic wave field. Finally, we propose a non-invasive thermometry method which is based on the ratios between the various harmonic components that are present in the non-linear acoustic wave field.
Non-linear wave equation
The non-linear propagation of acoustic waves in biological tissue is well described by the Westervelt equation Citation[43]. For a homogeneous, isotropic, lossless medium this equation readswhere
is the acoustic pressure field, which depends on the spatial position
and the time t. Further, c is the ambient speed of sound, ρ is the ambient volume density of mass, β is the coefficient of non-linearity, and
and
denote the volume density of volume force and the volume density of volume injection rate, respectively, of the sound source. The first term on the right hand side of Equation 1 is a non-linear term that represents the non-linear propagation of the acoustic wave. The non-linearity manifests itself by the formation of higher harmonic wave fields. The generation of higher harmonics depends, among others, on the coefficient of non-linearity. This coefficient may be written as
where the A and B/2 are the first two coefficients in the Taylor series expansion of the equation of state for the medium under isentropic conditions Citation[22].
Temperature dependency of the acoustic non-linearity parameter
Acoustic medium parameters such as the acoustic non-linearity parameter B/A are known to be temperature dependent. It has been shown by Beyer Citation[44] that B/A may be divided intowhere
is the speed of sound, αT is the volume coefficient of thermal expansion, cp is the specific heat at constant pressure, and T is the absolute temperature of the medium. Note that the subscript “0” will be used throughout the paper to indicate parameter values under ambient conditions. From Equation 3 it becomes clear that B/A consists of two contributions, of which
is based on isothermal pressure changes, while
is based on isobaric temperature changes. These terms can be understood as the relative increase in the phase velocity caused by variations in pressure (Equation 4), and temperature (Equation 5), see Citation[44], Citation[45].
Equation 3 clearly reveals the temperature dependency of B/A. The total effect of temperature changes on the formation of higher harmonics follows from the temperature dependence of the entire factor in the non-linear term in Equation 1, and also involves the temperature behaviour of ρ and c.
Simulation of non-linear acoustic waves with the Burgers equation
The development of our method for measuring the temperature of a medium necessitates that we can simulate the non-linear propagation of acoustic waves for different values of B/A. In the current context we prefer to perform this with the one-dimensional, forward wave method based on the equation derived by Burgers Citation[46]. This equation may be obtained from the one-dimensional, lossless and source-free Westervelt equation, and provides the simplest method to compute non-linear wave propagation. The Burgers equation readswith retarded time
and spatial coordinate x Citation[22]. This equation has the implicit solution
where the spatial step size Δx must be small enough to yield only a small variation in the pressure
. A full derivation of the employed solution method is given by Huijssen Citation[27].
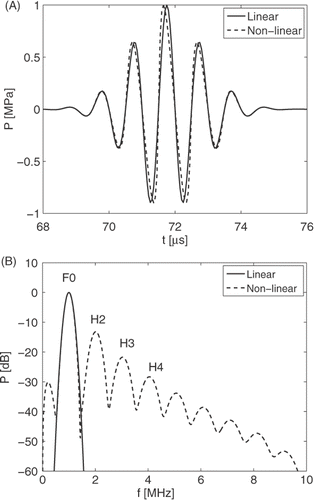
As an example, we may use Equation 7 to compute the propagation of a one-dimensional, pulsed, acoustic wave in water at T = 35°C (ρ = 994 kg m−3, c = 1520 m s−1, β = 3.7). At the source, the pressure pulse is a Gaussian modulated pulse that equals
with source pressure amplitude P0 = 1.0 MPa, centre frequency f0 = 1 MHz, time delay
, and envelope width
. In , the time domain and frequency domain results for non-linear propagation of the wave over a distance of x = 0.1 m are shown and compared with the results for linear propagation. In the time domain, the non-linear behaviour causes a steepening of the up-going parts of the wave shape. In the frequency domain, this manifests itself through the generation of the higher harmonics H2, H3, H4, etc., in addition to the fundamental spectrum F0. Moreover, the non-linear behaviour causes a self-demodulated signal at frequencies below F0 Citation[22]. The magnitude of the observed non-linear phenomena will depend on the value of the acoustic non-linearity parameter B/A, and will thus change with the temperature of the medium.
Figure 1. Comparison between a linear and a non-linear pulsed, plane acoustic wave. The waves propagate in water and are evaluated at a propagation distance x = 0.1 m; (A) temporal results, (B) spectral results. The non-linear waves are obtained by using the solution of the Burgers equation.
The thermometry method that we will propose in the next section will be applicable to both pulsed and (quasi) steady-state wave fields. In situations where the (quasi) steady-state wave field of the HIFU applicator is used for heating, it is efficient to employ a frequency domain solution of the Burgers equation Citation[47]. However, in situations where a pulsed wave field is used for heating, a time domain approach is preferable. In this paper we will consider the latter.
Non-invasive thermometry based on non-linearity
In the previous sections we have made plausible that the acoustic non-linearity parameter B/A is temperature dependent and that variations in temperature affect the non-linear propagation of the acoustic wave. In particular, the amplitudes Hi of the ith harmonic component of the non-linear acoustic wave field depend on the value of B/A. In the Results section below we will show that this dependence on B/A is different for each i. A general approach to determine temperature profiles during HIFU treatment is to reconstruct an acoustic medium parameter from measured data of the scattered acoustic field, and to relate the local values of the parameter to the local temperatures. To employ non-linearity for non-invasive thermometry, this would require a method to solve the Westervelt equation for known measured data of the pressure field and the unknown parameter B/A, or more precisely, the unknown factor . In practice, this means that a non-linear scheme is needed to invert the Westervelt equation. Approaches as formulated for linear acoustics Citation[48] are not expected to work due to the ill-posedness of the problem. Hence, we propose a pragmatic method for the extraction of B/A, or in fact the temperature, from measured acoustic field data.
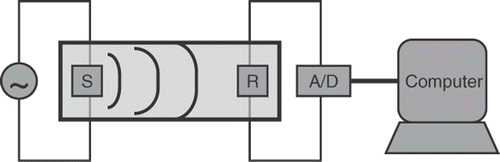
To explain our method, we consider a one-dimensional configuration for transmission-mode measurements in a homogeneous medium at a constant and uniform temperature. A schematic overview of this configuration is shown in . In this configuration a fixed source S is generating a prescribed pressure pulse, which travels towards receiver R. First we simulate the non-linear acoustic wave field for a given propagation distance x, over a range of temperatures. From this we obtain a set of reference ratios , each of which is defined as the ratio between the amplitudes of the ith and the jth harmonic component. The reference ratios
are equal to
These temperature-dependent ratios are stored for later use.
Figure 2. The one-dimensional transmission-mode set-up used for demonstrating the non-invasive thermometry method. An electric pulse drives a submerged acoustic transducer S which generates an acoustic wave field. The non-linearly propagating field is measured with a receiver R. The received analogue signal is converted via an A/D converter and recorded by the computer for further signal processing.
Next, for an as yet unknown temperature, the non-linear wave field at the propagation distance x is measured. From this we obtain a set of measured ratios . Relating a measured ratio to the corresponding reference ratio
delivers us, from each ratio, a temperature prediction Ti,j. The separate temperature predictions will differ due to the noise in the measured data. By averaging the temperature predictions for the different ratios, we obtain a prediction
for the temperature of the medium. We may further improve the result by averaging the values of
obtained from multiple measurements.
Results
We first present the acoustic non-linearity parameter B/A for water as a function of temperature, and we explain why this parameter is a good candidate to measure temperature. Next, we show simulations of the acoustic wave field in glycerol at various temperatures, as obtained with the solution of the Burgers equation. Finally, for the one-dimensional case, we demonstrate the prediction of the temperature of a medium from simulated noisy data.
Temperature dependency of the acoustic non-linearity parameter
As a consequence of Equation 3, a quantitative examination of the temperature dependency of the acoustic non-linearity parameter B/A requires knowing the behaviour of the volume density of mass ρ, the volume coefficient of thermal expansion αT, and the specific heat cp, as a function of temperature T and for a given ambient pressure p0. We limit our temperature range of interest to T = [20°C, 70°C], although in some applications temperature increases above 70°C occur. For the ambient atmospheric pressure we take p0 = 0.1 MPa. Since we want to assess the temperature behaviour of as many acoustic parameters as possible, at this stage we consider the most studied liquid, i.e. water, as testing medium. In we present ,
,
, and in addition
. The latter is the temperature-dependent coefficient for square power law acoustic absorption, which is typical for water; most biological tissues show frequency power law absorption with an exponent between 1 and 2. The functions in are obtained by interpolating a set of values that have been measured at p0 = 0.1 MPa and over the temperature range T = [0°C, 100°C], as reported in Citation[49–51]. Moreover, Equation 3 requires a model of
, i.e. the speed of sound as a function of both temperature and pressure. Various models are based on least square curve fitting of a polynomial function to a set of measurement values. The most well-known are from Belogol'skii et al. Citation[52], whose model is only valid up to T = 40°C, and from Bilaniuk and Wong Citation[53], whose model is only valid at p0 = 0.1 MPa. Unfortunately, the temperature range of the first model is lower than the temperature range we are interested in, while the second model does not yield any pressure dependence. Therefore, we use the less well-known model developed by Wilson Citation[51], which is based on measurements over the temperature range T = [0.9°C, 91.2°C] and the pressure range p = [0.1 MPa, 96 MPa]. This is the same model as used by Beyer Citation[44] to compute B/A for a limited number of temperatures. The resulting speed of sound as a function of temperature and pressure is shown in . The results clearly reveal that over the given temperature and pressure ranges, the changes in the speed of sound are dominated by variations in temperature. Next, we compute the gradient of the speed of sound function
along the pressure axis to obtain (B/A)1 for isothermal pressure changes, and along the temperature axis to obtain (B/A)2 for isobaric temperature changes. The results are shown in . Note that the contributions to B/A from the isothermal temperature changes are much higher than the contributions from the isobaric pressure changes.
Figure 3. Acoustic medium parameters of water as a function of temperature, at ambient pressure; (A) specific heat cp, (B) volume density of mass ρ, (C) volume coefficient of thermal expansion αT, (D) acoustic absorption coefficient . Continuous results (solid lines) are obtained by interpolating discrete values (dots). The values are obtained from Lide, Spickler et al., and Wilson Citation[49–51].
![Figure 3. Acoustic medium parameters of water as a function of temperature, at ambient pressure; (A) specific heat cp, (B) volume density of mass ρ, (C) volume coefficient of thermal expansion αT, (D) acoustic absorption coefficient . Continuous results (solid lines) are obtained by interpolating discrete values (dots). The values are obtained from Lide, Spickler et al., and Wilson Citation[49–51].](/cms/asset/b10d5b46-0ee2-4057-96ec-2d12f0659117/ihyt_a_599357_f0003_b.gif)
Figure 4. The speed of sound of water as a function of pressure and temperature. The values are obtained from the model by Wilson Citation[51].
![Figure 4. The speed of sound of water as a function of pressure and temperature. The values are obtained from the model by Wilson Citation[51].](/cms/asset/2a2ad5ad-6f13-4b16-9c36-153bc48492a8/ihyt_a_599357_f0004_b.gif)
Figure 5. The contributions to the acoustic non-linearity parameter B/A of water arising from isothermal pressure changes and isobaric temperature changes, at ambient pressure.
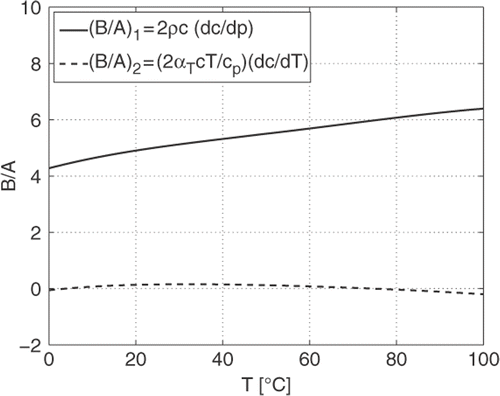
Combining (B/A)1 and (B/A)2 results in the required acoustic non-linearity parameter B/A as a function of temperature and pressure, see . In this figure we compare our computed values for B/A with the results obtained by Beyer Citation[44] and Hagelberg et al. Citation[54]. These authors computed their results in the same way as we computed ours, using data measured by Wilson Citation[51] and Holton Citation[55], respectively. Our results are in close agreement with Beyer's results, which is expected since the underlying model for is identical. The deviation between our results and those of Hagelberg may entirely be attributed to the difference in the employed model.
Figure 6. The computed acoustic non-linearity parameter B/A of water at ambient pressure, compared with values obtained by Beyer Citation[44] and Hagelberg et al. Citation[54].
![Figure 6. The computed acoustic non-linearity parameter B/A of water at ambient pressure, compared with values obtained by Beyer Citation[44] and Hagelberg et al. Citation[54].](/cms/asset/08cd9f25-48a6-4519-b841-7d6f49479b0e/ihyt_a_599357_f0006_b.gif)
In order to compare the sensitivity of the acoustic medium parameters for temperature changes, we present the behaviour of B/A, c, ρ, αT, , and cp in one graph, see . Note that, prior to starting hyperthermia treatment with HIFU, the temperature of the tumour and the surrounding tissue is known. Hence, only the temperature increase in the region of interest is of importance and should be measured. Consequently, it is more relevant to investigate the relative change of a medium parameter as a function of temperature than its absolute value. Therefore, in we have used the reference temperature T0 = 37°C. For numerical comparison, in we present the relative change of each mentioned parameter over the temperature intervals T = [37°C, 42°C] and T = [37°C, 70°C].
Figure 7. The relative changes of the parameters B/A, c, ρ, ,
, and cp of water. The reference temperature is T = 37°C at ambient pressure.
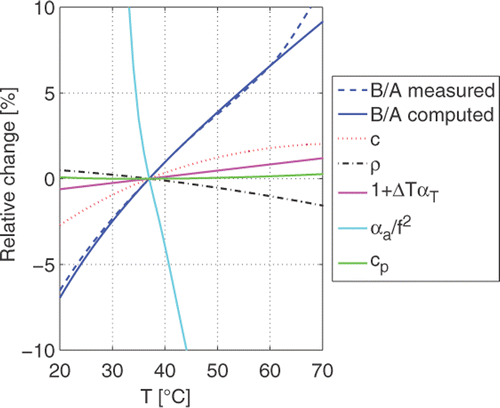
Table I. The relative changes of the parameters B/A, c, ρ, αT, , and cp when T increases from 37°C to 42°C and from 37°C to 70°C, for water.
The results in clearly show that the acoustic absorption coefficient is the most sensitive to temperature changes. The second most sensitive is the acoustic non-linearity parameter B/A, which in turn is at least four times more sensitive to changes in temperature than the speed of sound c, the volume density of mass ρ, the volume coefficient of thermal expansion αT, and the specific heat cp. In practice
is hard to measure because it is difficult to distinguish absorption from scattering effects. Consequently, B/A could be more favourable for non-invasive thermometry. Note that these results are based on water, whereas the results might vary between different types of tissue.
Simulation of non-linear acoustic waves with the Burgers equation
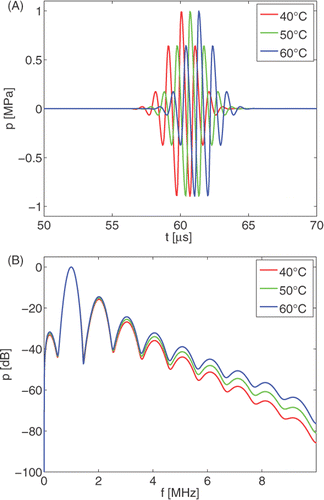
The results presented in the previous section demonstrate the temperature dependency of the acoustic medium parameters that occur in the non-linear acoustic wave equation. The influence of temperature on the non-linear propagation of an acoustic wave may most easily be demonstrated for a one-dimensional acoustic wave in a homogeneous and lossless medium. In we show the results of one-dimensional acoustic wave simulations that are based on the Burgers equation. This figure displays both the temporal and the spectral content of waves that have propagated over a distance of x = 0.1 m in glycerol, at three different temperatures, i.e. T = (40°C, 50°C, 60°C). In the time domain (), variation of the temperature manifests itself in both a temporal shift and a change of the wave form, and in the frequency domain (), temperature variations cause a change in the amplitudes of the harmonic components and the phase of the signal (not shown). The applied acoustic medium parameters of glycerol have been obtained from Sehgal et al. Citation[56]. The wave shape that has been emitted at x = 0 m is a Gaussian modulated pulse with amplitude P0 = 1.0 MPa, centre frequency of 1 MHz, time delay , and envelope width
.
Figure 8. Plane acoustic wave at a propagation distance x = 0.1 m in glycerol at temperatures T = 40°C, 50°C, 60°C; (A) temporal results, (B) spectral results, normalised with respect to the fundamental F0.
Non-invasive thermometry based on non-linearity
To demonstrate the performance of our non-invasive thermometry method, we consider a simulated pulsed acoustic plane wave that propagates over a distance of 0.1 m in glycerol. We use glycerol because of its increased tissue-like behaviour in comparison with water, and the fact that the temperature dependence of its acoustic parameters is well known.
First we compute the reference ratios . We employ the known temperature behaviour of the acoustic parameters of glycerol in the solution of the Burgers equation, and compute the acoustic pulses at x = 0.1 m and for different temperatures T. After subjecting these pulses to a Discrete Fourier Transformation (DFT), the maxima Hi of the harmonic frequency bands are determined, and these are used to compute the reference ratios
as a function of temperature.
Next, we simulate a single measurement. The temperature of the glycerol is assumed to be T = 40°C, which is the temperature to be reconstructed. The solution of the Burgers equation is used once more to compute the corresponding acoustic pulse at x = 0.1 m. To mimic measurement circumstances, we add 1% (−40 dB) white noise to the obtained pulse. In we present the time domain data for a single simulated measurement, and in we show the frequency spectrum of this data. The latter plot is obtained by subjecting the simulated measurement data to a discrete Fourier transformation.
Figure 9. Simulated measurement data for a plane acoustic wave in glycerol, as computed with the solution of the Burgers equation and contaminated with 1% white noise; (A) temporal results, (B) spectral results for several different situations.
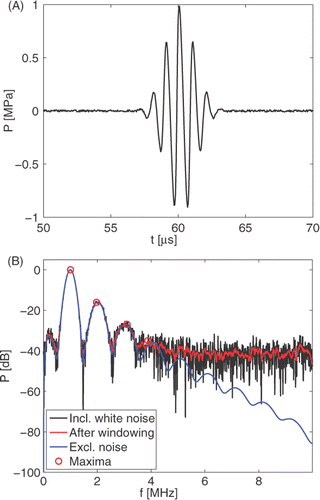
Subsequently, we determine the simulated measured ratios from the maxima of the frequency spectrum. From it may be expected that the spectrum of the simulated measurement is too noisy to yield accurate maxima for the third and higher harmonics. To overcome this problem we first process the spectrum by averaging over a moving window of four spectral points. This gives a considerably smoother spectrum, which is also shown in . This smoothed spectrum is used to determine the maxima of the harmonic frequency bands, and these maxima are applied to determine the steepening measured ratios
.
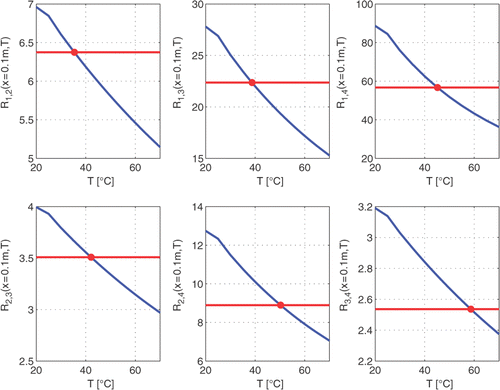
The above comes together in . In this figure, we use blue lines to display the reference ratios involving the fundamental, second, third, and fourth harmonic, i.e. R1,2, R1,3, R2,3, R1,4, R2,4, and R3,4, as a function of temperature. In the same figure, the horizontal red lines indicate the simulated measured ratios
, as obtained from the simulated measurement shown in . By finding the intersection point of the blue and the red lines, we obtain a temperature prediction
based on one ratio.
Figure 10. Comparison of the temperature dependent reference ratios (blue lines) and the measurement ratios
obtained from the simulated measurement data (red lines). The simulated measured ratios are obtained from the single simulated measurement in .
The temperature predictions of different ratios will in general differ due to the noise in the measurement. Unweighted averaging of these predictions provides us with a temperature prediction
based on combined ratios of the single simulated measurement, see . Here we have introduced the notation
, where μ is the mean and σ the standard deviation of the averaged predictions. The results for the predicted temperature
are shown in . These results show that an increase in accuracy is achieved when we use not only R1,2, but also ratios involving the third harmonic component, i.e. R1,3 and R2,3. However, when we also use the ratios involving the fourth harmonic, i.e. R1,4, R2,4 and R3,4, this leads to a worsening of the result. The reason of this is that the fourth harmonic is very small and severely disturbed by the noise, such that even the window averaging over four spectral points results in a very inaccurate location and magnitude of the maximum of the fourth harmonic frequency band. This makes that all measured ratios involving this fourth harmonic are inaccurate, which results in a bad overall result.
Figure 11. Prediction of the temperature from the single simulated measurement in ; (A) employing the fundamental, second and third harmonic, (B) employing the fundamental, second, third and fourth harmonic. The blue dots indicate the temperature obtained from the comparison of the individual simulated measurement and reference ratios. The red stars give the average temperature, and the red lines show the standard deviation.
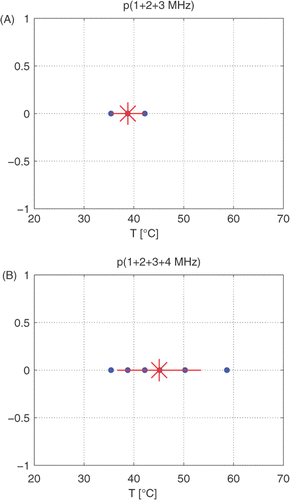
Table II. Predicted temperatures from simulated measurements in glycerol. The temperature to be reconstructed is T = 40°C. In the notation , μ is the mean and σ the standard deviation of the averaged predictions.
In realistic situations, temperature prediction need not be based on a single measurement, but may involve several measurements in fast succession. Hence, we repeat the simulated measurement 16 times and average the obtained temperature predictions. The results of the average temperatures are shown in . Temperature prediction including the ratios involving the fourth harmonic did not succeed due to the adverse effects of the noise in some realisations of the simulated measurement.
Discussion
Non-linear acoustics play an important role in HIFU. The most noticeable effects of non-linear acoustics, as compared to linear acoustics, are an increase in dissipation Citation[57] and a spatial shift of the region with maximum dissipation toward the transducer Citation[58]. Both phenomena are caused by the conversion of a part of the acoustic energy from the fundamental component towards the higher harmonic components, which in most tissues have a higher attenuation rate. An additional effect of the application of HIFU for thermal ablation therapy is the formation of bubbles and cavitation Citation[59]. These bubbles and cavitation may form a barrier for the acoustic wave field where energy may scatter off, and form an additional source of non-linearity that causes an enhanced conversion towards higher harmonics, and in turn, an enhancement of tissue damage and a further shift of the peak of maximum energy deposition Citation[60]. Consequently, the actual location and magnitude of maximum temperature increase may differ significantly from a traditional treatment planning that is based on linear acoustics. On the one hand, the difficulty of making an accurate treatment planning with the traditional linear tools shows the necessity for accurate (and preferably non-invasive) thermometry during treatment. Even when the treatment planning is being based on non-linear acoustics, the restricted knowledge about tissue boundaries and tissue behaviour, and the formation of bubbles and cavitation, will lead to uncertainties that call for thermometry during treatment. On the other hand, as this paper confirms, the acoustic non-linearity parameter B/A is very sensitive to the temperature changes Citation[44], Citation[45], Citation[61] and may be the best choice as a basis for non-invasive thermometry. A practical issue that needs to be overcome is the restricted quantitative knowledge about the temperature dependency of B/A (and other relevant acoustic parameters) for many biological tissues. Another issue that may arise is that the behaviour of a specific type of tissue may vary between individuals or even within one individual. These difficulties may be somewhat relieved by the fact that the temperature before treatment is known, and only the temperature changes need to be monitored. Yet another potential issue is that tissue properties such as B/A may change irreversibly as a result of the treatment. Fortunately, this problem is virtually absent for the relatively low temperature rise that occurs with hyperthermia, which is the therapy that is most dependent on an accurate thermometry. On the other hand, during thermal ablation therapy the formation of regions with ablated tissue, bubbles and cavitation may complicate non-invasive thermometry that is based on (non-linear) acoustics, as in these regions the acoustic medium parameters will change irreversibly and most often significantly. However, with this therapy accurate thermometry is less important than precise localisation of the treatment zone. In view of the latter, irreversible parameter changes might even prove valuable, as they can be used to clearly localise those regions where the temperature increase has had a significant impact.
A characteristic feature of non-linear acoustics is the formation of higher harmonics during the propagation of the acoustic wave field. The ratios of these harmonics depend on the acoustic non-linearity parameter B/A, and are therefore temperature dependent. Our proposed non-invasive thermometry method is based on the various ratios measured in transmission-mode between the fundamental and the higher harmonic components that are present in measured data. If no noise is present, each harmonic ratio will give the same temperature prediction, and the exact temperature may be predicted from a single ratio. In other words, the temperature information provided by the different ratios is redundant. implies that ratios of harmonics that are spectrally further apart are more sensitive to temperature changes. However, in the presence of noise, the maxima of the harmonic frequency bands may deviate from their exact noiseless values. As a result, different ratios will yield different temperature predictions, and the prediction from a single ratio will likely contain some error. By averaging the predictions from a number of ratios, the observed redundancy may be employed to reduce the adverse effect of noise. As long as the applied ratios are related to harmonics that clearly stand out above the noise, this will in general improve the temperature prediction. However, when ratios are used that involve noisy harmonics, the prediction may turn worse. Clearly, there is an optimum in the number of harmonics that should be included in the prediction, and this number depends on the level of the harmonics relative to the noise level.
To investigate the performance of the proposed thermometry method, we have used simulated measurement data for a one-dimensional acoustic wave that propagates in glycerol at T = 40°C. To mimic measurement circumstances, the data was contaminated with 1% (−40 dB) white noise. Although it is difficult to find specific data for the noise in practical ultrasound systems, the applied signal-to-noise ratio (SNR) seems on the small side, and it is expected that many modern ultrasound systems actually have a larger SNR. This implies that our thermometry method might yield more accurate results than demonstrated in this paper.
Predicting the temperature from a single simulated measurement by using the reference and simulated measured ratios involving up to the second harmonic yields a temperature = 35°C, including up to the third harmonic gives
, and including up to the fourth harmonic gives
. The differences between the predicted temperature and the real temperature (biases) are
for the respective cases. In realistic situations, temperature prediction will be based on several measurements. Averaging the predicted temperatures from 16 simulated measurements yields
when only the ratio involving the fundamental and the second harmonic is applied, and
when all ratios involving the fundamental, second harmonic, and third harmonic are applied. Now the differences between the predicted temperature and the real temperature are
for the respective cases. Temperature prediction including the ratios involving the fourth harmonic as well was unsuccessful due to the adverse effects of the noise in some realisations of the simulated measurement. Both the predictions based on a single simulated measurement and on a series of simulated measurements demonstrate that there is an optimum in the number of harmonics that should be taken into account.
The presented method uses only the local maxima of the harmonic frequency bands. This makes the approach rather sensitive to noise in the data, as the results demonstrate, while at the same time it disregards a large amount of data available for free. By better using the information that is present in the noisy frequency spectrum of the measurements Citation[62], the overall accuracy and sensitivity in the presence of noise may be improved.
In a clinical setting, it is very important to achieve spatial selectivity (besides knowing the temperature dependence of the acoustic medium parameters related to the relevant tissues, and having a way to deal with significant scattering and refraction caused by bubbles, cavitation and tissue inhomogeneities). Regarding this aspect, it may be advantageous that HIFU systems are particularly suited to deposit the emitted acoustic energy in a small volume inside the body. As a result, the magnitude of the acoustic wave field, and thus the non-linear effects, inside this volume are significantly larger than outside. This may help to provide the required spatial selectivity for non-invasive thermometry.
Conclusion
In this paper we have confirmed that the acoustic non-linearity parameter B/A is very sensitive to temperature changes and that it may be the best choice as a basis for non-invasive thermometry. Moreover, we have presented a non-invasive thermometry method that is based on the use of B/A. This method predicts the temperature by comparing the harmonic ratios from a measured and a reference non-linear acoustic wave field. To counter the adverse effects of noise, redundancy is applied by averaging the predictions from different ratios of a single measurement, and by averaging the predictions from several measurements. Simulations have been performed with a pulsed acoustic plane wave that propagates over a distance of 0.1 m in glycerol. The results show that by combining 16 simulated measurements, the temperature can be predicted with zero bias and a standard deviation of 2°C if the noise level does not exceed −40 dB.
Acknowledgement
The authors would like to thank Eldert Both from Delft University of Technology for his contribution to this work.
Declaration of interest: The authors report no conflicts of interest. The authors alone are responsible for the content and writing of the paper.
Related Research Data
References
- Overgaard J, Gonzalez Gonzalez D, Hulshof MC, Arcangeli G, Dahl O, Mella O, Bentzen SM. Hyperthermia as an adjuvant to radiation therapy of recurrent or metastatic malignant melanoma. A multicentre randomized trial by the European Society for Hyperthermic Oncology. Int J Hyperthermia 1996; 12: 3–20
- Vernon CC, Hand JW, Field SB, Machin D, Whaley JB, van der Zee J, van Putten WL, van Rhoon GC, van Dijk JD, Gonzalez Gonzalez D, et al. Radiotherapy with or without hyperthermia in the treatment of superficial localized breast cancer: Results from five randomized controlled trials. International Collaborative Hyperthermia Group. Int J Radiat Oncol Biol Phys 1996; 35: 731–744
- Dewhirst MW, Prosnitz L, Thrall D, Prescott D, Clegg S, Charles C, MacFall J, Rosner G, Samulski T, Gillette E, LaRue S. Hyperthermic treatment of malignant diseases: Current status and a view toward the future. Semin Oncol 1997; 24: 616–625
- Myerson RJ, Moros EG, Roti Roti JL. Hyperthermia. Perez and Brady's Principles and Practice of Radiation Oncology, EC Halperin, CA Perez, LW Brady. Wolters Kluwer Health/Lippincott Williams & Wilkins, Philadelphia 2008; 637–683
- Lee HK, Antell AG, Perez CA, Straube WL, Ramachandran G, Myerson RJ, Emami B, Molmenti EP, Buckner A, Lockett MA. Superficial hyperthermia and irradiation for recurrent breast carcinoma of the chest wall: Prognostic factors in 196 tumors. Int J Radiat Oncol Biol Phys 1998; 40: 365–375
- Myerson RJ, Straube WL, Moros EG, Emami BN, Lee HK, Perez CA, Taylor ME. Simultaneous superficial hyperthermia and external radiotherapy: Report of thermal dosimetry and tolerance to treatment. Int J Hyperthermia 1999; 15: 251–266
- van der Zee J, Gonzalez Gonzalez D, van Rhoon GC, van Dijk JD, van Putten WL, Hart AA. Comparison of radiotherapy alone with radiotherapy plus hyperthermia in locally advanced pelvic tumours: A prospective, randomised, multicentre trial. Dutch Deep Hyperthermia Group. Lancet 2000; 355: 1119–1125
- Franckena M, Fatehi D, de Bruijne M, Canters RAM, van Norden Y, Mens JW, van Rhoon GC, van der Zee J. Hyperthermia dose-effect relationship in 420 patients with cervical cancer treated with combined radiotherapy and hyperthermia. Eur J Cancer 2009; 45: 1969–1978
- Issels RD, Lindner LH, Verweij J, Wust P, Reichardt P, Schem BC, Abdel-Rahman S, Daugaard S, Salat C, Wendtner CM, et al. EORTC-STBSG EO, and ESHO, Neo-adjuvant chemotherapy alone or with regional hyperthermia for localised high-risk soft-tissue sarcoma: A randomised phase 3 multicentre study. Lancet Oncol 2010; 11: 561–570
- Lutgens L, van der Zee J, Pijls-Johannesma M, De Haas-Kock DFM, Buijsen J, van Mastrigt GAPG, Lammering G, De Ruysscher DKM, Lambin P. Combined use of hyperthermia and radiation therapy for treating locally advanced cervix carcinoma. Cochrane Database Syst Rev 2010(3)
- Hynynen K, Chung A, Fjield T, Buchanan M, Daum D, Colucci V, Lopath P, Jolesz F. Feasibility of using ultrasound phased arrays for MRI monitored noninvasive surgery. IEEE Trans Ultrason Ferroelectrics Freq Control 1996; 43: 1043–1053
- ter Haar GR. High intensity focused ultrasound for the treatment of tumors. Echocardiography 2001; 18: 317–322
- Sherar MD, Gertner MR, Yue CK, O’Malley ME, Toi A, Gladman AS, Davidson SR, Trachtenberg J. Interstitial microwave thermal therapy for prostate cancer: Method of treatment and results of a phase I/II trial. J Urol 2001; 166: 1707–1714
- McCann C, Kumaradas JC, Gertner MR, Davidson SR, Dolan AM, Sherar MD. Feasibility of salvage interstitial microwave thermal therapy for prostate carcinoma following failed brachytherapy: Studies in a tissue equivalent phantom. Phys Med Biol 2003; 48: 1041–1052
- Tempany CM, Stewart EA, McDannold N, Quade BJ, Jolesz FA, Hynynen K. MR imaging-guided focused ultrasound surgery of uterine leiomyomas: A feasibility study. Radiology 2003; 226: 897–905
- ter Haar G, Coussios C. High intensity focused ultrasound: Past, present and future. Int J Hyperthermia 2007; 23: 85–87
- ter Haar G, Coussios C. High intensity focused ultrasound: Physical principles and devices. Int J Hyperthermia 2007; 23: 89–104
- Stauffer PR, Goldberg SN. Introduction: Thermal ablation therapy. Int J Hyperthermia 2004; 20: 671–677
- Hynynen K, Classic commentary: ‘A scanned, focused, multiple transducer ultrasonic system for localised hyperthermia treatments’, by K. Hynynen, R. Roemer, D. Anhalt, et al., International Journal of Hyperthermia 1987;3:21–35. Int J Hyperthermia 2010;26:12–15
- Hallaj IM, Cleveland RO. FDTD simulation of finite-amplitude pressure and temperature fields for biomedical ultrasound. J Acoust Soc Am 1999; 105: L7–L12
- Beyer RT. Nonlinear Acoustics. Acoustical Society of America, New York 1997
- Hamilton M, Blackstock D. Nonlinear acoustics. Academic Press, San Diego 1998
- Bakker JF, Paulides MM, Obdeijn IM, van Rhoon GC, van Dongen KWA. An ultrasound cylindrical phased array for deep heating in the breast: Theoretical design using heterogeneous models. Phys Med Biol 2009; 54: 3201–3215
- Chen X, Diederich CJ, Wootton JH, Pouliot J, Hsu IC. Optimisation-based thermal treatment planning for catheter-based ultrasound hyperthermia. Int J Hyperthermia 2010; 26: 39–55
- Demi L, Verweij MD, Huijssen J, de Jong N, van Dongen KWA. Attenuation of ultrasound pressure fields described via contrast source formulation. Proc IEEE Int Ultrason Symp 2009; 1590–1593
- Demi L, van Dongen KWA, Verweij MD. A contrast source formulation for nonlinear acoustic wave fields in media with inhomogeneous attenuation. J Acoust Soc Am 2011; 129: 1221–1230
- Huijssen J, Modeling of Nonlinear Medical Diagnostic Ultrasound 2009. Delft: University of Technology
- Huijssen J, Verweij MD. An iterative method for the computation of nonlinear, wide-angle, pulsed acoustic fields of medical diagnostic transducers. J Acoust Soc Am 2010; 127: 33–44
- Huijssen J, Verweij MD, de Jong N. Green's function method for modeling nonlinear three-dimensional pulsed acoustic fields in diagnostic ultrasound including tissue-like attenuation. Proc IEEE Int Ultrason Symp 2008; 375–378
- van Rhoon GC, Wust P. Introduction: Non-invasive thermometry for thermotherapy. Int J Hyperthermia 2005; 21: 489–495
- Arthur RM, Straube WL, Trobaugh JW, Moros EG. Non-invasive estimation of hyperthermia temperatures with ultrasound. Int J Hyperthermia 2005; 21: 589–600
- Franckena M, Canters R, Termorshuizen F, Van Der Zee J, Van Rhoon G. Clinical implementation of hyperthermia treatment planning guided steering: A cross over trial to assess its current contribution to treatment quality. Int J Hyperthermia 2010; 26: 145–157
- Ichida N, Sato T, Linzer M. Imaging the nonlinear ultrasonic parameter of a medium. Ultrason Imag 1983; 5: 295–299
- Ichida N, Sato T, Miwa H, Murakami K. Real-time nonlinear parameter tomography using impulsive pumping waves. IEEE Trans Sonics Ultrasonics 1984; 31: 635–641
- Sato T, Inui S, Ichida N. Noninvasive measurement of temperature distribution changes in tissue using nonlinear parameter tomography. Ultrason Imag 1985; 7: 99–100
- Cain CA. Ultrasonic reflection mode imaging of the nonlinear parameter B/A. 1. A theoretical basis. J Acoust Soc Am 1986; 80: 28–32
- Cain CA, Houshmand H. Ultrasonic reflection mode imaging of the nonlinear parameter B/A. II. Signal processing. J Acoust Soc Am 1989; 86: 28–34
- Ueno S, Hashimoto M, Fukukita H, Yano T. Ultrasound thermometry in hyperthermia. Proc IEE Int Ultrason Symp 1990; 1643: 1645–1652
- Nakagawa Y, Nakagawa M, Yoneyama M, Kikuchi M. Nonlinear parameter imaging computed tomography by parametric acoustic array. Proc IEEE Int Ultrason Symp 1984; 673–676
- Gong XF, Feng R, Zhu CY, Shi T. Ultrasonic investigation of the nonlinearity parameter B/A in biological media. J Acoust Soc Am 1984; 76: 949–950
- Law WK, Frizzell LA, Dunn F. Ultrasonic determination of the nonlinearity parameter B/A for biological media. J Acoust Soc Am 1981; 69: 1210–1212
- Vander Meulen F, Haumesser L. Towards a simple acoustic method to evaluate the nonlinear parameter B/A of fluids. Proc IEEE Int Ultrason Symp 2008; 1908–1911
- Westervelt PJ. Parametric acoustic array. J Acoust Soc Am 1963; 35: 535–537
- Beyer RT. Parameter of nonlinearity in fluids. J Acoust Soc Am 1960; 32: 719–721
- Rudnick I. On the attenuation of finite amplitude waves in a liquid. J Acoust Soc Am 1958; 30: 564–567
- Burgers J. A mathematical model illustrating the theory of turbulence. Adv Appl Mech 1948; 1: 677
- Aanonsen SI, Barkve T, Tjotta JN, Tjotta S. Distortion and harmonic generation in the nearfield of a finite amplitude sound beam. J Acoust Soc Am 1984; 75: 749–768
- van Dongen KWA, Wright WMD. A full vectorial contrast source inversion scheme for three-dimensional acoustic imaging of both compressibility and density profiles. J Acoust Soc Am 2007; 121: 1538–1549
- Lide DR, CRC Handbook of Chemistry and Physics, 1998–1999. 79 ed. Boca Raton: CRC Press, 1998
- Spickler P, Abdel-Raziq I, Yun S, Stumpf FB. Velocity and absorption of ultrasound in binary solutions of polyvinylpyrrolidone and water. J Acoust Soc Am 1989; 85: 1363–1364
- Wilson WD. Speed of sound in distilled water as a function of temperature and pressure. J Acoust Soc Am 1959; 31: 1067–1072
- Belogol'skii VA, Sekoyan SS, Samorukova LM, Stefanov SR, Levtsov VI. Pressure dependence of the sound velocity in distilled water. Measurement Techniques 1999; 42: 406–413
- Bilaniuk N, Wong GSK. Erratum: Speed of sound in pure water as a function of temperature [J Acoust Soc Am 1993;93:1609–1612]. J Acoust Soc Am 1996; 99: 3257
- Hagelberg MP, Holton G, Kao S. Calculation of B/A for water from measurements of ultrasonic velocity versus temperature and pressure to 10 000 kg/cm2. J Acoust Soc Am 1967; 41: 564–567
- Holton G. Ultrasonic propagation in liquids under high pressures – Velocity measurements on water. J Appl Physics 1951; 22: 1407–1413
- Sehgal CM, Bahn RC, Greenleaf JF. Measurement of the acoustic nonlinearity parameter B/A in human tissues by a thermodynamic method. J Acoust Soc Am 1984; 76: 1023–1029
- Goss SA, Fry FJ. Non-linear acoustic behavior in focused ultrasonic fields – Observations of intensity dependent absorption in biological tissue. IEEE Transactions on Sonics and Ultrasonics 1981; 28: 21–26
- Watkin NA, ter Haar GR, Rivens I. The intensity dependence of the site of maximal energy deposition in focused ultrasound surgery. Ultrasound Med Biol 1996; 22: 483–491
- ter Haar GR, Daniels S. Evidence for ultrasonically induced cavitation in vivo. Phys Med Biol 1981; 26: 1145–1149
- Meaney PM, Cahill MD, ter Haar GR. The intensity dependence of lesion position shift during focused ultrasound surgery. Ultrasound Med Biol 2000; 26: 441–450
- Van Dongen KWA, Verweij MD. Sensitivity study of the acoustic nonlinearity parameter for measuring temperatures during high intensity focused ultrasound treatment. Proceedings, Acoustics 08 Paris, 2008:2615–2620.
- Kameyama K, Inoue T, Demin IY, Kobayashi K, Sato T. Acoustical tissue nonlinearity characterization using bispectral analysis. Signal Processing 1996; 53: 117–131