Abstract
Purpose: To study the relationship between roll-off (sudden increase in impedance) and spatial distribution of dehydrated tissue during RF ablation using a cooled electrode (temperatures around 100°C).
Methods: We used a double approach: (1) theoretical modelling based on the finite element method, and (2) 20 ablations using an experimental study on ex vivo excised bovine liver in which we measured impedance progress and temperature at three points close to the electrode surface: 0.5 (T1), 1.5 (T2) and 2.5 (T3) mm from the tip. T2 was located exactly at the centre of the 30 mm long electrode.
Results: Temperatures at T1 and T3 quickly rose to 100°C (at ≈20 and 40 s, respectively), while at the rise at T2 was somewhat slower, stabilized around 50 s and reached a maximum value of 99°C at about 60 s. Impedance reached a minimum of 65 Ω (plateau), began increasing at 50 s and continued rising throughout the procedure, reaching a value equal to the initial value at 70 s. Likewise, computed impedance dropped to ≈73 Ω (plateau), began increasing at 50 s and reached an impedance value equal to the initial value at ≈78 s, which approximately coincided with the time when the entire zone surrounding the electrode was within the 100°C isotherm.
Conclusion: There is a close relationship between the moment at which roll-off occurs and the time when the entire electrode is completely encircled by the dehydrated tissue. The mid-electrode zone is the last in which tissue desiccation occurs.
Introduction
Radiofrequency (RF) ablation (RFA) is a minimally invasive ablative technique that allows the treatment of tumours Citation1, Citation2. It uses RF current (≈500 kHz) to produce a coagulation zone characterised by a thermal lesion which destroys the tissue by a necrosis process. The coagulation zone is defined as that zone including irreversibly damaged tissue, i.e. with temperatures above 50°C Citation3. The electrical current is delivered to the tissue through a small active electrode placed in the centre of the tumour and a large dispersive electrode located on the patient's back. One of the most widely used electrodes is the cooled electrode Citation4, Citation5, which consists of a single metal needle typically 30 mm long, inside which cooled water (5–10°C) is circulated by means of a hydraulic circuit. This cooling prevents tissue on the electrode surface becoming totally dehydrated and therefore charred Citation6. A special feature is that it shifts the most highly desiccated zone 1–2 mm away from the electrode surface. During the operation it is usual to observe a sudden increase in the electrical impedance measured between the active and dispersive electrodes, with a consequent drop in electrical power. This phenomenon is known as roll-off and has been traditionally associated with the high temperatures (≈100°C), vaporization phenomenon and hence dehydration of the tissue. Standard operation with a cooled electrode uses a constant impedance mode for delivering RF power, which is based on a pulsed protocol: roll-off causes the cessation of the RF pulse, which returns after a short pause. Roll-off impedes the lesion growing, and makes longer the treatment. It would be important to know more about the phenomena associated with roll-off in order to minimise its appearance and achieve larger thermal lesions in less time.
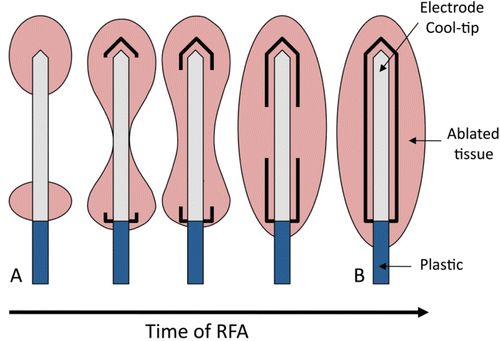
It has been reported that the addition of hypertonic saline perfusion at 2 mm from the electrode surface improves the performance of the cooled electrode by increasing the volume of the coagulation zone obtained from the cooled electrode only Citation7, Citation8. This improvement is also associated with a delay in the emergence of roll-off Citation9. We think that the possible physical explanation of these results is that the infused saline impedes the dehydration of the zone of tissue responsible for roll-off. As far as we know, pronounced dehydration and vaporization processes occur at tissue temperatures around 100°C Citation3. The resulting loss of water content consequently involves an abrupt drop in electrical conductivity (σ). Since the σ value at different points on the tissue determines total impedance, this could indicate a relationship between the zones reaching 100°C (dehydrated tissue) and the evolution of impedance. It is now known that the coagulation zone begins in the tissue close to the electrode, i.e. at the tip and the proximal edge (see ). This is due to the edge effect, i.e. the electrical power (specific absorption rate, W/m3) is mainly deposited in these zones Citation10. In addition, in the first few seconds tissue temperature can reach up to 100°C in these zones, which is associated with the gas bubbles observed by means of ultrasound guidance Citation11. From computer modelling studies Citation10 we know that the coagulation zone is then enlarged by thermal conduction, in particular around the central electrode zone. It is therefore reasonable to conclude that the highly desiccated tissue zone (≈100°C) also extends in the same direction (see ). Although many theoretical Citation10, Citation12, Citation13 and experimental Citation12–14 studies have assessed the thermal performance of the cooled electrode, the exact relationship between spatial–temporal distribution of the dehydrated tissue and the occurrence of roll-off has yet to be characterized in detail. In this respect, we hypothesised that the roll-off episode coincides approximately with the time when the tissue around the centre of the active electrode becomes highly desiccated (around 100°C), i.e. when the entire electrode is completely encircled by the dehydrated tissue. Our aim was to demonstrate this hypothesis by means of a double theoretical modelling and experimental approach.
Figure 1. Schematic diagram of the progress of the coagulation zone in the tissue during radiofrequency ablation. At the beginning, the coagulated tissue is mainly located at the edges (distal and proximal), while at the end of heating the coagulated lesion has broadly extended and forms an ellipsoidal shape with the longest axis being the electrode axis. The bold lines represent the tissue heated over 100°C, i.e. strongly dehydrated zones.
Methods
Experimental study
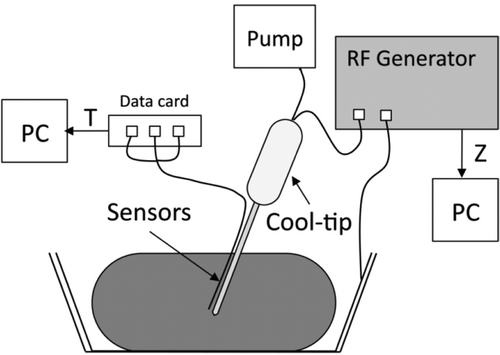
The experimental study was conducted on ex vivo tissue. A piece of fresh bovine liver (3.5 kg) was positioned in a 600 cm2 container on a dispersive electrode (aluminium foil). A 3-cm long Cool-tip (Covidien, Boulder, CO, USA) was used connected to a CC-1 RF generator (Radionics, Burlington, MA, USA). Three lengthwise points were chosen close to the electrode surface to measure temperature evolution: 0.5, 1.5 and 2.5 mm from the tip (T1, T2 and T3 in , respectively). T2 coincided exactly with the centre of the electrode, so that a custom-made multi-thermocouple Series T-type probe (Physitemp Instruments, Crifton, NY, USA) was employed. It consisted of three ultra-fine thermocouples embedded in a flexible Teflon-coated probe of 17-gauge diameter. We used a narrow gauge (<1 mm) nylon thread to tie the multi-thermocouples probe to the electrode. This knot was located away from the electrode tip to avoid it influencing the heating process (see ). Thermocouple temperatures were recorded by a custom-made data acquisition card, Thermes USB-RF (Physitemp Instruments, Crifton, NY, USA), and acquired by DASYLab software 9.0 (Measurement Computing, Norton, MA, USA). Tissue impedance was monitored by a separate data acquisition system and processed by Agilent VEE software (Agilent Technologies, Santa Clara, CA, USA). The sampling frequency used in both systems was 10 Hz. Temperature and impedance were recorded up to the first roll-off. shows the experimental set-up. The peristaltic pump model 323 by Watson-Marlow (Wilmington, MA, USA) was used for internal cooling of the electrode with cooled water (5°C) at a rate of 45 mL/min. Twenty-four ablations were conducted at a constant voltage of 80 V. The experiments were conducted at room temperature (26°C).
Figure 2. Placement of the multi-thermocouple probe tied to the electrode. T1, T2 and T3 are the locations of the thermocouples (dimensions in mm).
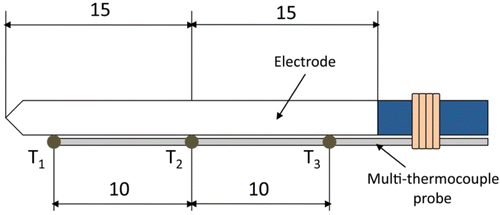
Figure 3. Experimental set-up to record temperatures and impedance evolution. The multi-thermocouple probe and electrode were jointly inserted into the tissue. The electrode was internally cooled by a peristaltic pump.
Theoretical model
The theoretical model was based on a coupled electric thermal problem and was solved numerically using the FEM by means of COMSOL Multiphysics software (COMSOL Inc., Burlington, MA, USA). The geometry and dimensions of the theoretical model are shown in . The problem presented axial symmetry and a two-dimensional analysis could be conducted. The model included three different materials: plastic partially covering the electrode, metallic electrode, and hepatic tissue. The values of the characteristics of these materials are shown in Citation15, Citation16. We considered temperature-dependent functions for the electrical and thermal conductivity Citation17 (see ). For the thermal conductivity (k) we considered linear growth of 0.0015/°C up to 100°C, after which k was kept constant Citation18. The electrical conductivity (σ) grew exponentially +1.5%/°C up to 100°C Citation19, between 99° and 100°C was kept constant and then σ decreased linearly four orders for 5° (i.e. up to 105°C) Citation13, Citation18. The governing equation for the thermal problem is the bioheat Citationequation 17:where T is temperature, t is time, ρ is density, c is specific heat, k is thermal conductivity, q is heat source produced by RF power, Qp is heat loss from blood perfusion and Qm is metabolic heat generation. The term Qm was not considered since this effect is insignificant in the RFA. The blood perfusion term Qp was not considered since the theoretical results were later compared to the experimental results obtained from an ex vivo model. The heat source q (Joule losses) is given by q = JE, where J is current density and E is electric field strength. Both were obtained from the electrical problem, which used the Laplace equation as governing equation ▿2V = 0, where V is the voltage. The electric field was calculated by means of E = −▿V and J using Ohm's law (J = σE). We used a quasi-static approach, i.e. the tissues were considered as purely resistive Citation17, due to the value of the frequencies used in RF (≈500 kHz) and for the geometric area of interest (electrical power is deposited in a very small zone close to the electrode). Tissue vaporization was considered in the case of the hepatic tissue and we varied the formulation proposed in Equation 1 according to the enthalpy method Citation18. The product density × specific heat of the liver at the gas phase was 798 × 103 J/K m3 Citation16. The latent heat was 1.54 × 10⁶ J/kg, which corresponds to a water fraction of 68% inside the liver tissue. The liver density in the change of phase was 179 kg/m3.
Figure 4. Geometry of the two-dimensional theoretical model (out of scale, and dimensions in mm). The domain is divided into three zones: plastic portion of the electrode, metallic electrode, and hepatic tissue.
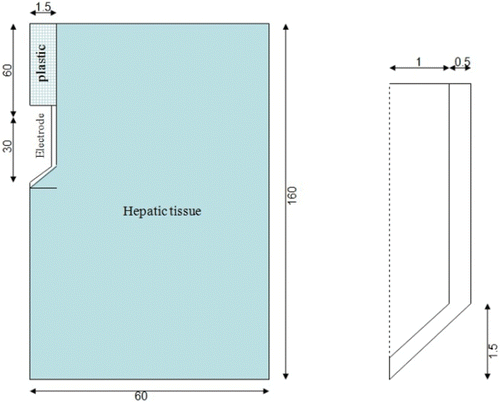
Figure 5. Change in the tissue thermal and electrical conductivity with temperature.
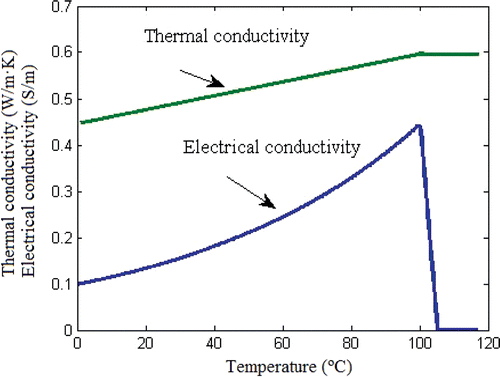
Table I. Characteristics of the materials used in the model Citation14, Citation15.
The electrical boundary conditions were zero current density in the transversal direction to the symmetry axis and inside the electrode. The dispersive electrode was modelled as an electrical condition on boundaries far from the active electrode. Zero voltage was set in the dispersive electrode. A voltage value of 80 V (identical to that used in the experiments) was applied in the active electrode. The thermal boundary conditions were: Null thermal flux in the transversal direction to the symmetry axis and constant temperature of 17°C in the dispersive electrode. Initial temperature of the tissue was considered to be 17°C. These two values were chosen as identical to those measured in the experiments. The circulating liquid inside the electrode produced a cooling effect modelled by means of a thermal convection coefficient h with a value of 3366 W/m2 K and a coolant temperature of 10°C. The value of h was calculated by considering a length of 30 mm and a flow rate of 45 mL/min through an area of 1.57 × 10⁶ m2, which is equivalent to half of the cross section of the inner diameter of the electrode (see ).
Results
Experimental results
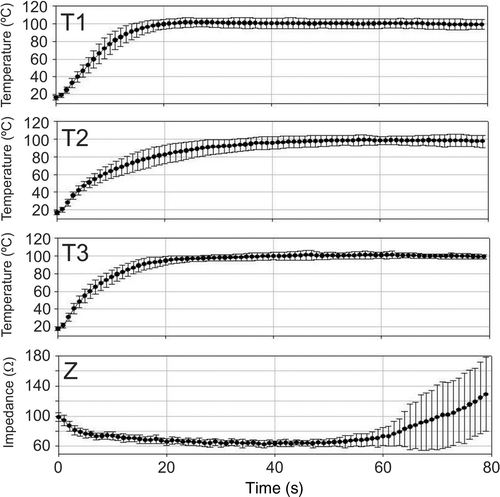
Initial temperature was 16.9° ± 2.0°C (mean of T1, T2 and T3), and initial impedance was 98.8 ± 5.6 Ω. shows mean temperature progress recorded at T1, T2 and T3, along with mean impedance evolution for the 20 ablations. We observed that temperatures at T1 and T3 increased quickly up to 100°C (≈20 and 40 s, respectively), i.e. these zones of tissue became dehydrated, in spite of which impedance continued decreasing. On the other hand, the temperature at T2 increased more slowly, became approximately steady around 50 s and reached a maximum value of 99°C at about 60 s. Impedance reached a minimum of 65 Ω (plateau) around 40 s, began increasing at 50 s and continued rising throughout the procedure, reaching a value equal to the initial value at 70 s. shows mean values and standard deviations of T1, T2, T3 and impedance.
Figure 6. Results from ex vivo experiments and theoretical model. Mean temperature evolution of the sensors placed in the tissue surrounding the surface of the electrode tip: T1, T2 and T3 were the thermocouples placed at 0.5, 1.5 and 2.5 mm, respectively, from the electrode tip. Mean progress of the impedance (Z exp). Impedance progress computed from the theoretical model (Z theor). Note that the impedance began increasing when temperature at the middle of the electrode (T2) became approximately steady at around 50 s.
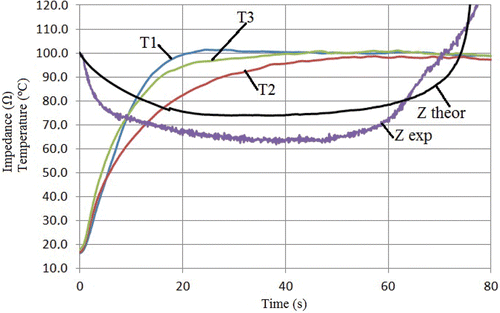
Figure 7. Results from ex vivo experiments. Progress of the impedance (Z) and temperature evolution of the sensors placed in the tissue surrounding the surface of the electrode tip: T1, T2 and T3 were the thermocouples placed at 0.5, 1.5 and 2.5 mm, respectively, from the electrode tip. Dots are mean values and error bars are standard deviations.
Theoretical modelling results
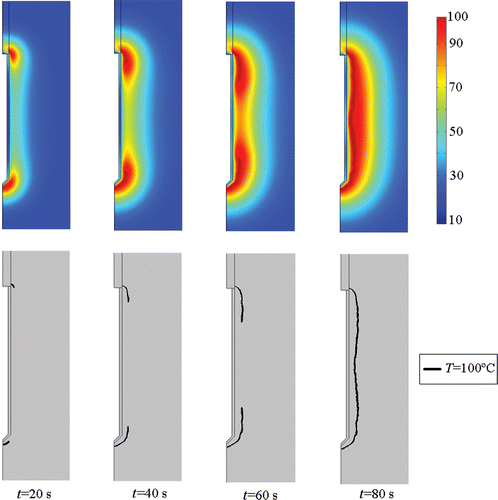
The theoretical results were obtained with the double aim of showing the validity of our hypothesis from a theoretical point of view and to compare them with the experimental results. shows the evolution of the theoretical impedance measured between the active (cooled) electrode and dispersive electrode. shows the theoretical temperature distributions in the tissue around the electrode (above) and the progress of the 100°C isotherm in the same zone (below) at four specific times. We observed that, as in the experimental study, impedance was initially ≈100 Ω, dropped to ≈73 Ω (plateau), began increasing at 50 s and reached an impedance value equal to the initial value at ≈78 s, which approximately coincided with the time when the 100°C isotherm completely surrounded the electrode (see ).
Figure 8. Temperature distributions computed from the theoretical model (top, scale in °C) and progress of the 100°C isotherm in the tissue (bottom). Note that the 100°C isotherm completely encloses the electrode at ≈80 s.
Discussion
The aim of this study was to demonstrate that the appearance of the roll-off is closely associated with the time when the tissue in the electrode middle zone reaches temperatures ≈100°C, i.e. when dehydrated tissue completely surrounds the electrode. There are different ways of defining roll-off, from the time when impedance begins increasing to when it exceeds the initial value by 30 Ω. In this context, we considered roll-off as the phenomenon when impedance starts to rise after remaining more or less constant (plateau). We therefore employed this criterion and focused on the time relation between the occurrence of roll-off and the spatial distribution of the severely desiccated tissue, i.e. reaching temperatures ≈100°C. This was done by means of a double approach: theoretical modelling and experiments.
Even though the results from the two approaches are slightly different, they both suggest that the hypothesis could be true. The experimental results showed that impedance began increasing when temperature in the mid-electrode zone (T2) attained a more or less steady value (i.e. at 50 s). The theoretical results showed that impedance began increasing at 50 s, the experimental temperature then reached a maximum value of 99°C around 60 s and impedance reached a value equal to the initial value at 70 s. Likewise, the impedance computed from the theoretical results reached a value equal to the initial value at ≈78 s, which approximately coincided with the time when the electrode was entirely within the 100°C isotherm.
The theoretical model used here to check the hypothesis considered the sudden drop in tissue electrical conductivity and latent heat, as used by Haemmerich Citation10, including tissue vaporisation by the enthalpy method. This author also conducted an ex vivo experiment in order to validate his theoretical model by measuring temperatures and impedance at distances of 10, 15 and 20 mm from the middle zone of a cooled electrode. As these distances are too far from the points where tissue reaches ≈100°C, no information about the relationship between roll-off and 100°C isotherm zones could be obtained from his study. In our study we focused on this zone, and for this reason we used an ultra-fine custom-made multi-thermocouple probe, which allowed us to measure the temperature at three different locations close to the electrode surface along its longitudinal axis. With this set-up our experimental results also allowed us to confirm the hypothesis.
This study also had other limitations. Although the temperature sensors were very thin, they could possibly have altered the true temperature distributions during the experiments and, from an electrical point of view, they could have modified the true conditions. To check this possible effect, we conducted five measurements of impedance in the hepatic tissue with the electrode alone, i.e. without the multi-thermocouples probe. The initial impedance measured with this set-up was 98.2 ± 4.2 Ω, without any significant differences (p > 0.05) with the combined electrode and multi-thermocouples probe (98.8 ± 5.6 Ω). This suggests that the presence of the multi-thermocouple probe next to the electrode does not significantly perturb RF heating from an electrical point of view. However, the difference between the precise position of the temperature sensor (T2) in the experimental study and the location of the 100°C isotherm in the theoretical model, and the possible self-heating of the thermocouples, could have caused the small differences found between the theoretical and experimental studies.
Both the experimental and theoretical findings suggest that the instant when roll-off occurs (when impedance starts to increase) is closely related to the time when dehydrated tissue reaches the middle zone of the electrode, i.e. when the area close to the electrode reaches a temperature around 100°C. This conclusion could provide an explanation for the previous experimental results obtained with a hybrid applicator based on a Cool-tip electrode combined with a low-rate interstitial infusion of hypertonic saline at 2 mm from the electrode surface and exactly in the middle zone Citation7. To be more precise, the saline infusion at that point could significantly delay roll-off, which could be due to the saline impeding severe tissue desiccation at this point.
Declaration of interest: This work received financial support from the Spanish Plan Nacional de I+D+I del Ministerio de Ciencia e Innovación, grant no. TEC2008-01369/TEC and FEDER Project MTM2010-14909. The translation of this paper was funded by the Universitat Politècnica de València, Spain. The authors alone are responsible for the content and writing of the paper.
Related Research Data
References
- Poon RT, Fan ST, Tsang FH, Wong J. Locoregional therapies for hepatocellular carcinoma: A critical review from the surgeon's perspective. Ann Surg 2002; 235: 466–486
- Solbiati L, Livraghi T, Goldberg SN, Ierace T, Meloni F, Dellanoce M, et al. Percutaneous radio-frequency ablation of hepatic metastases from colorectal cancer: Long-term results in 117 patients. Radiology 2001; 221: 159–166
- Ahmed M, Brace CL, Lee FT, Jr, Goldberg SN. Principles of and advances in percutaneous ablation. Radiology 2011; 258: 351–369
- Goldberg SN, Grassi CJ, Cardella JF, Charboneau JW, Dodd III GD, Dupuy DE, et al. Society of Interventional Radiology Technology Assessment Committee; International Working Group on Image-Guided Tumor Ablation. Image-guided tumor ablation: Standardization of terminology and reporting criteria. Radiology 2005; 235: 728–739
- Pereira PL, Trübenbach J, Schenk M, Subke J, Kroeber S, Shaefer I, et al. Radiofrequency ablation: In vivo comparison of four commercially available devices in pig livers. Radiology 2004; 232: 482–490
- Li X, Zhang L, Fan W, Zhao M, Wang L, Tang T, et al. Comparison of microwave ablation and multipolar radiofrequency ablation, both using a pair of internally cooled interstitial applicators: Results in ex vivo porcine livers. Int J Hyperthermia 2011; 27: 240–248
- Burdío F, Tobajas P, Quesada-Diez R, Berjano E, Navarro A, Poves I, et al. Distant infusion of saline may enlarge coagulation volume during radiofrequency ablation of liver tissue using Cool-tip electrodes without impairing predictability. Am J Roentgenol 2011; 196: W837–843
- Burdío F, Navarro A, Berjano EJ, Burdío JM, Gonzalez A, Güemes A, et al. Radiofrequency hepatic ablation with internally cooled electrodes and hybrid applicators with distant saline infusion using an in vivo porcine model. Eur J Surgical Oncology 2008; 34: 822–830
- Burdío F, Berjano EJ, Navarro A, Burdío JM, Güemes A, Grande L, et al. RF tumor ablation with internally cooled electrodes and saline infusion: What is the optimal location of the saline infusion?. Biomed Eng Online 2007; 6: 30
- Haemmerich D, Mathematical modeling of impedance controlled radiofrequency tumor ablation and ex-vivo validation. Buenos Aires, Argentina: Proceedings of the 32nd Annual International Conference of the IEEE EMBS, 2010, pp. 1605–1608
- Arata MA, Nisenbaum HL, Clark TW, Soulen MC. Percutaneous radiofrequency ablation of liver tumors with the LeVeen probe: Is roll-off predictive of response?. J Vasc Interv Radiol 2001; 12: 455–458
- Quaranta V, Manenti G, Bolacchi F, Cossu E, Pistolese CA, Buonomo OC, et al. FEM analysis of RF breast ablation: Multiprobe versus Cool-tip electrode. Anticancer Research 2007; 27: 775–784
- Haemmerich D, Chachati L, Wright AS, Mahvi DM, Lee FT, Jr, Webster JG. Hepatic radiofrequency ablation with internally cooled probes: Effect of coolant temperature on lesion size. IEEE Trans Biomed Eng 2003; 50: 493–500
- McGahan JP, Loh S, Boschini FJ, Paoli EE, Brock JM, Monsky WL, et al. Maximizing parameters for tissue ablation by using an internally cooled electrode. Radiology 2010; 256: 397–405
- Berjano EJ, Burdío F, Navarro AC, Burdío JM, Güemes A, Aldana O, et al. Improved perfusion system for bipolar radiofrequency ablation of liver. Physiol Meas 2006; 27: 55–66
- Pätz T, Körger T, Preusser T. Simulation of radiofrequency ablation including water evaporation. IFMBE Proceedings 2009; 25: 1287–1290
- Berjano EJ. Theoretical modeling for radiofrequency ablation: State of-the-art and challenges for the future. Biomed Eng Online 2006; 5: 24
- Byeongman J, Aksan A. Prediction of the extent of thermal damage in the cornea during conductive thermokeratoplasty. J Therm Biol 2010; 35: 167–174
- Pearce J, Panescu D, Thomsen S. Simulation of dioptre changes in radio frequency conductive keratoplasty in the cornea. WIT Trans Biomed Health 2005; 8: 469–477
- Abraham JP, Sparrow EM. A thermal-ablation bioheat model including liquid-to-vapor phase change, pressure- and necrosis-dependent perfusion, and moisture-dependent properties. Int J Heat Mass Tran 2007; 50: 2537–2544