Abstract
Background and purpose: In Rotterdam, patient-specific hyperthermia (HT) treatment planning (HTP) is applied for all deep head and neck (H&N) HT treatments. In this paper we introduce VEDO (the Visualisation Tool for Electromagnetic Dosimetry and Optimisation), the software tool required, and demonstrate its value for HTP-guided online complaint-adaptive (CA) steering based on specific absorption rate (SAR) optimisation during a H&N HT treatment.
Materials and methods: VEDO integrates CA steering, visualisation of the SAR patterns and mean tumour SAR (SARtarget) optimisation in a single screen. The pre-calculated electromagnetic fields are loaded into VEDO. During treatment, VEDO shows the SAR pattern, overlaid on the patients’ CT-scan, corresponding to the actually applied power settings and it can (re-)optimise the SAR pattern to minimise SAR at regions where the patient senses discomfort while maintaining a high SARtarget.
Results: The potential of the quantitative SAR steering approach using VEDO is demonstrated by analysis of the first treatment in which VEDO was used for two patients using the HYPERcollar.
These cases show that VEDO allows response to power-related complaints of the patient and to quantify the change in absolute SAR: increasing either SARtarget from 96 to 178 W/kg (case 1); or show that the first SAR distribution was already optimum (case 2).
Conclusion: This analysis shows that VEDO facilitates a quantitative treatment strategy allowing standardised application of HT by technicians of different HT centres, which will potentially lead to improved treatment quality and the possibility of tracking the effectiveness of different treatment strategies.
Introduction
The Erasmus MC is interested in applying combined radiotherapy (RT) and hyperthermia (HT) in the treatment of advanced head and neck (H&N) tumours. Reasons for this are two-fold. First, treatment outcome for advanced recurrent H&N tumours in previously irradiated locations is poor. Ample evidence exists that addition of HT to RT substantially improves clinical outcome without increasing late toxicity. The study by Valdagni et al. [Citation1,Citation2] was the first phase III evidence demonstrating that adding HT to radiation significantly increases local control and survival in patients with H&N cancer. Recently, two additional phase III trials confirmed the potential of HT to RT in H&N tumours. Hua et al. [Citation3] showed an increase of 5-year progression-free survival from 63% to 73% in patients with advanced nasopharyngeal tumours treated by chemoradiation with or without HT (n = 180). Huilgol et al. [Citation4] showed in a smaller study (n = 56) involving advanced H&N cancer (>80% stage T3 and T4, oropharynx and hypopharynx), a significant increase of the complete response (CR) rate for the combined treatment group, i.e. CR = 42% for chemoradiation versus CR = 78% for chemoradiation plus HT.
Secondly, good clinical results after multi-modality treatment of primary H&N cancer (surgery plus chemoradiation) are accompanied by substantial side effects, often compromising social contacts of the patient and thus decreasing quality of life [Citation5,Citation6]. HT has the reputation that it does not contribute to the late side effects of radiation [Citation1,Citation3,Citation4,Citation7,Citation8]. Hence, the addition of HT to existing treatment protocols may offer relevant opportunities for new strategies focused at limiting late side effects by reducing the RT and chemotherapy dose, while keeping the biological equivalent dose constant. The effect of these strategies might even be further enhanced by the use of poly adenosine diphosphate ribose-polymerase (PARP) inhibitors [Citation9]. However, clinical studies demonstrated that clinical outcome is strongly related to the quality of the HT, either expressed in temperature or in specific absorption rate (SAR) [Citation10–13]. An important factor limiting current H&N HT quality is the induction of SAR-related hot spots.
HT of tumours located centrally in the H&N in general requires the use of phased array applicators, such as the HYPERcollar [Citation14]. Such complex equipment – the HYPERcollar has 12 antennas and hence 23 degrees of freedom – cannot be controlled intuitively for HT treatment, i.e. following the historically applied subjective SAR steering based on empirical knowledge and experience. Instead, these phased array applicators require more objective-based information and guidance to control the energy deposition pattern [Citation15–17]. Patient-specific hyperthermia treatment planning (HTP) provides the tool for objective and quantified steering that is required for phased array applicators [Citation18].
In this work we will present the first results of a novel tool, VEDO (“I see” in Italian) – the Visualisation Tool for Electromagnetic Dosimetry and Optimisation. The lay-out of the paper is such that the ‘Materials and methods’ section first describes the equipment and HTP-platform used for pre-treatment planning. The HTP-platform includes the tissue segmentation and calculation of the EM field for each antenna. Throughout this paper, SAR-based HTP was used. The VEDO graphical user interface and the complaint-adaptive (CA) steering strategy are described in a separate section. Finally, we report the details of two cases to demonstrate the value of VEDO and CA steering for H&N HT.
Materials and methods
The HYPERcollar
The HYPERcollar is a ring-shaped phased array HT applicator that consists of twelve antennas uniformly divided over two rings of six antennas each. The amplitudes and phases of the signals applied at all 12 antennas are independently controlled. The applied signals are always based on the power and phase delays prescribed by HTP. A doughnut-shaped bag, the so-called water bolus, is used to fill the space between the HYPERcollar ring and patient with water. The water enhances the efficiency of the energy coupling into the patient and cools the skin. The head is supported by an exact copy of the radiotherapy headrest to reproduce the patients’ RT computed tomography (CT) position, on which the HTP is based. In this way, only one CT-scan is needed. A more detailed description of the HYPERcollar can be found in Paulides et al. [Citation14].
HTP
The whole HTP procedure is as follows, see also .
Figure 1. H&N HTP workflow.
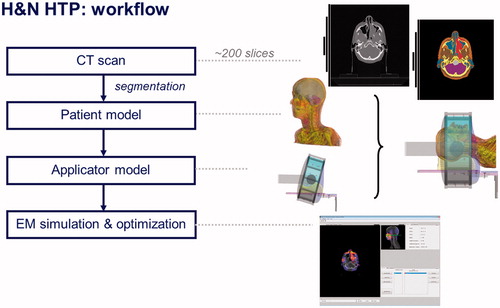
3D model
Firstly, a radiotherapy computerised tomography (RT CT) scan of the patient is made using immobilisation devices such as mask and headrest. Secondly, during HT the patient posture is copied as in the RT CT scan in order to use the RT CT scan for HT. This approach improves the integration of HT in the RT-process, e.g. the RT clinical target volume (CTV) can be taken over directly. The CT-scan encompasses the whole head and part of the shoulders: from the top of the head till 5 cm under the jugulum. Thirdly, all CT slices are segmented in contours of different tissues types and the contours are combined to acquire a patient-specific 3D model. The internal air, bone, fat, muscle, tumour, spinal cord, brain, cartilage and lung regions are segmented semi-automatically, i.e. the automatically generated anatomy is manually adapted. Segmenting white matter regions on CT-scans is not possible so the total brain is segmented as one structure. The CTV as delineated by the radiation oncologist in the RT planning platform is imported as the target region in the final 3D-model used for HT treatment modelling.
HTP-platform
For each patient, SAR-based HTP is used to compute an initial patient-specific SAR pattern for the HT treatment. The HTP platform [Citation19] consists of iSEG (an image segmentation tool, http://www.zurichmedtech.com/products/sim4life/iseg/) to import the CT data, perform tissue segmentation and export the segmented patient anatomy to the electromagnetic (EM) computation software SEMCAD X. The SEMCAD X EM simulation platform (www.semcad.com) uses the finite-difference time-domain (FDTD) scheme to resolve the EM field distribution. The electric field distribution obtained using the EM modelling and all relevant tissue parameters are exported using a custom-made MATLAB-based tool. The latter step re-grids all data to voxels of 5 × 5 × 5 mm3 and thereby reduces the amount of data from around 2.3 × 10⁶ to around 1.7 × 10⁵ voxels for the patient model, which is essential to keep the required time for (re-)optimisation acceptable (<30 s), to accelerate the statistics and screen update, and to avoid memory issues. Next, electric fields data and the RT CT scan are imported in to VEDO for optimisation prior to and during treatment. Visualisation of the optimised SAR distribution is possible by displaying the data as a colour wash overlaid on the CT image. The initial SAR optimisation results are used to check whether the inclusion criteria are met and whether interstitial thermometry is required or desired (see ‘Inclusion Criteria’ and ‘Thermometry’ in the Materials and methods section, respectively). When the inclusion criteria are met, treatment is performed using VEDO as a tool to reduce the SAR in areas where the patient senses a power-related high temperature, following our input radiofrequency (RF) power application protocol.
EM computations
The patient-specific 3D model is positioned in the HYPERcollar applicator model such that it represents the true HT treatment set-up as closely as possible. The complex electrical field distribution is computed by the FDTD scheme for each individual antenna of the applicator by applying a standardised signal (1 V, zero phase) of the HYPERcollar’s operating frequency, i.e. a 1-V sinusoidal signal of 434 MHz with zero phase delay between all channels. A ramp function is used to prevent initial transients. A graded grid is applied and the antenna structures are voxelled using a minimum voxel size of 0.3 mm and a maximum voxel size of 1 mm, whereas the grid around the CTV – in the patient and water bolus – is voxelled between 0.3 mm and 3 mm. Far outside the CTV region the voxel size is larger (maximum 5 mm) to control the amount of voxels (<14 million cells). Simulation time is 15 periods of the sinusoidal input signal, after which steady state is obtained, which was verified by comparing the results obtained using 50 periods. EM simulation time per antenna was around 32 min using a graphics processing unit (GPU) acceleration on an NVIDIA® Tesla® C2070 card.
EM-field, density and electrical conductivity import
The complex electrical field distributions of each individual antenna computed in the previous step along with the density and electrical conductivity of each voxel are imported into VEDO by a custom-made MATLAB tool (called SC2M) and interpolated – using a nearest interpolation – to obtain voxels of 5 × 5 × 5 mm3. As explained before, re-gridding the EM-field to a coarser grid is required for fast online SAR optimisation and visualisation. The resulting data is stored in a single MATLAB data file.
VEDO
VEDO serves three purposes.
It visualises the patient-specific SAR distribution (absolute or relative) as an overlay on the patient’s anatomy with the purpose to objectively inform physicians about the estimated HT quality.
It prevents the SAR dose in critical tissues exceeding our safety thresholds, i.e. 60 W/kg in the spinal cord (see also the section Output parameters of the optimisation process below).
It performs online (re-)optimisation at the start of the treatment, after a patient complaint occurs, or in case interstitial thermometry is available when the normal tissue temperature reaches too high a value (>44 °C), or when the SAR constraint for critical tissues is reached.
The graphical user interface of VEDO is shown in . This figure immediately demonstrates how VEDO fulfils our first purposes, i.e. visualises the ‘actually applied’ patient-specific SAR distribution as an overlay on top of the CT image of the patient. ‘Actually applied’ stands for the predicted SAR distribution using the real-time measured phase and amplitudes of each of the 12 antennas. The ‘SAR statistics’ panel serves, among others, the second purpose: to show the maximum input RF power level – ‘MAX Power’ – to constrain the SAR dose in critical tissues. The main feature of VEDO is that it allows the HT administrator to obtain an excellent impression of the SAR distribution applied in relation to the anatomy and tumour location of the patient in a single view.
Figure 2. Layout of VEDO. CF SAR is overlaid on the CT-scan, the lighter the colour the higher the CF SAR.
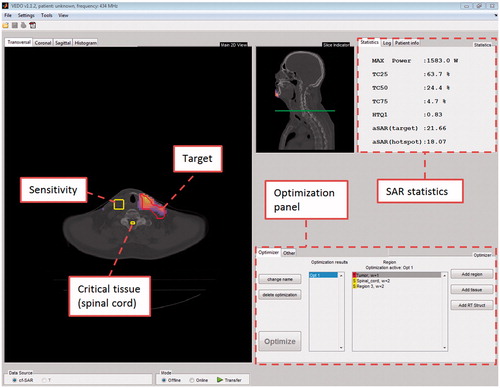
For the third purpose, we integrated the optimisation panel, which provides all the necessary command buttons to provide the online SAR optimisation. An essential feature of VEDO is that it facilitates objective adaption of the SAR distribution. Currently, this objective adaptation is based on the HTQ as described in Canters et al. [Citation20] but other parameters can be implemented as well.
Usage of VEDO is according to the following procedure.
Loading of tissue data and electrical fields of the single antennas in VEDO. The MATLAB data file obtained from SC2M is loaded in VEDO. VEDO asks the user to import a CT-scan, obtains the rotation and translation coefficients from SEMCAD X and fits the complex electrical field distributions of each individual antenna on this CT scan. It is necessary that the user (re)identifies the CTV and the critical organs such as spinal cord, brain tissue, etc. that might restrict the allowed input RF power level. VEDO provides SAR-volume histograms for these tissues and the maximum SAR in the head. This data is needed to calculate total absorbed power in each of the critical organs and to calculate 25%-iso SAR coverage of the CTV.
Optimisation. During SAR optimisation, the relative powers and phases of each individual antenna are optimised for minimising a certain goal function. For brevity we define a set of optimised powers and phases as a ‘setting’. An optimised setting for the HYPERcollar contains 12 antenna weightings, normalised to 1 W total input RF power, and 12 phases. The goal function implemented in VEDO is the hot spot SAR to tumour SAR quotient (HTQ) as described in Canters et al. [Citation20].
Hot spot SAR for HYPERcollar HT is defined as the average SAR in V1, which is the 1-volume percentage with the highest SAR in the total patient model, excluding the target. SARtarget is defined as the mean SAR in the target (CTV). (Re-)optimisation is done by a line search algorithm.
Output parameters of the optimisation process
Cubic filtered (CF) SAR. In CF SAR the regions of high SAR at high dielectric-contrast boundaries, inherently caused by the FDTD algorithm, are decreased by using a smoothing method to average the SAR over a cubic space of 1 cm3 of tissue. The underlying hypothesis is that thermal conduction prevents small SAR peaks (volume < 1 cm3) to be translated into hot spots. A major advantage of CF SAR over IEEE peak SAR quantifiers (1 g, 10 g) [Citation21] is that it is more straightforward. The main difference between CF SAR and IEEE peak SAR is that CF SAR behaves differently at the boundary between patient model and air.
Treatment quantifiers.
Target coverage25% (TC25%) [Citation11,Citation22]: the volume percentage of the CTV that is covered by 25% of the maximum CF SAR value in the whole patient model.
Maximum input RF power: The maximum allowed input as defined by the input RF power that leads to the threshold CF SAR of 60 W/kg in the spinal cord. Above this value, the temperature of the spinal cord has been correlated with 40 °C (and higher), which is considered the upper limit of tolerable exposure when the cord is in the radiation field [Citation23,Citation24].
SARtarget: defined as the mean SAR in the CTV at the actual applied input RF power.
SARvsP (SAR versus (input RF) Power): SARtarget at 1 W input RF power. This value is used to evaluate a (re-) optimisation in terms of efficiency per watt input RF power. If, for a re-optimisation, SARvsP is lower than 80% of the SARvsP of the previous optimisation, the re-optimisation should not be used because most probably the estimated possible input RF power increase – due to the re-optimisation – will not counteract the loss in efficiency.
Verification of VEDO
The validation of SEMCAD X was earlier extensively reported by Paulides et al. [Citation14,Citation25], where SEMCAD X was shown to correctly predict the location and size of a SAR focus in a cylindrical phantom, using both lateral and longitudinal SAR steering. For this study, extra tests using the cylindrical phantom were carried out only on orientation to ensure that a focus shift from VEDO was properly converted into a focus shift in the phantom. Each VEDO update is re-tested before its introduction into the clinic.
Inclusion criteria (‘decision making’)
In order to guarantee a minimum heating quality, the protocol for HT treatment using the HYPERcollar applicator prescribes that patients are only included for whom TC25% is at least 75%. The latter criterion, that three quarters of the tumour volume must be enclosed by the 25% iso-SAR contour, can only be bypassed when interstitial thermometry is placed in the target volume. In the latter case, a minimum TC25% of 25% is still an absolute requirement. All patients who do not fall within these criteria are excluded from treatment.
Thermometry
If required by the inclusion criteria or considered feasible by the radiation oncologist, interstitial catheters are placed close to, or in, the CTV region. At the start of the treatment, multi-sensor fibre-optic temperature probes (Fiso Evolutions fiber-optic temperature probe system, www.fiso.com) are placed in the catheters providing a near continuous presentation of the temperature distribution close to, or in, the CTV (refreshment rate of 1 s, accuracy ±0.2 °C (1 standard deviation). During treatment, the measured temperature of each probe and the applied power is displayed in real time by the software that controls the RF input power and phases to the HYPERcollar [Citation26].
Input RF power application protocol
Treatment is started by applying 200 W at t = 0. Input RF power is slowly increased after 30 s, in steps of 30 W per 30 s. If a patient complains of pain, the power is disabled to check whether the pain disappears, showing that the complaint is power related. If true, a SAR-based re-optimisation is applied by:
identifying the location of the painful area in the patient using the information provided by the patient;
finding the location identified by the patient within the projected CT-scan of the patient in VEDO and subsequently verifying the 3D-SAR distribution for a SAR hot spot closest to this location. This location is selected as an area with an increased sensitivity for temperature-related pain and the weighting factor for this area is modified;
instructing VEDO to perform a re-optimisation whereby the increased weighting should result in a reduced SAR at the identified area. When the re-optimised settings satisfy the criteria that SARvsP is larger than 80% of the SARvsP of the previous setting and the predicted maximum allowed input RF power remains above 800 W, the new settings are applied to the HYPERcollar. After 15 min of treatment, defined as the start of the plateau phase, input RF power increase is in steps of only 15 W per 30 s to reduce the risk of ‘overshoot in input RF power’ causing a situation of multiple and uncontrolled pain complaints from the patient.
Results
The objective of reporting the two cases is to demonstrate the potential of CA SAR steering using VEDO. A particular feature of VEDO is that, during the online steering, the HT-administrator is constantly aware of the consequences of the applied setting: VEDO provides a continuous update of the projected SAR level achieved in the CTV. Hence, the HT-administrator has the ability to quantitatively evaluate whether the proposed new amplitude and phase settings at the applied input RF power level results in higher SAR in the tumour (with expected higher tumour temperatures) than the previous settings.
The first patient was selected because he was the first patient treated using VEDO for SAR steering. The case report of this patient includes in total five VEDO-guided SAR steering actions, which all allowed increasing input RF power with associated higher predicted SAR levels in the patient. The second patient was selected because this treatment provided an opposite response. Although most of the re-optimisations allowed input RF power to be increased in this treatment, the practical input RF power increase without complaints of pain from the patient was too small to increase the SAR level at the tumour above that of the first setting. The format of each case report is that briefly the patient characteristics are reported, followed by a detailed description of the applied HT treatment including all considerations to decide for SAR steering actions.
Case 1
Patient and set-up information
A 60-year-old male with a poorly differentiated and irradically resected thyroid carcinoma was referred for deep HT in the H&N region. The RT schedule was 16 × 3.13 Gy; four fractions per week and four sessions of HT; one session per week. A short test treatment showed that the patient had no problem lying in the HYPERcollar and could withstand the pressure of the water bolus. The patient was placed such that the distance between the HYPERcollar and the shoulders was approximately 1.5 cm. The water bolus covered the total CTV region along the patient axis, while still allowing the patient to breath normally (see ).
Figure 3. [Case 1] Patient in the HYPERcollar during the test treatment.
![Figure 3. [Case 1] Patient in the HYPERcollar during the test treatment.](/cms/asset/ecbc343e-bb0e-4095-8e15-98223245e50b/ihyt_a_783934_f0003_b.jpg)
After the RT CTV was defined by the radiation oncologist, HTP was performed. This HTP showed that TC25% was 70% and according to our inclusion criteria we required thermometry. A H&N surgeon was able to place two interstitial catheters. Using our multi-sensor temperature probes inserted in the catheters, a total of four sensors were available for temperature monitoring. Two sensors were located in the CTV; the other two sensors where located in normal tissue near the CTV (see ). All sensors provide valuable information for validating HTP based on temperature modelling. During treatment the temperature probes in the CTV were used as indicator for the effectiveness of our steering actions at the location of the temperature measurement. Of course, the temperature measured at the probe’s location provides no relevant information on the more distant temperatures within the total CTV.
Figure 4. [Case 1] Frontal and sagittal view of the patient. For clarity, only segmented bone and CTV are shown. Blue probes (N1,N4) are probes outside the CTV, green probes (T2,T3) are within the CTV and are used to partly base our steering actions on.
![Figure 4. [Case 1] Frontal and sagittal view of the patient. For clarity, only segmented bone and CTV are shown. Blue probes (N1,N4) are probes outside the CTV, green probes (T2,T3) are within the CTV and are used to partly base our steering actions on.](/cms/asset/ec1c9f3e-1d79-4179-8b3e-75734ee18c54/ihyt_a_783934_f0004_b.jpg)
Treatment results
We used a maximum 650 W of total input RF power for the first treatment without complaints, and the temperature measured in the CTV was above 43 °C (Tmax = 46 °C). Hence, there was no need to perform any steering action. SAR steering was required in the second session and therefore the experiences on SAR steering during this second session are described hereafter. Session 2 was started, according to the power protocol, at 200 W using the same power and phase settings as used in the first treatment (Setting 1, TC25% = 70%, SARvsP = 0.37 W/kg). Although these settings were very successful in the first treatment, a total of four re-optimisations were performed in the second treatment to respond to patient complaints.
The first re-optimisation (Setting 2, TC25% = 37%, SARvsP = 0.35 W/kg) was initiated following a SAR-related complaint by the patient in the skin of the neck located at the sites where the two catheters were inserted. This first complaint occurred at 263 W input RF power. After re-optimisation the complaint re-occurred at the same location, but now at an input RF power level of 357 W, i.e. the first optimisation resulted in a gain of 94 W input RF power. Due to the low TC25% of setting 2 and because the input RF power could not be increased any further, it was decided to return to the first ‘successful’ setting. In contrast to the earlier response, we were now able to increase input RF power to 458 W, a much better result compared to the earlier maximum of 263 W at the first complaint. At 23 min the patient felt pain on the right side of his neck. Based on our experience (without the use of VEDO), 450 W is a typical input RF power for a neck treatment and as the actual measured tumour temperature was above 42 °C, we decided to maintain this setting (Setting 1). After 29 min the patient again complained about pain in the right part of the neck. As frequent complaints in the same region ultimately will lead to a reduction of input RF power, we decided to perform a new re-optimisation applying a constraint at the right part of the neck (Setting 3, TC25% = 64%, SARvsP = 0.40 W/kg). Again this setting allowed us to increase input RF power up to 503 W, until at 36 min the patient complained of pain under the chin. No change in settings was made. At 39 min the patient repeated the complaint of pain under the chin and it was decided to make another re-optimisation with a constraint at the chin (Setting 4, TC25% = 59%, SARvsP = 0.37 W/kg). Using this setting, power could be increased to 520 W, when at time 43 min the pain under the chin returned. However, the patient pointed out that the rise of the pain was more slowly, the intensity of the pain was lower and the painful spot was moved a bit to the left of chin. Although the pain was tolerable, as a final effort we applied a fifth re-optimisation (Setting 5, TC25% = 54 %, SARvsP = 0.37 W/kg) with less SAR at the left chin at 54 min of treatment time. This fifth setting did not improve the situation as the patient still complained about pain under the chin at the same input RF power level applied as at the previous setting. Based on the same SARvsP we anticipate that the treatment quality of the fifth setting was about equal to the fourth setting which was also reflected in the target temperature (43.7 °C versus 43.4 °C). As the end of the treatment was near, it was decided not to perform another re-optimisation.
VEDO Evaluation
An overview of the re-optimisation actions applied in this treatment is shown in . After treatment we re-measured the position of the patient, which revealed that the patient had moved 5 mm caudally during treatment (exact time of movement unknown).
Figure 5. [Case 1] Optimisation settings and its properties.
![Figure 5. [Case 1] Optimisation settings and its properties.](/cms/asset/2c2cc9b9-17a2-4ed1-b3a3-41484c7c7f90/ihyt_a_783934_f0005_b.jpg)
In , a SAR analysis is shown based on the recorded treatment data.
Figure 6. [Case 1] Mean SAR in the CTV based on the recorded applied powers and phases during treatment. The SARtarget values are sampled just before each change of optimisation setting and at the end of treatment.
![Figure 6. [Case 1] Mean SAR in the CTV based on the recorded applied powers and phases during treatment. The SARtarget values are sampled just before each change of optimisation setting and at the end of treatment.](/cms/asset/e8043a47-df86-4ad1-a298-040fa7bed5ab/ihyt_a_783934_f0006_b.jpg)
In summary, for case 1, the application of VEDO resulted in about a doubling of the SARtarget (from 96 to 178 W/kg) and a target temperature varying between 40.1 °C (Tmin after 15 min.) to 44.3 °C (Tmax). At the end of the session, the maximum tolerable power input was reached as further optimisation did not result in higher target SAR. The maximum input RF power – limited by the maximum allowed spinal cord SAR – was never exceeded.
Case 2
Patient and set up information
This treatment concerned a 75-year-old female with a primary adenoid cystic carcinoma located at the base of the tongue. She was treated by external RT combined with deep HT in the H&N region. The RT schedule was 33 × 2 Gy; six fractions per week. The HT schedule was six sessions, one session per week.
Again a short test treatment (see ) was performed in order to get a good match between the real position of the patient in the HYPERcollar with respect to the position during the CT-scan. The patient could easily bear the test treatment and showed no signs of claustrophobia. After the test treatment, HTP was performed using the RT CTV as target, yielding an optimisation setting (setting 1: TC25% = 95%, SARvsP = 0.27 W/kg) which met our inclusion criteria, and it was decided to treat the patient with HT.
Figure 7. [Case 2] Patient during the test treatment. The HYPERcollar was originally designed to treat only patients with a tumour in the neck. For patients with a tumour in the head, we use sticky tape for comfort and respiration purposes.
![Figure 7. [Case 2] Patient during the test treatment. The HYPERcollar was originally designed to treat only patients with a tumour in the neck. For patients with a tumour in the head, we use sticky tape for comfort and respiration purposes.](/cms/asset/67b972a6-eddf-41e7-8953-7752d0b5d184/ihyt_a_783934_f0007_b.jpg)
Four catheters were interstitially placed by a H&N surgeon, which gave us a total of three measurements points in the CTV and eight probes in normal tissue, peripheral to the CTV (see ). Similar to case 1, these probes are used to assess the effectiveness of our SAR steering actions. As the temperature probes were located closely together in the tumour at the right part of the tongue, only temperature information was available for this part of the target volume. Although not necessary to meet our inclusion criteria, we stress that adequate temperature measurement in the CTV region is always beneficial for the patient because in our view it enhances treatment quality.
Figure 8. [Case 2] Frontal and sagittal view of the patient. For clarity, only segmented bone and CTV are shown and only the probes within the CTV are labelled. Blue probes are probes outside the CTV, green probes (T1, T2 and T3) are within the CTV and are used to partly base our steering actions on.
![Figure 8. [Case 2] Frontal and sagittal view of the patient. For clarity, only segmented bone and CTV are shown and only the probes within the CTV are labelled. Blue probes are probes outside the CTV, green probes (T1, T2 and T3) are within the CTV and are used to partly base our steering actions on.](/cms/asset/b5fe7273-0d4c-4f5b-969a-ca80d17956e7/ihyt_a_783934_f0008_b.jpg)
Treatment results
Conforming to protocol, the first treatment was started at 200 W using setting 1, and four re-optimisations were performed during the 60 min of treatment. The first complaint happened after 14 min at 810 W input: the patient indicated a hot, though just bearable, area where the catheters were inserted. This prevented us increasing input RF power but, as temperature was still increasing, we did not intervene. At 18 min (Tmax = 40.9 °C), the patient complained again that it was too hot around the area where the catheters were inserted in the skin. A re-optimisation (setting 2, TC25% = 92%, SARvsP = 0.22 W/kg) was performed with a sensitivity region at the region of the complaint. This new setting did not allow us to increase power and because 1) the coverage was lower, 2) the temperature in the target went down (Tmax went from 40.9 °C to 40.6 °C), and 3) the power weighting distribution of all antennae was such that two antennae could not deliver the required power, we decided to go back to setting 1.
The complaint returned at 25 min and 840 W input RF power, after which a third optimisation was performed. The region of complaint was still around the area where the catheters were inserted in the skin, but to prevent relatively high weightings of one or more antennae in the power weight distribution which lowers the amount of input power that can be used – as seen in setting 2 – the relative power weighting of each antenna was constrained in the optimisation to be between 30% and 70%. This new setting – (setting 3, TC25% = 96%, SARvsP = 0.22 W/kg) – resulted in a complaint at the right ear at 30 and 32 min of treatment time, at an input RF power of 880 W. Because the time between pain complaints was short, the power enhancement was minor (40 W) and the temperature in the target went down substantially (Tmax went from 40.4 °C to 38.9 °C), we chose to go back to setting 1.
At 39 min of treatment time – input RF power was 887 W – three of the antennas reached the maximum power that could be delivered. Therefore, at 42.5 min of treatment time, a new setting (setting 4, TC25% = 97%, SARvsP = 0.25 W/kg) was made and applied that had no sensitivity regions, targeted the CTV and bounded the relative power weighting of each antenna between 30% and 70%. This setting allowed us to reach 920 W when, at 44 min of treatment time, two antennas were again delivering the maximum amount of power. We decided to lower the power weighting of these two antennae manually form 19% to 16% each. VEDO’s capability of showing the SAR derived from the phases and amplitudes that are actually applied in treatment showed that the SARvsP was larger than 80% of the latter optimisation setting.
Due to an unidentified reason, the reflection of one antenna became too high (>40 W) and the built-in safety mechanism shut down the amplifier. Because the reason for the high reflection was unknown, and could be cross-coupling – instead of impedance mismatch – and because the temperatures went down, it was decided to switch back to setting 1. However, setting 1 did not reduce reflection. No other cause for this high reflection was seen. At 53 and 54 min of treatment time the patient complained about pain at the area where the catheters were inserted in the skin, but we decided to continue unchanged because the previous attempts did not result in a better optimisation setting.
VEDO evaluation
An overview of the re-optimisation actions applied in this treatment is shown in . In a SAR analysis is shown based on the recorded treatment data. For this patient the pre-treatment planning setting proved optimum, hence SAR steering was not required. Moreover, the maximum input RF power – limited by the maximum allowed spinal cord SAR – was never exceeded.
Figure 9. [Case 2] Optimisation settings and its properties.
![Figure 9. [Case 2] Optimisation settings and its properties.](/cms/asset/ff0f9a65-ff1b-4ff7-8c9c-5fe65d062ae4/ihyt_a_783934_f0009_b.jpg)
Figure 10. [Case 2] Mean SAR in the CTV based on the recorded applied powers and phases during treatment. The SARtarget values are sampled just before each change of optimisation setting and at the end of treatment.
![Figure 10. [Case 2] Mean SAR in the CTV based on the recorded applied powers and phases during treatment. The SARtarget values are sampled just before each change of optimisation setting and at the end of treatment.](/cms/asset/324f876c-21f0-411a-96ea-cfdabd2cabfd/ihyt_a_783934_f0010_b.jpg)
Discussion
In this paper we introduced the VEDO-based H&N HT protocol and we showed how the CA steering implementation allows response to SAR-related hot spots in a standardised and quantitative way. For case 1 it was evident that the hot spot at the skin, where the catheters were inserted, was treatment limiting and VEDO was allowed to respond nicely to the hot spot. For case 2, VEDO showed in a few steps that the first optimisation was already the best that could be obtained using SAR optimisation. This is also important information. If a re-optimisation – which should lower the SAR at the complaint area – is done, and it does not improve the resulting absolute SARtarget any further, we can safely assume that a better HTQ optimised setting does not exist for the current treatment position. By definition, each re-optimisation should increase the HTQ a little, i.e. reduce the mean SAR applied to the target, due to the extra restriction from a new sensitivity region. This reduction of mean target SAR must at minimum be compensated for by the ability to increase the applied input RF power. If a sufficiently increased input RF power cannot be achieved, the re-optimisation does not lead to a higher mean SAR in the target and, hence, the previous setting led to better treatment quality.
In case 1 we observed that the first time setting 1 was applied, the input RF power could not be increased further than 263 W, whereas the second time input RF power could be increased to 458 W. This behaviour can be explained by position mismatch: as already stated in the treatment description of case 1, the patient was moved 5–6 mm caudally during treatment. This could explain the difference in maximum administered input RF power between the first and second time setting 1 was applied.
In both cases, the catheters gave SAR-related patient complaints at the area where the catheters were inserted in the skin. These complaints can be explained by plastic buttons that were attached to the catheters at the skin – to keep them in place –that were not added to the HTP model. However, using CA steering, these complaints could be effectively reduced and power could be significantly increased. Hence, although non-modeled buttons led to complaints, this inaccuracy in the modeling did not hamper effective use of VEDO. Because re-optimisation results in a less optimum setting, these buttons should be substituted by other methods (stitches) in future patients.
The purpose of this study was to demonstrate the possible capabilities of VEDO to deal with hot spots in deep local H&N HT. The main benefit of VEDO is that, although it is currently impossible to accurately predict temperature distributions and thus regions of too high temperatures outside the target, VEDO manages to increase the target SAR during a HT treatment by SAR re-optimisation. Moreover, the fact that VEDO was able to predict the expected coverage a priori ensures that HT treatments are only given if the treatment quality is adequate. This ensures that no patient endures the relatively heavy treatment unnecessarily and enhances overall HT quality. Also, the implementation of a semi-automatic SAR steering approach – aided by the SAR-on-CT scan overlay – simplifies the use of phased array equipment in the clinic, for example no extensive background in EM fields is required for the medical staff. Furthermore, VEDO is capable to a posteriori assess the SAR dose given in a treatment and thereby informing medical staff about the actual given SAR dose and hence, treatment quality.
The choice for using HTP-guided steering for H&N HT treatments is straightforward. Franckena et al. [Citation16] showed that, in cervical cancer, HTP-guided steering achieves similar levels of HT quality as empirically based steering. These empirically based steering guidelines were derived from 18 years of experience. In H&N HT, using the HYPERcollar, this experience is lacking. Moreover, the higher frequency (H&N HT:433 MHz; cervix HT: 77 MHz), the existence of critical tissue (spinal cord) close to the target, and the presence of many tissue transitions make empirical steering less practical and even useless for H&N HT.
In Canters et al. [Citation15], the used optimisations were pre-calculated to lower the response time to hot spots. CA steering using VEDO is fast enough (from complaint till re-optimisation <1 min) to perform the optimisation during HT treatment. We still recommend applying the old optimisation at a lower input RF power in the time between a fading SAR-related complaint, due to a power-off, and a re-optimisation setting, in order to reduce the temperature decrease in the target.
Besides the above mentioned advantages, one superior benefit of VEDO is that HT treatment can standardise phased array HT treatments between different patients, between medical staff, and between different HT centres, which allows for adequate comparison of treatments, for example in multi-institutional trials. Moreover, VEDO can be used for other treatments such as superficial HT and deep HT in the pelvic area and does not depend on SEMCAD X as EM simulation platform; other EM simulation platforms can be used as well.
Another benefit of VEDO is that it provides a quantified method for directing SAR-steering problems which will reduce the variability of individual decision-making across clinics, leaving more time to the medical staff to deal with the other parts of the treatment, such as patient comfort and quality assurance. All these advantages will potentially lead to a more reproducible treatment quality and VEDO will fit perfectly in the HT quality management as described by Bruggmoser [Citation27].
The use of HTP-guided CA steering depends heavily on the quality of the EM simulations and the match between simulations and clinical practice. Different factors influence this mismatch between simulations and clinical practice. Firstly, although validation studies have been carried out on phantoms [Citation25,Citation28] and more recently in patients [Citation29], there is still a lack of validation of the complete patient and HYPERcollar set-up. Inter-patient variation of EM and thermal properties exists and could be a source of error. Online MRI-based temperature mapping during HT - as done in [30] for intravenous ultrasound HT, in [17,31-33] for phased array HT, and in [34] for high-intensity focused ultrasound (in rats) - should be used to validate the complete patient and HYPERcollar set-up. Secondly, the correlation between the current goal function, HTQ and temperature should still be proven for H&N HT. This correlation has been established for a different region than H&N, the pelvic area, by Canters et al. [Citation35], which has a different anatomical structure, and HT is applied at a 5–6-fold lower frequency leading to lower SAR and temperature gradients. This study of Canters et al. should be repeated for H&N HT in order to establish the SAR quantifiers that correlate best to temperature and herewith enhance the clinical benefit of H&N HTP-guided CA steering. Thirdly, there are still improvements possible in the current H&N treatment. The patient of case 1 was moved 5 mm caudally, hence a better method to render the patient immobile should be developed. Also, the current HYPERcollar water bolus should be improved to increase the reproducibility of the water bolus shape. We anticipate that these validation steps and adaptations will lead to an even more effective HTP-guided CA steering. Fourthly, the use of simulated temperature instead of simulated SAR for VEDO may improve CA steering. In this paper, SAR-based HTP was used because SAR has been shown to be accurately predictable [Citation36]. Accurate temperature prediction simulations suffer from poorly predictable variations in thermal tissue properties such as perfusion [Citation37]. If further research finds a reliable and quickly calculable method to convert SAR to temperature, the additional value of its implementation in VEDO of this conversion should be evaluated.
Conclusion
In this paper we introduced VEDO and showed its potential to, in a semi-automatic way, increase SARtarget in patients. Features such as CT overlay, adding sensitivity regions by mouse-clicking on complaint regions, and easy decision-making by quantifying the optimisation results aid in VEDO’s usability. By implementing VEDO into the clinic we have developed the first step towards a quantitative treatment strategy. VEDO can already be used by HT administrators and will implicitly reduce the variability in HT treatment application and may potentially lead to an overall enhancement of treatment quality and comparisons between clinics.
Declaration of interest
The authors report no conflicts of interest. The authors alone are responsible for the content and writing of the paper.
Related Research Data
References
- Valdagni R, Amichetti M. Report of long-term follow-up in a randomized trial comparing radiation therapy and radiation therapy plus hyperthermia to metastatic lymphnodes in stage IV head and neck patients. Int J Radiat Oncol Biol Phys 1994;28:163–9
- Valdagni R, Liu FF, Kapp DS. Important prognostic factors influencing outcome of combined radiation and hyperthermia. Int J Radiat Oncol Biol Phys 1988;15:959–72
- Hua Y, Shenglin M, Zhenfu F, Qiaoying H, Wang L, Yongfeng P. Intracavity hyperthermia in nasopharyngeal cancer: A phase III clinical study. Int J Hyperthermia 2011;27:180–86
- Huilgol N, Gupta D, Dixit R. Chemoradiation with hyperthermia in the treatment of head and neck cancer. Int J Hyperthermia 2010;26:21–5
- Conley BA. Treatment of advanced head and neck cancer: What lessons have we learned? J Clin Oncol 2006;24:1023–5
- El-Sayed S, Nelson N. Adjuvant and adjunctive chemotherapy in the management of squamous cell carcinoma of the head and neck region. A meta-analysis of prospective and randomized trials. J Clin Oncol 1996;14:838–47
- Amichetti M, Romano M, Busana L, Bolner A, Fellin G, Pani G, et al. Hyperfractionated radiation in combination with local hyperthermia in the treatment of advanced squamous cell carcinoma of the head and neck: A phase I–II study. Rad Oncol 1997;45:155–8
- Huilgol N, Gupta D, Sridhar C. Hyperthermia with radiation in the treatment of locally advanced head and neck cancer: A report of randomized trial. J Cancer Res Ther 2010;6:492–6
- Eppink B, Krawczyk PM, Stap J, Kanaar R. Hyperthermia-induced DNA repair deficiency suggests novel therapeutic anti-cancer strategies. Int J Hyperthermia 2012;28:509–17
- van der Zee J, Holt vdB, Rietveld PJM, Helle PA, Wijnmalen AJ, Putten WLJ, et al. Reirradiation combined with hyperthermia in recurrent breast cancer results in a worthwhile local palliation. Br J Cancer 1999;79:483–90
- Lee KH, Antell AG, Perez CA, Straube WL, Ramachandran G, Myerson RJ, et al. Superficial hyperthermia and irradiation for recurrent breast carcinoma of the chest wall: Prognostic factors in 196 tumors. Int J Radiat Onc Biol Phys 1998;40:365–75
- Jones E, Thrall D, Dewhirst MW, Vujaskovic Z. Prospective thermal dosimetry: The key to hyperthermia's future. Int J Hyperthermia 2006;22:247–53
- Franckena M, Fatehi D, de Bruijne M, Canters RA, van Norden Y, Mens JW, et al. Hyperthermia dose–effect relationship in 420 patients with cervical cancer treated with combined radiotherapy and hyperthermia. Eur J Cancer 2009;45:1969–78
- Paulides MM, Bakker JF, Neufeld E, van der Zee J, Jansen PP, Levendag PC, et al. Winner of the ‘New Investigator Award’ at the European Society of Hyperthermia Oncology Meeting 2007. The HYPERcollar: A novel applicator for hyperthermia in the head and neck. Int J Hyperthermia 2007;23:567–76
- Canters RAM, Franckena M, van der Zee J, Van Rhoon GC. Complaint-adaptive power density optimization as a tool for HTP-guided steering in deep hyperthermia treatment of pelvic tumors. Phys Med Biol 2008;53:6799–820
- Franckena M, Canters R, Termorshuizen F, van der Zee J, van Rhoon GC. Clinical implementation of hyperthermia treatment planning guided steering: A cross over trial to assess its current contribution to treatment quality. Int J Hyperthermia 2010;26:145–57
- Lüdemann L, Wlodarczyk W, Nadobny J, Weihrauch M, Gellermann J, Wust P. Non-invasive magnetic resonance thermography during regional hyperthermia. Int J Hyperthermia 2010;26:273–82
- Canters RAM, Paulides MM, Franckena MF, van der Zee J, van Rhoon GC. Implementation of treatment planning in the routine clinical procedure of regional hyperthermia treatment of cervical cancer: An overview and the Rotterdam experience. Int J Hyperthermia 2012;28:570–81
- Neufeld E. High resolution hyperthermia treatment planning. Doctoral thesis, Swiss Federal Institute of Technology, ETH Zurich, 2008
- Canters RAM, Franckena M, Paulides MM, Van Rhoon GC. Patient positioning in deep hyperthermia: Influences of inaccuracies, signal correction possibilities and optimization potential. Phys Med Biol. 2009;54:3923–36
- IEEE. Std c95.3 recommended practice for measurements and computations of radio frequency electromagnetic fields with respect to human exposere to such fields, 100 kHz–300 GHz. New York: IEEE, 2002
- Myerson RJ, Perez CA, Emami B, Straube W, Kuske RR, Leybovich L, et al. Tumor control in long-term survivors following superficial hyperthermia. Int J Radiat Oncol Biol Phys 1990;18:1123–9
- Haveman J, van der Zee J, Wondergems J, Hoogeveen JF, Hulshof MCCM. Effects of hyperthermia on the peripheral nervous system: A review. Int J Hyperthermia 2004;20:371–91
- Kok HP, van Haaren PM, van de Kamer JB, Zum Vorde Sive Vording PJ, Wiersma J, Hulshof MC, et al. Prospective treatment planning to improve locoregional hyperthermia for oesophageal cancer. Int J Hyperthermia 2006;22:375–89
- Paulides MM, Bakker JF, van Rhoon GC. Electromagnetic head-and-neck hyperthermia applicator: Experimental phantom verification and FDTD model. Int J Radiat Oncol Biol Phys 2007;68:612–20
- Bakker JF, Paulides MM, Westra AH, Schippers H, van Rhoon GC. Design and test of a 434 MHz multi-channel amplifier system for targeted hyperthermia applicators. Int J Hyperthermia 2010;26:158–70
- Bruggmoser G. Some aspects of quality management in deep regional hyperthermia. Int J Hyperthermia 2012;28:562–9
- Paulides MM, Bakker JF, Chavannes N, Van Rhoon GC. A patch antenna design for application in a phased-array head and neck hyperthermia applicator. IEEE Trans Biomed Eng 2007;54:2057–63
- Paulides MM, Bakker JF, Linthorst M, van der Zee J, Rijnen Z, Neufeld E, et al. The clinical feasibility of deep hyperthermia treatment in the head and neck: New challenges for positioning and temperature measurement. Phys Med Biol 2010;55:2465–80
- Salgaonkar VA, Prakash P, Diederich CJ. Temperature superposition for fast computation of 3D temperature distributions during optimization and planning of interstitial ultrasound hyperthermia treatments. Int J Hyperthermia 2012;28:235–49
- Cheng KS, Stakhursky V, Stauffer P, Dewhirst M, Das SK. Online feedback focusing algorithm for hyperthermia cancer treatment. Int J Hyperthermia 2007;23:539–54
- Stakhursky VL, Arabe O, Cheng KS, MacFall J, Maccarini P, Craciunescu O, et al. Real-time MRI-guided hyperthermia treatment using a fast adaptive algorithm. Phys Med Biol 2009;54:2131–45
- Gellermann J, Wlodarczyk W, Feussner A, Fahling H, Nadobny J, Hildebrandt B, et al. Methods and potentials of magnetic resonance imaging for monitoring radiofrequency hyperthermia in a hybrid system. Int J Hyperthermia 2005;21:497–513
- Hijnen NM, Heijman E, Köhler MO, Ylihautala M, Ehnholm GJ, Simonetti AW, et al. Tumour hyperthermia and ablation in rats using a clinical MR-HIFU system equipped with a dedicated small animal set-up. Int J Hyperthermia 2012;28:141–55
- Canters RAM, Wust P, Bakker JF, Van Rhoon G. A literature survey on indicators for characterization and optimization of SAR distributions in deep hyperthermia, a plea for standardization. Int J Hyperthermia 2009;25:593–608
- de Bruine M, Samaras T, Chavannes N, van Rhoon GC. Quantitative validation of the 3D SAR profile of hyperthermia applicators using the gamma method. Phys Med Biol 2007;52:3075–88
- Akyürekli D, Gerig LH, Raaphorst GP. Changes in muscle blood flow distribution during hyperthermia. Int J Hyperthermia 1997;13:481–96