Abstract
Purpose: Predictions of injury in response to photothermal therapy in vivo are frequently made using Arrhenius parameters obtained from cell monolayers exposed to laser or water bath heating. However, the impact of different heating methods and cellular microenvironments on Arrhenius predictions has not been thoroughly investigated. This study determined the influence of heating method (water bath and laser irradiation) and cellular microenvironment (cell monolayers and tissue phantoms) on Arrhenius parameters and spatial viability.
Methods: MDA-MB-231 cells seeded in monolayers and sodium alginate phantoms were heated with a water bath for 3–20 min at 46, 50, and 54 °C or laser irradiated (wavelength of 1064 nm and fluences of 40 W/cm2 or 3.8 W/cm2 for 0–4 min) in combination with photoabsorptive carbon nanohorns. Spatial viability was measured using digital image analysis of cells stained with calcein AM and propidium iodide and used to determine Arrhenius parameters. The influence of microenvironment and heating method on Arrhenius parameters and capability of parameters derived from more simplistic experimental conditions (e.g. water bath heating of monolayers) to predict more physiologically relevant systems (e.g. laser heating of phantoms) were assessed.
Results: Arrhenius predictions of the treated area (<1% viable) under-predicted the measured areas in photothermally treated phantoms by 23 mm2 using water bath treated cell monolayer parameters, 26 mm2 using water bath treated phantom parameters, 27 mm2 using photothermally treated monolayer parameters, and 0.7 mm2 using photothermally treated phantom parameters.
Conclusions: Heating method and cellular microenvironment influenced Arrhenius parameters, with heating method having the greater impact.
Introduction
Photothermal therapy is an actively researched tumour treatment method which results in spatially distributed cell death and can utilise photo-absorptive nanoparticles such as single-walled carbon nanohorns (SWNHs) to convert near-infrared (NIR) irradiation into heat within tissue models [Citation1–3]. A great deal of research has been dedicated to the investigation of the relationship between thermal exposure and cellular injury [Citation4–9]. Previous research has quantified thermal injury dealt to sectioned and live tissue using ethidium homodimer and histological analysis [Citation4,Citation5,Citation10,Citation11]. Other groups have examined the impact of hyperthermia specifically on heat shock proteins [Citation12–14], or individual organs [Citation15]. Significant progress has been made in identifying applications and limitations associated with existing thermal injury models [Citation6,Citation9,Citation16–18].
Many research groups use viability data from constant temperature or photothermally heated cell monolayers to predict the spatial viability response of cancer cells and tumours to photothermal therapy [Citation3,Citation19]. The use of viability response data obtained from experiments is critical for clinical photothermal treatment planning. However, viability response to elevated temperatures has been shown to vary as a function of heating rate, maximum temperature, and cellular attachment [Citation5,Citation8,Citation14]. In addition, cell monolayers lack the diffusional gradients, cell morphology, cell-extracellular matrix (ECM) interactions, and mechanical stresses experienced by cells in vivo, which influences their response to treatment [Citation20,Citation21]. Cell monolayers submerged in media also transfer heat through convection rather than conduction, making them less representative of photothermally treated tissue compared to 3D in vitro models. Variations in cell microenvironment and heating method are expected to impact spatial viability response in tissue.
Our group has determined the spatial viability response of photothermally treated 2D cell monolayers [Citation22] and more thermally and physiologically representative sodium alginate phantoms. These studies indicated that both phantoms and cell monolayers treated with photothermal therapy exhibited distinct regions of complete cell death and peripheral regions of viable cells with the contour of the viability profile significantly changing as a function of duration of laser irradiation. However, the size and shape of these regions could not be directly compared for photothermally treated cell monolayers and phantoms due to their highly dissimilar temperature distributions. This is partially due to the fact that 2D cell monolayers experience thermal convection which results in asymmetric viability profiles, while 3D phantoms experience heat transfer through conduction leading to more symmetric viability profiles as is typical of heat transfer in vivo. However, the impacts of both cellular microenvironment (2D cell monolayers versus 3D tissue phantoms) and heating method (photothermal versus constant temperature heating) on viability response are unknown. Comparing the viability and associated injury response as a function of cellular microenvironment and heating methods requires a basis for comparison such as the Arrhenius model.
The Arrhenius model is a widely accepted thermal injury model which utilises experimentally derived parameters: A, the frequency factor which typically varies between A = 1 × 10²⁰ and 1 × 10105 s−1, and Ea, the activation energy which generally ranges between 1 × 10⁵ and 9 × 10⁵ J/mol [Citation23]. The Arrhenius model has been used to quantify thermal injury response in cell monolayers [Citation14,Citation18,Citation24], cell suspensions [Citation8], and tissue samples [Citation4,Citation5,Citation10,Citation11] exposed to photothermal and constant temperature heating. Arrhenius parameters have been shown to change with variation in heating rate, maximum temperature, cell line, and degree of cell adhesion (cells attached to surfaces or in suspension) [Citation5,Citation8,Citation14].
Experimentally determining Arrhenius parameters in vitro typically incorporates a tissue-representative experimental system, thermal exposure for differing durations, and the quantification of the viability resulting from this exposure. Tissue models which have been used to evaluate thermal injury include cell monolayers [Citation1,Citation25] and in vivo models [Citation26,Citation27]. These systems offer advantages for producing predictive Arrhenius parameters; however, many also have drawbacks which decrease the accuracy of these parameters. Monolayers provide easily measured and detailed spatial injury profiles, but fail to represent microenvironments and thermal properties which would mimic the actual response of tissue to therapy [Citation22]. In vivo models can use magnetic resonance thermal imaging (MRTI) to accurately determine spatial thermal profiles in photothermally treated tissue; however, the viability measurement methods which provide spatial information in vivo either rely on physiological changes which indicate whether injury has occurred, or manual histological analysis [Citation10,Citation28]. Since histological analysis is conducted manually on the micro-scale, it can either be used to determine viability quantitatively over small distances, or qualitatively over larger ones. It is reasonable to suggest that systems which are both thermally and physiologically similar to tissue, and also allow for quantitative measurements of spatial viability or injury, are preferred over non-representative or non-spatial systems to plan photothermal treatment. Sodium alginate tissue phantoms are a biocompatible immobilisation matrix which provide a 3D representative cellular microenvironment, yield similar thermal conductivity as tissue and optical absorption in the near-infrared spectrum, while providing a transparent matrix which may be easily imaged to obtain 3D viability response data [Citation29,Citation30]. These properties make sodium alginate an appealing cellular matrix for determining the viability response to NIR photothermal therapy. To the author’s knowledge, Arrhenius parameters have not been determined in phantoms before.
Determining accurate Arrhenius parameters for photothermal therapy may require the application of appropriate transient heating and cellular microenvironments with similar thermal properties as tissue. Arrhenius parameters are typically determined following steady-state water bath heating of cell monolayers [Citation18] or fixed temperature plate heating of thin slab tissue sections for controlled durations [Citation4]. These isothermal heating methods do not take into consideration the rate of thermal increase experienced during transient photothermal heating, which has been shown to affect Arrhenius parameters [Citation8]. Furthermore, the spatially varying thermal dose inherent with photothermal therapy is not embodied in these isothermal methods.
Experimentally determined Arrhenius parameters may also be impacted by the methods used to evaluate viability response. Common methods for measuring viability in vitro such as MTT (3-(4,5-dimethylthiazol-2-yl)-2,5-diphenyltetrazolium bromide)/colorimetric tetrazolium salt assays [Citation2], trypan blue [Citation1,Citation26,Citation31], propidium iodide [Citation32], ethidium homodimer [Citation8], calcein AM [Citation33], and crystal violet assays [Citation31] can determine average viability across the sample, but are not typically used to measure spatially distributed viability associated with laser heating. Photothermal therapy has been shown to generate areas of incomplete thermal injury, termed ‘transition zones’, which cannot be quantified using binary or non-spatial viability analysis [Citation22]. Because of this, non-spatial viability measurement methods cannot account for spatial viability variations associated with photothermal therapy.
Our group has developed methods which quantitatively determine spatial viability responses in both 2D cell monolayers and 3D tissue phantoms [Citation22]. These methods use a thermal camera to determine the spatio-temporal temperature experienced in a photothermally treated system and utilises digital image analysis of fluorescently stained cells with tiling microscopy to generate spatial viability measurements. This method has been used to accurately quantify the size of regions of complete cell death and transition zones containing partially treated areas of monolayers exposed to photothermal therapy [Citation22]. Existing non-spatial viability measurement methods would not have been capable of this analysis. However, to the author’s knowledge, spatial viability of 2D cell monolayers or 3D phantoms exposed to varying heating methods (water bath and photothermal therapy) have not been previously used to generate Arrhenius parameters.
This paper compares the Arrhenius parameters determined from systems with different heating methods and cellular microenvironments and their resulting viability predictions generated from spatio-temporal temperature data. Quantitative digital analysis methods developed by our group were used to determine the spatial viability and utilise this information for the first time to determine Arrhenius parameters [Citation22]. Arrhenius parameters were determined from cellular monolayers exposed to steady state water bath heating, cellular monolayers exposed to photothermal therapy, cells suspended in sodium alginate phantoms treated with steady-state water bath heating, and cells suspended in sodium alginate phantoms treated with photothermal therapy. The 2D spatial viability predictions resulting from each set of Arrhenius parameters and measured spatio-temporal temperature profiles were compared with the measured spatial viability of photothermally treated phantoms using custom-developed digital analysis methods. These quantitative comparisons of spatial viability predictions allow for the significance of transient heating and 3D microenvironments to be determined.
Methodology
Experimental method
This paper determines Arrhenius parameters for systems with one of two cellular microenvironments and one of two heating methods. These Arrhenius parameters were used to create spatial predictions of viability in photothermally treated phantoms. These predictions were compared with measured viability in photothermally treated phantoms using custom-designed software to determine accuracy.
Cellular systems
Two types of cellular microenvironments were used in the experiments (). The first microenvironment used was a cell monolayer. MDA-MB-231 cells were plated at a concentration of 100 000 cells/mL onto 25 cm2 flasks (Becton Dickinson Labware, Franklin Lakes, NJ) when heated with a water bath and or on six-well dishes (Corning, NY) at the same concentration when exposed to laser heating.
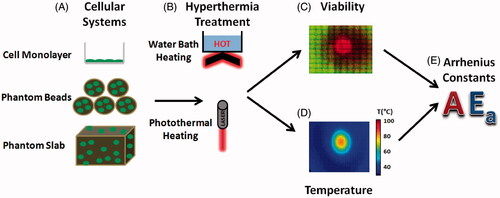
Figure 1. The method used to generate isothermal and photothermal Arrhenius parameters. (A) Cellular systems included cellular monolayers, phantom beads, and tissue phantoms. (B) Heating methods included hot water baths and SWNH-mediated photothermal therapy. (C) Viability in each system was measured and plotted using digital imaging of fluorescently stained cells. (D) Temperature for photothermal therapy was recorded using a thermal camera. (E) Viability response and temperature profiles were fitted with the Arrhenius model, and the Arrhenius parameters Ea and A which best fitted the system were identified.
The second microenvironment used was a sodium alginate phantom which functioned as a 3D tumour platform. Sodium alginate phantoms were used due to their biocompatibility, representative thermal properties, and optical transparency in the visual spectrum which enabled uninhibited imaging [Citation29]. A stock sodium alginate solution of 3.6% was created by mixing sodium alginate with deionised water and subsequently filtering the solution with a 0.22 μm filter for sterilisation. Next, the alginate solution was mixed with SWNH at a final concentration of 0.085 mg/mL and Pluronic (Biotium, Hayward, CA) at a final concentration of 0.0425 mg/mL to aid in SWNH suspension. SWNHs increase the efficacy of photothermal therapy in vitro by increasing absorption at NIR wavelengths, and thus peak temperatures reached [Citation1]. Next, MD-MBA-231 breast cancer cells were mixed with trypsin to place cells in suspension and washed twice with Dulbecco’s modified Eagle medium (DMEM) (Life Technologies, Grand Island, NY) to remove trypsin. The alginate/SWNH suspension was then mixed with 2 mL cells suspended in DMEM at a concentration of 1.5 × 10⁵ cells per mL. The final phantom solution was then placed in a cylindrical mould (1.3 inches, 33 mm diameter, 0.06 inches, 1.52 mm thick) and cross-linked using a 100 mmol calcium chloride solution. The solution was left to cross-link at 37 °C for 18 min, rinsed three times with phosphate buffered saline (PBS) in order to remove excess CaCl2, and then placed in DMEM to maintain cell viability.
A different form of the phantom microenvironment used was sodium alginate phantom beads (small spherical phantoms) created to determine the Arrhenius parameters associated with water bath heating. Phantom beads were selected due to their high surface area to volume ratio which allows for rapid heating and cooling, while still simulating a 3D microenvironment. The phantom beads were created using an identical mixture of cells in sodium alginate solution as the sodium alginate phantoms, but were formed by pipetting droplets (∼100 µL) of sodium alginate into calcium chloride and allowing cross-linking for 15 min.
Heating method
Two types of heating methods () were applied to the cellular systems. The first heating method used was a constant temperature Neslab RTE 7 water bath system (Thermo Scientific, Albuquerque, NM). Cell media was replaced with pre-heated PBS 24 h after cells were seeded in 25 cm2 flasks, to rapidly acclimate cells to the water bath temperature. Since it has been noted that best-fit Arrhenius parameters change at approximately 43 °C and 54 °C [Citation18], water bath temperatures of 46 °C, 50 °C, and 54 °C were selected to optimise the Arrhenius parameters across a wide range of temperatures. Flasks were immediately placed in a Neslab RTE 7 (Thermo Scientific) hot water circulator and acclimated for 5, 10, 15, and 20 min at 46 °C, and for 3, 6, 9, and 12 min at 50 ° and 54 °C. After heating, the PBS in the flasks were collected and mixed with 22 °C PBS, and 37 °C media was immediately added to the 25 cm2 flasks. The PBS was then centrifuged, the supernatant was removed, and centrifuged cells were placed back into each flask. This ensured that any cells which detached during the heating process were accounted for. To heat phantom beads in water baths, approximately 10 beads were placed in each of 12 sealing plastic bags (SC Johnson, Racine, WI) with 2 mL of media. These bags were submerged in water using the same durations and temperatures as the water bath heated monolayers.
The second heating method used was nanoparticle-mediated photothermal therapy, which uses SWNHs to generate sufficient heat to induce cell death. For cell monolayer experiments, 3 mL DMEM cell media containing a concentration of 0.085 mg/mL SWNHs were added to MDA-MB-231 cell monolayers. Cells were irradiated for 1–4 min with a YLD-5-1064-LP pumped diode laser (IPG Photonics, Oxford, MA) at a wavelength of 1064 nm and fluence of 40 W/cm2 (5 W, 4 mm diameter). Phantoms were irradiated with the same laser for durations of 10–80 s at a fluence of 3.8 W/cm2 (3 W, 10 mm diameter). These laser and nanoparticle parameters have been shown to produce significant cell death and thermal injury in cell monolayers [Citation22].
Viability measurements
Viability () was measured using the spatial phantom evaluation of cellular thermal response in layers (SPECTRL) method. This method uses custom-developed digital image analysis code created in LabVIEW (National Instruments, Austin, TX). Briefly, cells were stained with calcein AM and propidium iodide to distinguish live and dead cells respectively, and imaged with a Leica DMI-6000 B fluorescent microscope (Leica Microsystems, Buffalo Grove, IL). These images were then digitally analysed using a Prewitt edge detection algorithm, pixel intensity thresholding, and size thresholding to identify the number and location of live and dead cells. Due to high degrees of cell detachment in photothermally treated regions of cell monolayers which reached lethal temperatures, cells were stained with CellTracker blue (Invitrogen, Carlsbad, CA) and imaged to determine density before treatment. Areas of cell density below the pre-treatment density were assumed to be caused by dead cell detachment. By comparing the cell densities before and following treatment, the final viability could be determined.
Temperature measurements
Water bath temperature was verified with a digital traceable thermometer (Fisher Scientific, Pittsburgh, PA) and temperature was measured for photothermally treated samples () with a Thermovision A40 infrared camera (FLIR, Calgary, Canada).
Arrhenius parameters
Arrhenius parameters () of both cell monolayers and phantoms exposed to both constant temperature hot water bath heating and photothermal therapy were determined by fitting viability and temperature data to the Arrhenius model. The Arrhenius model states that the rate of cellular injury (Ω) is determined by
where τ is the duration of thermal exposure, A is the frequency factor, Ea is the activation energy, R is the universal gas constant (8.314 J·mol−1·K−1), T is temperature (Kelvin), and t is time. Percentage viability is related to Ω using the following equation [Citation23],
where Ω(τ) is cellular injury, τ is the duration of the temperature exposure, C(0) is the original percentage viability, and C(τ) is the final percentage viability after thermal treatment.
Arrhenius parameter determination
Arrhenius parameters () were determined by fitting viability predictions based on the values of Ea and A parameters to the measured viability response. The Arrhenius constants for the photothermally treated systems were obtained by first averaging the viability and temperatures in radial increments. This was done to minimise the impact of local variation in temperature and viability on the measured average. This generated a viability by radial distance array and a temperature by radial distance by time array. Thus, the viability response was predicted at each radial location, and error was calculated by adding the error at each radial location and duration. Values of A and Ea were iterated through, and combined with measured radial temperature to create radial viability response predictions. Ea was iterated from Ea = 1 × 10⁵ to 9 × 10⁵ in increments of 100, and A was incremented from A = 1 × 10⁵ to 1 × 10105 in increments of 10x where x iterated by 1 from 5 to 105. These ranges were based on previously defined ranges for Ea and A [Citation23]. The viability predictions made from each combination of Ea and A were then compared with the measured viability, and the error for each run was defined as
where Error(T) is the total error for the Arrhenius fit at a given temperature and duration, Vest is the viability estimated from Arrhenius parameters at each time point, and Vmeasured(t) is the average viability at each time point. Next, the error for each set of Ea and A parameters was added across all temperatures. The values of Ea and A which resulted in the smallest error across all temperatures were identified as the Arrhenius parameters.
Arrhenius parameters from non-spatial water bath heating viability data were determined from viability response as a function of heating duration. Arrhenius parameters from photothermal spatial viability data were determined from viability response as a function of radial distance from the point of laser irradiation.
Determination of 2D viability prediction using custom made LabVIEW modelling software
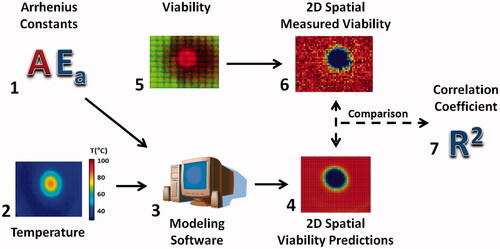
illustrates the method for comparing the spatial viability predictions from each set of Arrhenius parameters. Arrhenius parameters (1) and 2D spatio-temporal temperature profiles from photothermally treated phantoms (2) used modelling software (3) to create two-dimensional spatial viability predictions. Tiled fluorescent images from photothermally treated phantoms (4) were processed using the SPECTRL method to generate two-dimensional contours of the measured viability (4). The measured viability from the 3D phantoms (5) was then averaged along the z axis to create 2D viability contours (6). These viability contours were then compared to determine both the difference in the kill and transition zone area for each laser duration, as well as the correlation coefficient between each prediction and the original measured viability (7). This enabled verification of the ability of Arrhenius parameters determined from varying heating methods and cellular microenvironments to accurately predict the viability response in the most physiologically and clinically representative case investigated – photothermally treated phantoms. In addition, these comparisons demonstrate the ability of 2D and 3D viability measurement techniques to measure the difference between predicted and measured treatment areas.
Figure 2. Methodology used to obtain the spatial comparison between Arrhenius generated spatial viability predictions, and spatially measured viability response. Viability response and temperature profiles were fit with the Arrhenius model (1). The Arrhenius parameters Ea and A which best fit the system were identified as that system’s Arrhenius parameters. These Arrhenius parameters were combined with spatio-temporal temperature profiles (2) using custom modelling software (3) to generate spatial viability predictions (4). Meanwhile the original fluorescent images (5) were used to generate spatial viability contours (6). The difference between the 2D predicted viability contours and the measured viability were determined and used to generate correlation coefficients between each system and the measured viability (7).
Determination of kill and transition zone area and correlation coefficient for 2D viability contours
The comparison between photothermal viability responses in phantoms with Arrhenius viability predictions using Arrhenius parameters determined from each microenvironment and heating method was made using the difference between the area of kill and transition zone, and a correlation coefficient for each pairing of measured viability contour and predicted viability contour. The kill zone is defined as the area in which the percentage of viable cells is less than 1%. The transition zone is defined as the region between 1% and 66% viable cells. Batch variability was minimised by normalising the average viability of the untreated region in each phantom. The correlation calculation was performed in MATLAB (MathWorks), utilising the built-in function ‘corr2’, which generates a correlation coefficient for comparing two 2D arrays. The correlation coefficient r is defined as:
where A and B are matrixes of the same dimensions, and
and
are the means of the respective matrixes.
Results
Arrhenius model parameter fit: cell monolayers and phantoms with water bath heating
The Arrhenius parameters obtained from each experimental condition are listed in . Photothermally treated cell monolayers had the lowest values of Ea and A, while cell monolayers treated with hot water bath heating had the highest. The Arrhenius parameters found for each set of experimental conditions in this study closely fit the relationship between Ea and A described by Neil Wright of Ea = 2681ln(A) + 17529 (data not shown) [Citation34].
Table 1. Arrhenius parameters A and Ea determined for cell monolayers and phantoms undergoing constant temperature water bath and transient photothermal heating.
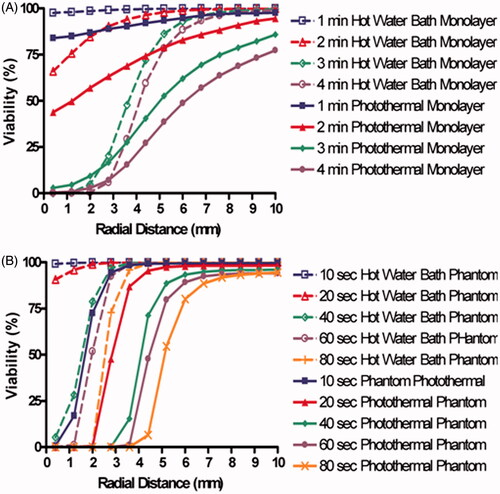
displays both the measured viability (solid lines) and viability determined from Arrhenius best fit parameters (dashed lines). Viability decreases with increasing heating duration, increasing temperature, and decreasing proximity to the centre of laser irradiation. shows the experimentally measured viability response of cell monolayers to 46°, 50°, and 54 °C water bath heating for durations ranging from 3 to 30 min. displays the viability response of cells suspended in phantom beads following constant temperature water bath heating at the same temperatures and durations as water bath heated monolayers. In both the reduction in percentage of viable cells with increasing heating duration is generally linear with higher temperatures, resulting in more rapid decreases in viability. (dashed lines) displays the Arrhenius model best fit to experimentally determined viability response using a least squares optimisation algorithm for all laser durations. After iterating through the values of A and Ea specified above, a best fit was determined and displayed in . These parameters result in Arrhenius predictions of viability with an average difference of 4% between the measured viability and Arrhenius fit viability prediction. , which shows the viability response and Arrhenius fit of phantom beads placed in constant temperature water baths. The best fit Arrhenius curves (dashed lines) result in an average difference of 3% between the measured viability and Arrhenius fit viability prediction. The viability of tissue phantoms was an average of 16% lower than the viability of cell monolayers. This may have been caused by a lower baseline viability of 90% in sodium alginate phantoms.
Figure 3. Viability measured response and predictions based on the best fit Arrhenius parameters for each experimental system. The four experimental conditions were (A) cell monolayers treated with constant temperature water bath heating, (B) sodium alginate phantom beads treated with constant temperature water bath heating, (C) cell monolayers treated with photothermal therapy and D) sodium alginate phantoms treated with photothermal therapy. Solid lines indicate measured viability response and dashed lines indicate Arrhenius parameters best fit.
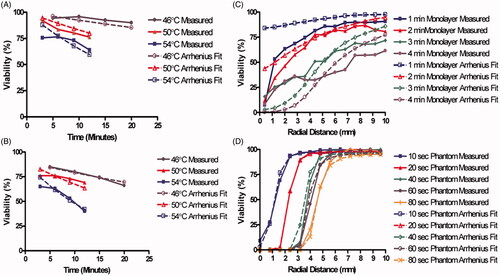
The viability response of cell monolayers () and tissue phantoms () to photothermal therapy were both determined as a function of radial distance from the centre of laser irradiation. For both cases the reduction in percentage of viable cells is largest close to the centre of irradiation, and the viability increased with greater radial distance from the laser source. Gradual decreases in percentage of viable cells in the monolayers correlated with decreases in radial temperature ranging from 2 °C/mm to 5.67 °C/mm at 1 and 4 min respectively. However, the photothermally treated phantoms did not experience convection, resulting in sharper radial temperature gradients ranging from 5.9 °C/mm to 42 °C/mm, 10 and 80 s, respectively. Sharper temperature gradients resulted in smaller transition zones for phantoms compared to cell monolayers when both were photothermally treated. The best fit Arrhenius parameters for the 2D photothermally treated monolayers are listed in . These parameters resulted in an average absolute difference of 16% between the measured and predicted viability response. These Arrhenius parameters resulted in an average difference of 2.5% between the measured and predicted viability response, indicating an acceptable fit of the Arrhenius model to the measured viability response.
Impact of cellular microenvironment on Arrhenius predictions of viability response
shows how the Arrhenius predicted viability responses for water bath heated cells were affected by the cellular micro-environmental change from cell monolayers to phantom beads. These predictions were both made using water bath temperature profiles. As expected, viability decreases with increasing temperature and exposure duration. The viability prediction from water bath heated phantom beads was an average of 6.4% and a maximum of 12.3% lower than the viability predictions generated using Arrhenius parameters from hot water bath heated cell monolayers.
Figure 4. Predicted viability response demonstrating the impact of cellular microenvironment on Arrhenius parameter generated viability predictions. (A) Arrhenius predictions of viability response to water bath heating for both cell monolayers and phantoms. (B) Arrhenius predictions of viability response to photothermal heating for both cell monolayers and phantoms.
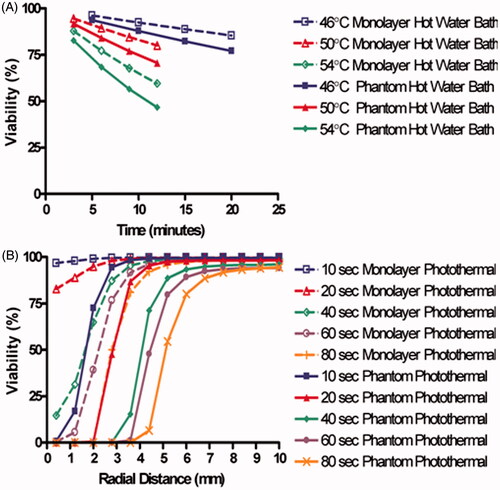
demonstrates how the Arrhenius-predicted viability response for photothermally heated cells is affected by the change from cell monolayers to phantoms using radial temperature profiles from the photothermally treated phantoms. Arrhenius predictions based on photothermally treated monolayers predicted higher viability by an average of 15.7% and a maximum of 96% when compared with predictions made using Arrhenius parameters from photothermally treated phantoms. These comparisons indicate that there is less difference between hot water bath treated cell monolayers and phantoms when compared with the difference between photothermally treated cell monolayers and phantoms.
Impact of heating method on Arrhenius predictions of viability response
The impact of heating method on Arrhenius viability predictions was determined by comparing the predicted viability response based on Arrhenius parameters derived from both cell monolayers and tissue phantoms exposed to water bath or photothermal heating. Each set of Arrhenius parameters was applied to the phantom photothermal heating temperature profile to generate a predicted viability response. displays the predicted viability response using Arrhenius parameters determined from hot water bath and photothermally heated cell monolayers using radial temperature profiles from photothermally treated cell monolayers. The predicted viability responses using Arrhenius parameters from cell monolayers heated with a water bath were an average of 11.7% and a maximum of 39.7% higher than that of the photothermally treated cell monolayer predictions. Viability predictions of hot water and photothermally heated monolayers crossed at 3 mm which corresponds with temperatures of approximately 65 °C.
Figure 5. Predicted viability for both cell monolayers and phantoms demonstrating the impact of heating method on Arrhenius parameter generated viability. (A) Viability predictions for both water bath and photothermal heating for cell monolayers using radial temperature obtained from photothermally treated cell monolayers. (B) Viability predictions for both water bath and photothermal heating for phantoms using radial temperature data obtained from photothermally treated phantoms.
compares the predicted viability response from Arrhenius parameters derived from water bath and photothermally treated phantoms using radial temperature profiles from photothermally heated phantoms. Arrhenius parameters for water bath heated phantoms predicted an average of 17.6% lower injury compared to those of photothermally treated phantoms, and a maximum difference of 98% at 20 s exposure, 2 mm. At temperatures higher than 62 °C both water bath and photothermally treated phantom viability predictions were 0%. Both Arrhenius parameter predictions for monolayers and phantoms indicated that the heating method can have a significant impact on the predicted viability. In this case, hot water bath Arrhenius parameters typically under-predict the rate of injury when applied to photothermally treated systems. Combined with the results from , it can be concluded that cellular microenvironment had a minimal impact on the Arrhenius viability prediction when applied to water bath heating. Changing cellular microenvironment in photothermally treated systems resulted in larger changes in Arrhenius parameters than in water bath heated systems. Of all the heating methods and microenvironments investigated, the difference between the viability response for hot water bath and photothermally treated phantoms is the largest. These conclusions suggest that the impact of microenvironment on Arrhenius viability predictions may be slightly less than the impact of heating method. They also suggest that photothermal therapy of phantoms results in the highest rates of viability reduction of any of the microenvironments or heating methods tested.
Sensitivity analysis
The value of Ea could vary by up to 1% without increasing the average difference between the predicted and measured viability by more than 10%. Variations in A of 10% varied the calculated value of Ω by 10%, but A could vary by an order of magnitude before increasing the average difference between the predicted and measured viability to this degree. It is worth noting that the sensitivity of the predicted viability to variations in Ea is a function of temperature as well as the magnitude of the change in Ea, meaning viability predictions are more sensitive to slight changes in Ea at lower temperatures. Additionally, small changes in the value of Ea can have an impact which is not proportional to the ratio of the change to the original value of Ea. The sensitivity of Ω to A, however, is a linearly scaling relationship.
Comparing the reaction rates, k, between different heating methods and microenvironments
The rate of Arrhenius-predicted injury can be represented by the rate of reaction according to the following equation:
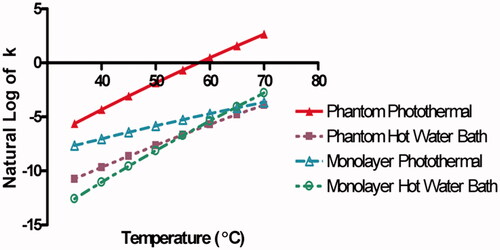
[Citation23] where k is the reaction rate constant with units of seconds−1, Ea and A are the Arrhenius parameters, R is the universal gas constant, and T is temperature. Higher values of k indicate faster rates of reaction, or injury in biological systems. displays the natural log of k as a function of temperature determined from the Arrhenius parameters for each set of experimental conditions, allowing for a direct comparison of the reaction rates for each heating method and microenvironment tested. At 40 °C the reaction rates of photothermally treated phantoms (red line) are the highest, followed by photothermally treated cell monolayers (teal line), hot water bath heated phantom beads (purple line), and hot water bath heated cell monolayers (green line) respectively. The reaction rates of water bath heated phantoms and monolayers cross at approximately 56 °C, and the reaction rates of hot water bath and photothermally heated monolayers cross at approximately 65 °C. This matches the cross-over point at 65 °C (3 mm) observed in . At temperatures between 37 °C and 45 °C the reaction rates for photothermally heated phantoms and monolayers were closer to each other than water bath heated phantoms and monolayers. However, the reaction rate for photothermally treated cell monolayers becomes more similar to water bath heating reaction rates as the temperature increases. This suggests that photothermally treated monolayers experience a rate of viability loss increasingly similar to water bath heating as the temperature approaches 65–70 °C. Thus, the rates of viability loss for photothermally heated monolayers, and water bath heated monolayers and phantoms, are roughly equivalent between 65° and 70 °C. The rate of cellular injury caused in photothermally heated phantoms is higher than the other systems across all investigated temperatures. These results agree with conclusions obtained from and . First, the least difference existed between water bath heated monolayer and phantom reaction rates. Second, heating method had a larger impact on Arrhenius parameters than cellular microenvironment. Third, photothermally heated phantoms exhibited the highest rates of cellular injury.
Figure 6. Temperature as a function of the Natural Log of the rate reaction constant k. Photothermally treated phantom (red line), photothermally treated cell monolayer (blue line), water bath heated phantom bead (purple line), and hot water bath heated cell monolayer (green line) reaction rates as a function of temperature calculated from the Arrhenius parameters Ea and A obtained above.
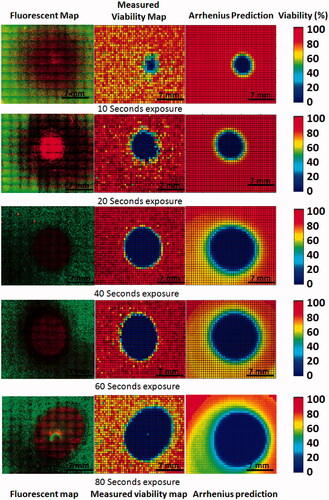
demonstrates how measured viability response compares with Arrhenius model predicted responses. In the left column fluorescence image mosaics of phantoms exposed to a concentration of 0.085 mg/mL SWNHs for 10 to 80 s of NIR laser irradiation at a fluence of 3.8 W/cm2 are displayed, with dead cells stained by propidium iodide fluorescing red, and live cells stained with calcein AM fluorescing green. Using the SPECTRL digital image analysis method, these image mosaics were converted into 2D digital viability contours ( centre). These viability contours were spatially correlated with 2D temperature profiles. Using the Arrhenius parameters determined from overlays of spatial temperature and viability data, 2D transient temperature profiles were combined with Arrhenius parameters using previously described equations to create 2D viability predictions ( right). These viability responses and Arrhenius predictions demonstrate how similar the Arrhenius predictions are to the measured viability response overall, while neglecting viability fluctuations in untreated regions.
Figure 7. Comparison of measured viability response with 2D Arrhenius predictions made using calculated Arrhenius parameters at 10, 20, 40, 60, and 80 s of laser irradiation. (Left) Fluorescent image mosaics of viability response in tissue phantoms. (Centre) Measured 2D viability response averaged across all focal depths. (Right) Arrhenius model prediction based on 2D measured spatio-temporal temperature profile.
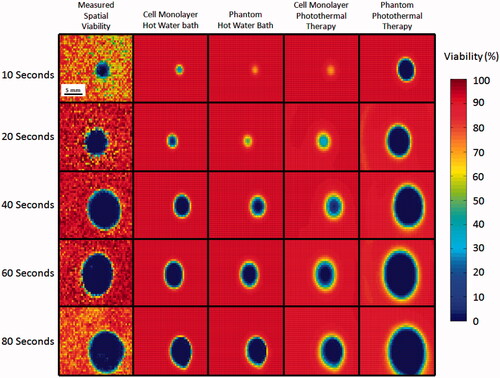
compares the spatial viability predictions using Arrhenius parameters from the water bath heated monolayers, photothermally heated monolayers, water bath heated phantoms, and photothermally heated phantoms using spatio-temporal temperature profiles of photothermally heated phantoms. Each of these predictions is also compared with the measured viability response determined for photothermally heated phantoms (, column 1). This allows for the spatial viability predictions made using each of the Arrhenius parameters and the differences between viability predictions made with spatial and non-spatial viability measurement tools to be quantified. Predicted kill zone area (area in which viability is less than 1%) increases for each set of Arrhenius parameter viability predictions with increasing irradiation duration. Viability predictions using Arrhenius parameters from cell monolayers exposed to water bath heating (, column 2), phantoms exposed to water bath heating (, column 3), and cell monolayers treated with photothermal therapy (, column 4) all under estimate the size of the kill zone by 10 mm2 and 20 mm2 at 10 and 20 s of laser irradiation, respectively. As expected, the viability prediction based on Arrhenius parameters for the photothermally treated phantoms (, column 5) fits the measured viability most precisely, with the difference between the predicted and measured kill zone area ranging from 6 to 24% of the measured value above 10 s.
Figure 8. Comparison of Arrhenius model predictions using spatial photothermal phantom temperature data to create 2D viability response predictions and measured viability response in a photothermally treated phantom. Measured 2D viability responses (column 1) indicate larger areas of viability reduction with increasing duration of laser irradiation. Corresponding predictions using Arrhenius parameters from 2D temperature profiles using Arrhenius parameters derived from 2D cell monolayers in water baths (column 2), tissue phantoms in water baths (column 3), photothermally treated cell monolayers (column 4), and photothermally treated phantoms (column 5) are displayed for comparison.
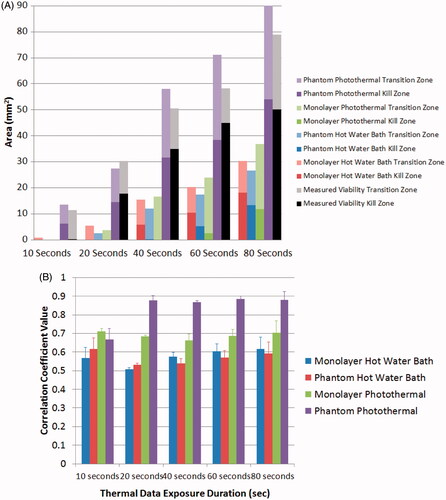
displays the kill and transition zone area for each of the predicted viability responses in . By comparing the measured and predicted kill and transition zones, quantifies the spatial error caused by using Arrhenius parameters not derived from photothermally treated phantoms to predict the viability loss in a photothermally treated phantom. It also quantifies the error associated with applying Arrhenius parameters derived from radially averaged photothermally heated phantom viability responses to measured 2D spatial viability data. The water bath treated cell monolayer, water bath treated phantom, and photothermally treated monolayer predicted kill zone areas that were on average 23 mm2, 26 mm2, and 27 mm2 less than the measured viability responses of photothermally treated phantoms, respectively. The Arrhenius prediction for photothermally treated phantoms created a much more accurate prediction of the kill zone, which was on average 0.7 mm2 smaller than the measured kill zone area. The viability predictions based on Arrhenius parameters for photothermally treated phantoms overestimated the size of the transition zone by an average of 8 mm2. However, Arrhenius predictions for the water bath heated monolayer, water bath heated phantom, and photothermally heated monolayer were 8.7 mm2, 8.26 mm2, and 2.85 mm2 lower than the measured transition zone areas. This quantitative comparison of the transition zone areas is only possible using quantitative spatial measurements which can measure precise changes in the reduction of the percentage of viable cells. quantifies the accuracy between the predicted 2D viability losses using Arrhenius parameters (, columns 2–5) and the measured 2D viability response to photothermal therapy (, column 1) using matrix correlation coefficients. Water bath heated monolayers, water bath heated phantoms, and photothermally treated monolayers have average correlation coefficients of 0.59, 0.58, and 0.71 respectively. The average correlation coefficient between the measured photothermally treated phantom and the prediction using photothermally treated phantom Arrhenius parameters is 0.86. This quantitative assessment demonstrates that Arrhenius parameters derived from phantom photothermal therapy measurements create more accurate spatial viability loss predictions compared to Arrhenius parameters calculated from dissimilar experimental conditions. In addition, while the Arrhenius parameters calculated from radial data had an extremely close fit to the measured radial data (R2 = 0.99, , point 4) the correlation decreases when Arrhenius parameters from a 1D system are used to predict the response in a 2D system.
Figure 9. Quantitative analysis of the accuracy of Arrhenius parameters from each cellular microenvironment and heating method to predict the viability response in photothermally treated phantoms. (A) Kill and transition zone area for each viability response prediction, as well as the measured viability. Standard deviation for Arrhenius prediction and viability kill zones were 1 mm2 and 2.6 mm2 respectively. Standard deviation for Arrhenius prediction and viability transition zones were 1.2 mm2 and 5.3 mm2 respectively. (B) Comparison of correlation coefficients between 2D Arrhenius predictions for each set of experimental conditions and the measured 2D viability response of cells in tissue phantoms in response to photothermal therapy. Error bars indicate one standard deviation (n = 3).
Discussion
The Arrhenius injury model may be used to plan thermal therapies by predicting the injury response to candidate protocols. Many experimental systems including tissue slices, in vivo experiments, and cell monolayers can be used to derive Arrhenius parameters for tissue viability response to hyperthermia [Citation4,Citation6,Citation14,Citation35]. Methods of thermal stimulation include heating plates, hot wire probes, water bath heating, photothermal therapy, microwaves, and ultrasonic heating [Citation4,Citation10,Citation11,Citation14,Citation28,Citation36,Citation37]. Research indicates that parameters such as peak temperature, heating rate, heating method, cell suspension, and viability measurement method impact determination of Arrhenius parameters [Citation8,Citation11,Citation14,Citation34]. Therefore, it is reasonable to assume that therapy-representative heating methods, physiologically representative experimental models, and cell viability analysis methods that best capture the viability response to spatial heating dynamics of the system will generate more accurate Arrhenius parameters compared to models which are insufficiently representative, and viability assessment tools which neglect spatial dynamics. In this study, the comparative impact of heating method and cellular microenvironment on Arrhenius parameters and their subsequent viability predictions provides insight into the influence of photothermal heating and cell microenvironment on cellular response to hyperthermia.
Determination of Arrhenius parameters using in vivo tissue frequently relies on histological interpretation or metabolic assays such as triphenyl tetrazolium chloride (TTC) assays [Citation10,Citation38]. These methods of viability assessment typically identify a viability threshold marker such as collagen coagulation or macroscopic tissue staining which makes measuring the transition zone difficult. Precise measurement of individual cell viability in tissue sections has been conducted by Bhomick et al. using fluorescent viability assays, such as ethidium homodimer, on sectioned tissue [Citation5]. However, this method would be extremely time-consuming if used to obtain detailed spatial viability information over a large volume. This motivates precise and rapid quantitative spatial measurement methods in systems which are sufficiently representative of tissue such as tissue phantoms. This paper utilised quantitative image analysis to determine spatial viability in cell monolayers and tissue phantoms, as well as the influence of heating method and microenvironment on Arrhenius parameters.
Varying the heating method and cellular microenvironment significantly impacted the Arrhenius parameters and resulting viability predictions. Differences between measured and predicted viability response were as high as 98% when comparing predictions from water bath and photothermally heated phantoms in the transition zone. Variation in heating method resulted in approximately 10% greater difference in average viability predictions than changes in cellular microenvironment (). However, Arrhenius parameters determined from water bath heating showed only a 6.4% average difference in viability prediction due to changes in cellular microenvironment () compared with cases of photothermal heating that experienced an average difference of 15.7% viability caused by changes in the cellular microenvironment (). Arrhenius parameters determined by photothermally heating phantoms predicted the highest rates of cellular injury of all the heating methods and microenvironments (). This viability variation is similar to variations of up to 20% observed by Shah et al. between cell monolayers and cellular suspensions heated with a heating stage [Citation8].
Analysis of the relationship between the reaction rate constant (k) and temperature indicates that as temperature increases, the reaction rate of photothermally treated cell monolayers becomes increasingly similar to water bath heated cell monolayers as compared to photothermally heated phantoms (). One possible explanation for this phenomenon is that photothermally treated cell monolayers reaching temperatures above 50 °C were experiencing convective flow, which may create a heating situation more similar to water bath heating as compared to photothermally treated phantoms (which experienced rapid rates of heating and were cooled by conduction). The range of k values presented falls within the typical range calculated from Arrhenius parameters in previous work. For example, at 50 °C the ln(k) value for AT-1 prostate tumour cell monolayers stained with calcein AM is −5.6 [Citation24], −2.04, and −1.94 for AT-1 tissue slices heated above and below 50 °C [Citation5] respectively, −5.08 and −5.14 for PC3 cells heated above and below 54 °C [Citation14], −4.04 and −5.19 for RWPE-1 normal prostate cells heated above and below 54 °C [Citation14]; and −9.45 for HepG2 cell monolayers heated at 525 °C/s and reaching peak temperatures between 60 °C and 70 °C [Citation8]. This range of ln(k) values spans the minimum and maximum values for ln(k) presented in our research of −8.13 to −1.86.
and demonstrate how quantitative viability measurements enable the accuracy of spatial viability response predictions based on Arrhenius parameters to be quantified. This assessment determined the effectiveness of viability predictions from Arrhenius parameters derived from systems which were dissimilar to the system of interest by either cellular microenvironment or heating method. Arrhenius parameters from water bath heated monolayers, water bath heated phantoms, and photothermally heated monolayers under-predicted the kill zone area of photothermally treated phantoms by an average of 23–27 mm2, or 64–94% of the measured kill zone area. The viability predictions of the kill zone using Arrhenius parameters determined from photothermally treated phantoms had a peak area error of 6.5 mm2, and a median error of 12%. Viability predictions of the kill zone using Arrhenius parameters with different heating methods or cellular microenvironments had a peak area error of 42 mm2, and a median error of 91%. This means that using Arrhenius parameters from systems with different heating methods or cellular microenvironments to predict the kill zone in photothermally treated phantoms resulted in median error increase of 79%. Viability predictions of the transition zone based on Arrhenius parameters derived from photothermally treated phantoms overestimated the transition zone by an average of 8 mm2, or 46% of the measured transition zone. This error was similar in magnitude to the under-prediction of the transition zone from the other experimental cases, which were on average between 23–54% less than the measured transition zone. This could be caused by cellular repair mechanisms reducing the transition zone in ways that the Arrhenius model does not account for, such as the induction of heat shock proteins. Similar work with computational predictions of Arrhenius parameters for photothermal therapy resulted in up to 29-fold overestimations of injury for longer durations of irradiation, and up to 8-fold underestimation of damage for short durations of irradiation by using Arrhenius parameters which were taken from a different source and ‘based on differing assumptions about tissue type and geometry’ [Citation39, p. 3068]. These differences between predicted and measured viability response suggest that careful selection of appropriate experimental conditions are important for accurately predicting viability response.
The presented Arrhenius parameters closely fit the function Ea = 2681ln(A) + 17529 identified by Wright, which describes the relationship between Ea and A for most biological systems [Citation34]. In addition, the values and ranges of Arrhenius parameters in our study are similar to other studies. For example, the Ea values for water bath heated and photothermally heated cell monolayers presented are 246 000 J/mol and 100 700 J/mol respectively. These are similar to the values of Ea determined by Rylander et al. of 238 000 J/mol and 249 000 J/mol for PC3 prostate cancer and RWPE-1 normal prostate cells heated with a water bath for temperatures below 54 °C and 124 000 J/mol and 58 000 J/mol respectively for temperatures above 54 °C [Citation14]. The values of A reported in our study range from 5.62 × 10¹³ s−1 to 5.62 × 10¹³ s−1, which are similar to the range of A values determined by Rylander et al. of 5.67 × 10⁷ s−1 to 1.03 × 1038 s−1 for the same cell types and heating temperatures [Citation14].
Some of the differences in the Arrhenius parameters for water bath and photothermally heated monolayers could be caused by differences in the maximum temperatures of 54 °C and 73 °C achieved. Varying temperature can result in different mechanisms of thermal injury depending on the duration, as observed by Rylander et al. [Citation14]. However, it is unlikely that the difference in the photothermal and water bath heating Arrhenius parameters is caused only by variation in peak temperature, for the following reason: Arrhenius parameter changes caused only by differences in temperature exhibit reaction rate cross-over points at the approximate temperature where the Arrhenius parameter fits converge. For example, shows the natural log of the reaction rate k using the Arrhenius parameters determined by Rylander et al. for water bath heating at temperatures above and below 54 °C [Citation14]. The predicted reaction rates for RWPE-1 and PC3 cell lines above and below 54 °C converge at temperatures between 50 °C and 55 °C. However, the reaction rates for water bath and photothermally treated phantoms do not converge at any temperatures above 37 °C, indicating that there is no temperature junction between the two Arrhenius fits (). This suggests that there is a factor other than peak temperature responsible for Arrhenius parameter variation between water bath and photothermally heated phantoms.
Figure 10. Reaction rate, k, as a function of temperature for in vitro water bath heated RWPE-1 and PC3 cell lines based on Arrhenius parameters determined by Rylander et al. [Citation14]. This figure demonstrates the reaction rate transition between two sets of Arrhenius parameters fit to two different temperature ranges for the same system. The k value displayed is based on Arrhenius parameters determined for water bath temperatures below 54 °C (solid lines) and temperatures above 54 °C (dashed lines). The intersection between the Arrhenius predictions (denoted by the intersection between the dashed and solid lines) indicates the transition between the two Arrhenius fits.
![Figure 10. Reaction rate, k, as a function of temperature for in vitro water bath heated RWPE-1 and PC3 cell lines based on Arrhenius parameters determined by Rylander et al. [Citation14]. This figure demonstrates the reaction rate transition between two sets of Arrhenius parameters fit to two different temperature ranges for the same system. The k value displayed is based on Arrhenius parameters determined for water bath temperatures below 54 °C (solid lines) and temperatures above 54 °C (dashed lines). The intersection between the Arrhenius predictions (denoted by the intersection between the dashed and solid lines) indicates the transition between the two Arrhenius fits.](/cms/asset/827a8de8-b0a9-4a34-bfc0-d0e1450ebcfc/ihyt_a_802375_f0010_b.jpg)
Many papers have investigated experimental factors which alter cellular response to heating, including heating rate, temperature range, single treatment versus multiple treatments, viability assays, and the presence of heat shock proteins (HSPs) [Citation8,Citation16,Citation34]. The Ea values for 43 °C water bath heated HSP-activated and non-HSP-activated Morris hepatoma cells were approximately 163 000 J/mol and 257 000 J/mol, which is similar to the difference between hot water bath and photothermally treated cell monolayers in our study [Citation40]. These differences are smaller than those exhibited between AT-1 cell cultures analysed with calcein AM and clonogenics, which had Ea values of 81 330 J/mol and 506 000 J/mol respectively [Citation24]. These Arrhenius parameter differences are similar in magnitude to the differences in our study caused by variation in cellular microenvironment and heating method. Pearce et al. described how pig skin exposed to laser heating resulted in the formation of purpuras (purple discoloration caused by sub-dermal bleeding), while surface contact with heated water resulted in blisters due to the extravasation of blood plasma [Citation11,Citation41]. In order to reduce the number of potential variables which may have influenced viability response, the presented research did not use multiple treatments, varying viability assays, or varying cell types. Our methodology avoided heating cells prior to treatment to prevent premature HSP activation. While heating rate may have contributed to the differences in observed Arrhenius parameters between the water bath and photothermal experiments, the variations in activation energy determined in our study are larger than those previously determined for heating rates ranging from 100 °C/min to 525 °C/min [Citation8]. This, combined with the absence of a cross-over point between water bath and photothermally heated phantoms, suggests that the differences in Arrhenius parameters for phantoms are not caused by changes in heating rate or peak temperature alone. Differences in the viability response between photothermally treated phantoms and other heating methods and cellular microenvironments could be caused by variation in protein expression, cell signalling, morphology affected by the 3D microenvironment [Citation42,Citation43], or a chemical reaction resulting from laser irradiation of nanoparticles. Variation in viability predictions resulting from changes in experimental conditions emphasises the importance of using representative microenvironments and heating methods, while utilising precise quantitative spatial viability measurements for the determination of accurate Arrhenius parameters.
Conclusions
Viability predictions resulting from Arrhenius parameters varied with heating method and cellular microenvironment, with the largest impact resulting from changes in heating method. Arrhenius parameters derived from different heating methods or cellular microenvironments resulted in significant spatial error when making predictions of the expected viability response for photothermal therapy. Therefore, it is necessary to determine Arrhenius parameters from thermally and biologically representative systems to accurately predict viability loss. This study demonstrates the ability of Arrhenius parameters calculated from data gathered using the SPECTRL method to improve predictions of spatial viability loss, and could improve the clinical application of therapies developed in the laboratory.
Declaration of interest
The authors report no conflicts of interest. The authors alone are responsible for the content and writing of the paper.
Related Research Data
References
- Whitney JR, Sarkar S, Zhang J, Do T, Young T, Manson MK, et al. Single walled carbon nanohorns as photothermal cancer agents. Lasers Surg Med 2011;43:43–51
- Zhou F, Xing D, Ou Z, Wu B, Resasco DE, Chen WR. Cancer photothermal therapy in the near-infrared region by using single-walled carbon nanotubes. J Biomed Opt 2009;14:021009
- Hirsch LR, Stafford RJ, Bankson JA, Sershen SR, Rivera B, Price RE, et al. Nanoshell-mediated near-infrared thermal therapy of tumors under magnetic resonance guidance. Proc Natl Acad Sci 2003;100:13549–54
- Bhowmick P, Coad JE, Bhowmick S, Pryor JL, Larson T, De La Rosette J, et al. In vitro assessment of the efficacy of thermal therapy in human benign prostatic hyperplasia. Int J Hyperthermia 2004;20:421–39
- Bhowmick S, Coad JE, Swanlund DJ, Bischof JC. In vitro thermal therapy of AT-1 Dunning prostate tumours. Int J Hyperthermia 2004;20:73–92
- Diller KR, Pearce JA. Issues in modeling thermal alterations in tissues. Ann NY Acad Sci 1999;888:153–64
- Rylander MN, Feng Y, Bass J, Diller KR. Thermally induced injury and heat-shock protein expression in cells and tissues. Ann NY Acad Sci 2006;1066:222–42
- Shah B, Bhowmick S. Evaluation of important treatment parameters in supraphysiological thermal therapy of human liver cancer HepG2 cells. Ann Biomed Eng 2006;34:1745–57
- Ryan TP, Pearce JA. Relationship between Arrhenius models of thermal damage and the CEM 43 thermal dose. Proc SPIE 2009;7181:718104–15
- Peters D, Chan R, Trachtenberg J, Jothy S, Kapusta L, Kucharczyk W, et al. Magnetic Resonance Thermometry for Predicting Thermal Damage: An Application of Interstitial Laser Coagulation in an in vivo Canine Prostate Model. Baltimore, MD: Williams & Wilkins, 2000, pp 44
- Pearce JA, Cheong W-F, Pandit K, Mcmurray TJ, Thomsen SL. Kinetic models for coagulation processes: Determination of rate coefficients in vivo. Proceedings of SPIE 1991;1422:27–33
- Rylander MN, Feng Y, Bass J, Diller KR. Heat shock protein expression and injury optimization for laser therapy design. Lasers Surg Med 2007;39:731–46
- Beckham JT, Mackanos MA, Crooke C, Takahashi T, O'Connell-Rodwell C, Contag CH, et al. Assessment of cellular response to thermal laser injury through bioluminescence imaging of heat shock protein 70. Photochem Photobiol 2004;79:76–85
- Rylander MN, Feng Y, Zimmermann K, Diller KR. Measurement and mathematical modeling of thermally induced injury and heat shock protein expression kinetics in normal and cancerous prostate cells. Int J Hyperthermia 2010;26:748–64
- Yarmolenko PS, Moon EJ, Landon C, Manzoor A, Hochman DW, Viglianti BL, et al. Thresholds for thermal damage to normal tissues: An update. Int J Hyperthermia 2011;27:320–43
- Sapareto SA, Dewey WC. Thermal dose determination in cancer therapy. Int J Radiat Oncol Biol Phys 1984;10:787–800
- He X, Bhowmick S, Bischof JC. Thermal therapy in urologic systems: A comparison of arrhenius and thermal isoeffective dose models in predicting hyperthermic injury. J Biomech Eng 2009;131:074507
- Feng YS, Oden JT, Rylander MN. A two-state cell damage model under hyperthermic conditions: Theory and in vitro experiments. J Biomech Eng 2008;130:041016
- Huang HC, Rege K, Heys JJ. Spatiotemporal temperature distribution and cancer cell death in response to extracellular hyperthermia induced by gold nanorods. ACS Nano 2010;4:2892–900
- Griffith LG, Swartz MA. Capturing complex 3D tissue physiology in vitro. Nat Rev Mol Cell Biol 2006;7:211–24
- Yamada KM, Cukierman E. Modeling tissue morphogenesis and cancer in 3D. Cell 2007;130:601–10
- Whitney JR, Rodgers A, Harvie E, Carswell WF, Torti S, Puretzky A, et al. Spatial and temporal measurements of temperature and cell viability in response to nanoparticle-mediated photothermal therapy. Nanomedicine 2012;7:1729–42
- Thomsen S, Pearce JA. Thermal damage and rate processes in biologic tissues. In: Welch AJ, Gemert MJC, editors. Optical Thermal Response of Laser Irradiated Tissue, Amsterdam: Springer Netherlands, 2011, pp 487–549
- Bhowmick S, Swanlund DJ, Bischof JC. Supraphysiological thermal injury in Dunning AT-1 prostate tumor cells. J Biomech Eng 2000;122:51–9
- Huang XH, El-Sayed IH, Qian W, El-Sayed MA. Cancer cell imaging and photothermal therapy in the near-infrared region by using gold nanorods. J Am Chem Soc 2006;128:2115–20
- Hirsch LR, West JL, Stafford RJ, Bankson JA, Sershen SR, Price RE, et al. Nanoshell-mediated near infrared photothermal tumor therapy. In: Engineering in Medicine and Biology Society, 2003. Proceedings of the 25th Annual International Conference of the IEEE, 17-21 September, 2003, vol 2, pp 1230–1
- Burke A, Ding X, Singh R, Kraft RA, Levi-Polyachenko N, Rylander MN, et al. Long-term survival following a single treatment of kidney tumors with multiwalled carbon nanotubes and near-infrared radiation. Proc Natl Acad Sci 2009;106:12897–902
- Sherar MD, Moriarty JA, Kolios MC, Chen JC, Peters RD, Ang LC, et al. Comparison of thermal damage calculated using magnetic resonance thermometry, with magnetic resonance imaging post-treatment and histology, after interstitial microwave thermal therapy of rabbit brain. Phys Med Biol 2000;45:3563
- Sarkar S, Fisher J, Rylander C, Rylander MN. Photothermal response of tissue phantoms containing multi-walled carbon nanotubes. J Biomech Eng 2010;132:044505
- Smidsrød O, Skjåk-Braek G. Alginate as immobilization matrix for cells. Trends Biotechnol 1990;8:71–8
- Torti SV, Byrne F, Whelan O, Levi N, Ucer B, Schmid M, et al. Thermal ablation therapeutics based on CNx multi-walled nanotubes. Int J Nanomed 2007;2:707–14
- Gannon CJ, Cherukuri P, Yakobson BI, Cognet L, Kanzius JS, Kittrell C, et al. Carbon nanotube-enhanced thermal destruction of cancer cells in a noninvasive radiofrequency field. Cancer 2007;110:2654–65
- Loo C, Lowery A, Halas N, West J, Drezek R. Immunotargeted nanoshells for integrated cancer imaging and therapy. Nano Lett 2005;5:709–11
- Wright NT. On a relationship between the Arrhenius parameters from thermal damage studies. J Biomech Eng 2003;125:300–304
- Bhowmick DJS, Coad JE, Lulloff L, Hoey MF, Bischof JC. Evaluation of thermal therapy in a prostate cancer model using a wet electrode radiofrequency probe. J Endourol 2004;15:629–40
- Gayzik FS, Scott EP, Loulou T. Experimental validation of an inverse heat transfer algorithm for optimizing hyperthermia treatments. J Biomech Eng 2006;128:505–15
- Chun-Yen L, Kruse DE, Stephens DN, Sutcliffe PL, Ferrara KW. Simulation and phantom validation of mild hyperthermia produced by a dual function ultrasound linear array. IEEE Ultrason Symp 2010;2010:2270–3
- Chang I, Nguyen U. Thermal modeling of lesion growth with radiofrequency ablation devices. Biomed Eng Online 2004;3:27
- Denton ML, Foltz MS, Estlack LE, Stolarski DJ, Noojin GD, Thomas RJ, et al. Damage thresholds for exposure to NIR and blue lasers in an in vitro RPE cell system. Invest Ophthalmol Vis Sci 2006;47:3065–73
- Landry J, Chrétien P. Relationship between hyperthermia-induced heat-shock proteins and thermotolerance in Morris hepatoma cells. Can J Biochem Cell Biol 1983;61:428–37
- Moritz AR, Henriques FC. Studies in thermal injury II: The relative importance of time and temperature in the causation of cutaneous burns. Am J Pathol 1947;23:695–720
- Fischbach C, Chen R, Matsumoto T, Schmelzle T, Brugge JS, Polverini PJ, et al. Engineering tumors with 3D scaffolds. Nat Methods 2007;4:855–60
- Szot CS, Buchanan CF, Freeman JW, Rylander MN. 3D in vitro bioengineered tumors based on collagen I hydrogels. Biomaterials 2011;32:7905–12