
Abstract
Purpose: Silver nanoparticles (Ag NP) can generate heat upon exposure to infrared light. The in vitro response of breast cell lines to Ag NP, both with and without nanoparticle-induced heating was evaluated.
Materials and methods: Ag NP heat generation, intracellular silver concentration, and cell viability of MDA-MB-231, MCF7, and MCF 10A breast cells with Ag NP alone, or after exposure to 0.79 or 2.94 W/cm2 of 800 nm light were evaluated.
Results: The concentration of Ag NP to induce sufficient heat for cell death, upon exposure to 800 nm light, was 5–250 μg/mL. Clonogenics assay indicates a cytotoxic response of MCF7 (45% decrease) and MDA-MB-231 (80% decrease) cells to 10 µg/mL, whereas MCF 10A had a 25% increase. Without Ag NP, MDA-MB-231 cells were more susceptible to hyperthermia, compared to MCF7 and MCF 10A cells. Clonogenics assay of Ag NP-induced photothermal ablation demonstrated that MCF 10A cells have the highest survival fraction. MCF7 cells had more silver in the cytoplasm, MDA-MB-231 cells had more in the nuclei, and MCF 10A cells had equivalent concentrations in the cytoplasm and nuclei.
Conclusions: Ag NP are effective photothermal agents. A secondary benefit is the differential response of breast cancer cells to Ag NP-induced hyperthermia, due to increased intracellular silver content, compared to non-tumorigenic breast epithelial cells.
Introduction
Noble metals such as silver and gold have been widely used in medicine, and silver has unique properties that may be advantageous for treating cancer. Silver is more reactive in an oxygen rich environment and is used as an antibacterial agent to treat burns as well as acute and chronic wounds [Citation1–3]. In non-infected chronic wounds silver nanoparticles have been shown to aid wound healing by decreasing the presence of inflammatory cells and increasing fibroplasia [Citation4–7]. Silver nanoparticles have also been shown to inhibit angiogenesis and decrease matrix metalloproteases 2 and 9, which could prevent metastasis [Citation3,Citation5,Citation8,Citation9].
Photothermal therapy represents an alternative clinical approach for treating breast cancer. Specific nanoparticles such as gold nanoshells and nanorods, as well as carbon nanotubes, have previously been shown to generate a significant amount of heat when exposed to infrared radiation [Citation10–16]. The plasmon resonance (collective oscillation of electrons) of Ag NP can be tuned to infrared, similar to gold [Citation17,Citation18]. The frequency of the resonance can be observed as the optical absorption or extinction (and hence the colour of a dispersed solution of nanoparticles), and the resonance leads to heating. Most silver nanoparticles used in medicine are spherical, which have a plasmon resonance near 410 nm. By altering the shape and size of the Ag NP, the plasmon resonance can be tuned to infrared. In this study, silver nanoparticles were tailored to have a triangular shape, with a subsequent shift of their absorption to around 800 nm. However, the corners of the particles are highly susceptible to oxidation, which can lead to blue-shifting of the absorption and render the particles inadequate for photothermal therapies. The biocompatible polymer chitosan was used to stabilise the Ag NP while simultaneously reducing their cytotoxicity by inhibiting release of silver ions. Ag NP have only recently begun to be explored for use as photothermal agents, and the optimal concentrations for heating have not yet been demonstrated.
Intracellular silver ions can disrupt cellular metabolism, or decrease mitochondrial membrane potential, leading to apoptosis [Citation6,Citation19,Citation20]. If Ag NP preferentially migrate to the nucleus they may offer a significant advantage for localised hyperthermia to sensitise the cells to DNA damage from applied ionising radiation or chemotherapeutic agents. In the present work the amount of silver in both the cytoplasm and nucleus of breast cell lines was quantified. To our knowledge, this is the first time that the localised intracellular concentration of silver from Ag NP has been determined. The major impact of this work is to demonstrate the benefit of using Ag NP to treat breast cancer based on two important findings: (1) Ag NP are more cytotoxic to MCF7 and MDA-MB-231 cells at low concentrations, and (2) Ag NP are effective photothermal agents for killing breast cancer cells.
Materials and methods
Synthesis of chitosan-stabilised silver nanoparticles
Trisodium citrate (TSC), high molecular weight chitosan flakes (75% deacetylated), polyvinylpyrrolidone (PVP), ascorbic acid, and sodium borohydride (NaBH4) were purchased from Sigma Aldrich (St Louis, MO). Acetic acid was purchased from Fisher Scientific (Waltham, MA) and silver nitrate (AgNO3) was purchased from EMD Chemical (Philadelphia, PA). Solutions were prepared using ultrapure de-ionised (DI) water with a resistivity of at least 18.2 MΩ-cm.
Silver nanoparticles were grown using a seed-mediated synthesis, similar to previously published literature [Citation17]. To prepare seed, 1 mL TSC (30 mM), 2 mL AgNO3 (5 mM), and 1 mL NaBH4 (100 mM) were added, in order, to 95 mL of DI, while the solution was stirred rapidly. After 45 s, 1 mL PVP (2 M) was added to the solution.
To prepare nanoparticles using the seed, 200 μL TSC (116.4 mM), 50 μL ascorbic acid (300 mM), and 600 μL of seed were added to 30 mL of chitosan solution (1% chitosan in 2% acetic acid), while the solution was stirred rapidly. AgNO3 (300 µL, 30 mM) was added drop wise. The total time for adding the AgNO3 was approximately 1 min. The solution was stirred for 5 min and then centrifuged at 14 000 rpm for 40 min. Pellets were washed with DI water and centrifuged at 14 000 rpm for 20 min. Pellets were resuspended in DI water for absorption measurements and sterile DI water for interaction with cells. The absorbance at 800 nm was measured using a Beckman Coulter (Brea, CA) DU730 life science UV-visible (UV-vis) spectrophotometer, and the concentration was determined using a standardised concentration curve. A concentration curve was originally developed by lyophilising one batch of Ag NP as prepared. (The lyophiliser was a Labconco FreeZone 2.5 from Fisher Scientific.) The mass of the lyophilised Ag NP was measured and then the particles were re-suspended in DI water and serial dilutions were prepared. The optical absorption of each dilution was determined and plotted to generate an absorption-concentration calibration curve. The concentration of subsequent batches of Ag NP was determined by comparison with the established curve. A Malvern Instruments Zetasizer (Westborough, MA) was used to determine the average hydrodynamic diameter and zeta potential of the Ag NP. Samples of Ag NP were prepared on Formvar-coated copper grids (FEI, Hillsboro, OR) and transmission electron microscopy (Technai BioTwin, 120 keV, FEI) was done to observe the shape of the Ag NP. In order to determine the optical stability of the Ag NP solutions used in subsequent photothermal experiments, optical absorption scans from 300 to 1100 nm were taken on the same sample each day for 1 week to observe spectral shifts that would render the Ag NP solutions unusable for photothermal therapy. During this period, the solution was kept in an airtight microtube and protected from light.
Hyperthermic potential of Ag NP
The infrared light source used throughout the following experiments was a continuous wave 800 nm diode laser from K-Laser USA (Franklin, TN). Future cell culture experiments will use 48 or 12 well plates; therefore, the beam diameter was adjusted to completely cover a single well of either a 48 (1.02-cm2 area) or 12 (3.8-cm2 area) well plate. Aliquots of 500 μL aqueous solutions containing Ag NP at concentrations of 0, 5, 10, 20, 30, 40, 50, 100, and 250 μg/mL were placed into wells of a 12-well plate. Laser power of 3 W (power density was 0.79 W/cm2) was applied to each well for 60 s. The same experiment was also performed using a 48-well plate, with a 200 µL volume of aqueous Ag NP, at a power density of 2.94 W/cm2. The initial and final temperatures of the Ag NP containing aqueous media were measured using a Fluke 714 thermocouple calibrator and type K thermocouple 80PK-1 bead probe wire thermocouple (Everett, WA).
Cell culture
MCF7 breast cancer cell line was purchased from American Type Culture Collection (ATCC) (Manassas, VA) and cultured in DMEM/F12 supplemented with 1% L-glutamine, 1% penicillin/streptomycin, 10% fetal bovine serum and 10 μg/mL insulin. MDA-MB-231 breast cancer cell line was purchased from ATTC and cultured in DMEM/F12 supplemented with 1% L-glutamine, 1% penicillin/streptomycin, and 10% fetal bovine serum. MCF 10A epithelial breast cell line was purchased from ATCC and cultured in DMEM/F12 supplemented with 1% L-glutamine, 1% penicillin/streptomycin, 5% heat-inactivated horse serum, 100 ng/mL cholera toxin, 10 µg/mL insulin, 20 ng/mL EGF and 0.5 µg/mL hydrocortisone All cell lines were maintained at 37 °C with a 5% CO2 humidified environment.
Cytotoxicity of Ag NP
To evaluate the acute (as measured immediately following exposure) cytotoxic response to the Ag NP, each of the cell lines was plated at a cell density of 5000 cells per well in a 96-well plate and incubated at 37 °C and 5% CO2 humidity for 24 h. Then the media was removed and new media (appropriate for each cell type) containing 0, 5, 10, 20, 30, 40, 50, 100, or 250 μg/mL of Ag NP was added and the plates were incubated for another 24 h. The Ag NP-containing media was then removed and the cells were washed twice with 1 × phosphate buffer solution (PBS) to remove Ag NP. Cell viability was determined using 3-(4,5-dimethyl-2-yl)-5-(3-carboxymethoxyphenyl)-2-(4-sulphophenyl)-2H-tetrazolium (MTS) assay (CellTiter 96AQueous assay kit, Promega, Madison, WI) according to the manufacturer’s instructions. Cell viability was normalised to cells incubated with media alone.
Clonogenics assay was used to evaluate cell proliferation by examining the number of colonies formed at a prolonged time after a 24-h exposure to Ag NP. MCF7, MCF 10A, and MDA-MB-231 cells were trypsinised, counted, and seeded on 6-well plates in triplicate at a density of 100–200 cells per well. The cells were given 24 h to adhere. Ag NPs (0, 5, 10, 20, 30, 40, 50, 100, 250 µg/mL) in media were added to the cells and incubated for 24 h at 37 °C. The Ag NP solutions were removed, cells were washed twice with PBS, and fresh media was added. Cells were then cultured for (7–14) days, changing media every 2–3 days, to allow colony formation. Media was removed, cells were washed three times with PBS, fixed with methanol, and then stained with crystal violet. Colonies (450 cells), were counted manually and the data is presented as a percentage of the surviving control colonies.
The release of lactate dehydrogenase (LDH) from cells in response to Ag NP was measured using the LDH assay kit (ThermoScientific, Rockford, IL). First, adherent cells were treated with silver in the same manner as described above for MTS assay analysis. After the 24 h incubation with Ag NP the welled plates containing cells were shaken to release LDH, and the media was aspirated and spun down to remove any excess Ag NP. Aliquots of the supernatant were used in the LDH assay, according to the manufacturer’s instructions to quantify the amount of LDH released. Amounts of LDH release were normalised to control cells that had no exposure to Ag NP.
Cell sensitivity to hyperthermia
MCF7, MCF 10A, and MDA-MB-231 cells were trypsinised, counted and seeded in 33 mm dishes in triplicate at a density of 100–400 cells per well. The cells were given 24 h to adhere before being exposed to 40, 42, 45, 47 or 50 °C for varying time points between 5–300 min. The cells were then cultured for (7–14) days at 37 °C, changing media every 2–3 days, to allow colony formation. Media was removed, cells were washed once with PBS, fixed with methanol, and then stained with crystal violet. Colonies (>50 cells), were counted manually and the surviving fraction was calculated for each cell line at the temperatures discussed above.
Photothermal treatment of cells
Cellular response to photothermal ablation was measured 24 h after treatment using MTS assay to evaluate the acute response, and 12 days after treatment via clonogenics assay to measure the long-term survivability. To evaluate the acute response of the breast cells to photothermal treatment, 20 000 cells from each of the three cell lines were plated in triplicate in 48-well plates and allowed to adhere for 24 h prior to exposure to Ag NP and laser. The media was removed and 200 µL of the various concentrations (5, 10, 20, 30, 40, 50, 100, and 250 µg/mL) of Ag NP or media alone was added to the cells and the plates were incubated for 10 min at 37 °C and 5% CO2 humidity during the time for laser exposure. The laser beam was adjusted to cover a single well of a 48-well plate with no overlap of the beam outside the area of the treated well. The laser power was 3 W, and the power density was 2.94 W/cm2 of 800 nm light, applied to each well for 60 s. After laser exposure, the media was removed and each well was washed twice with PBS. Cells were incubated for 24 h and then cell viability was measured using an MTS assay. Cell viability was normalised to cells incubated with media alone without laser exposure. For clonogenics, MCF 10A and MDA-MB-231 cells were seeded in triplicate at a density of 100 cells/well, and MCF7 cells were seeded in triplicate at a density of 150 cells/well, all in 12-well plates and incubated for 24 h. After the incubation period, the media was removed and 500 µL of the various concentrations (5, 10, 20, 30, 40, 50, 100, and 250 µg/mL) of Ag NP or media alone was added to the cells and the plates were incubated for 10 min at 37 °C and 5% CO2 humidity during the time for laser exposure. The laser beam was expanded to cover an entire well of a 12-well plate for this experiment. The laser power was 3 W, and the power density was 0.79 W/cm2 of 800 nm light, applied to each well for 60 s. For both the acute and clonogenics experiments, during photothermal treatment of the experimental plates one control plate remained incubated with the Ag NP and no laser exposure. The experimental plates were kept near 37 °C during laser treatment by placing them on a T225 tissue culture flask filled with 37 °C water to help minimise the inherent loss of heat that occurs between the tissue culture plate and the bench top. After laser exposure, the media was removed and each well was washed twice with PBS. Cells were then cultured for 12 days, changing media every 2–3 days, to allow colony formation. Media was removed, cells were washed three times with PBS, fixed with methanol, and then stained with crystal violet. Colonies (450 cells), were counted manually and data is presented as a percentage of the surviving control colonies.
Evaluation of cell morphology and nuclear condensation
Adherent MCF 10A, MCF7, and MDA-MB-231 cells were incubated with 50 µg/mL of Ag NP for 24 h, after which they were washed three times with PBS. The cells were fixed in 4% paraformaldehyde for 10 min, washed three times with PBS, and permeabilised using 0.5% Triton X 100 for 10 min. They were then washed three times with PBS, dipped in methanol, and incubated with 1 ng/mL of 4′,6-diamidino-2-phenylindole dilactate (DAPI) (D3571, Invitrogen, Grand Island, NY) in methanol for 5 min. Finally, they were washed three times with PBS and mounted under a coverslip using ProLong™ Gold antifade reagent (Invitrogen). The cells were imaged using an inverted Olympus model IX 70 microscope with a 20× objective (Center Valley, PA), and Image-Pro Plus 5.1 imaging software (Media Cybernetics, Rockville, MD).
Electron microscopy evaluation of intracellular silver location
Adherent cells from each of the three cell lines were incubated with 50 µg/mL of Ag NP for 24 h and then trypsinised, pelleted and fixed by resuspending the pellet in 2.5% glutaraldehyde in PBS, at room temperature for 10 min. After fixation, the cells were pelleted, embedded in EPON™ Resin (EPON 1001-t-75, Momentive, Houston, TX), and sectioned. The sections were placed on Formvar-coated copper grids for TEM evaluation. Images were taken using transmission electron microscopy (FEI Technai BioTwin, 120 keV).
Determination of intracellular silver concentration
Intracellular silver concentration was determined using inductively coupled plasma optical emission spectrometry (ICP OES), and UV-Vis spectroscopy. Three 100-mm Petri dishes were plated with 106 cells each, for each of the cell lines respectively. Then 24 h after plating the media was replaced with media containing 50 μg/mL of synthesised Ag NP, and the plates were incubated for another 24 h at 37 °C and 5% CO2 humidity. The media was removed and the dishes washed twice with ice-cold PBS to remove excess silver. The cells were lysed using a solution containing 250 μL of 1 M Tris, 500 μL of 10% Nonidet P40, 500 μL of a 2.5% solution of sodium deoxycholate, 150 μL of 5 M NaCl, 10 μL of 0.5 M ethylenediamine tetra-acetic acid (EDTA), 60 μL of 100 mM phenylmethyl sulphonyl fluoride (PMSF), and 3.53 mL of DI water. The lysis solution was added to the plates and the cells were scraped, collected, sequentially vortexed, and sonicated to complete cell lysis. The cell lysate was centrifuged at 5000 rpm for 2 min and then the supernatant (cytoplasmic fraction) was aspirated and placed in a separate tube, while the pellet (nuclear fraction) was retained. To digest the cellular material so that only silver remained, both the cytoplasmic and nuclear fractions were incubated with 1 mL of concentrated nitric acid overnight at room temperature. The following day, 2 mL of DI water was added to the tubes and the nitric acid was neutralised by adding 1 mL of ammonium hydroxide drop wise. The silver concentration in the cell samples was determined by ICP optical emission spectrometry using a Prodigy ICP OES system (Teledyne Leeman Labs, Hudson, NH). The ICP OES sample introduction system is composed of an automatic sampler, a double-pass spray chamber and a concentric nebuliser. All determinations were carried out in axial view mode using the following operating conditions: radio-frequency applied power 1.2 kW, plasma gas flow rate 18 L/min, nebuliser pressure 30 psi, and sample flow rate 0.6 mL/min. Silver was determined at 338.289 nm with an integration time of 15 s and three replicates per sample (n = 3). The analytical calibration curve was prepared from dilution of a silver stock solution (1000 mg/L, High Purity Standards, Charleston, SC) in 1% v/v HNO3. Trace metal grade HNO3 (Fisher, Pittsburgh, PA) and DI water (18.2 MΩ cm, Milli-Q, Millipore, Bedford, MA) were used in all calibration solutions. A secondary technique using UV-Vis spectroscopy to determine the intracellular location of intact Ag NP was performed by incubating the cell lines with Ag NP and then lysing the cells, as described above, but without acid digestion. While centrifugation has the potential to concentrate the silver in the nuclear pellet, 5000 rpm for 2 min is much less than the 14 000 rpm and 40 min needed to pellet the Ag NP to purify them during the synthesis step. To further ensure that Ag NP were not pelleted, the cell lysate was centrifuged at 2500 rpm for 2 min to separate the nuclear and cytoplasmic fractions. The supernatant (cytoplasm) and pellet (nucleus) were re-suspended to 1 mL volume of water, and the absorbance at 808 nm was measured using a Beckman Coulter DU730 life science UV-Vis spectrophotometer.
Statistical analysis
One-way analysis of variance (ANOVA) testing was used to gauge significance within the total silver concentration data. To determine significant differences between intracellular distributions of the silver within cell lines as well as cytoplasmic and nuclear fractions, this test was run again after normalising each of the raw data points by the total silver content in each cell. A two-way ANOVA was applied to the cell viability data to determine the relative contributions of both concentration and cell-type dependent effects. SigmaStat 3.5 and Holm-Sidak post-hoc testing were used for all analysis.
Results
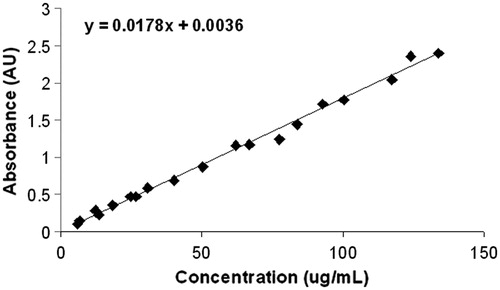
Synthesis of the silver nanoparticles occurs within 3 min following the addition of the reducing agents. As shown in , as the shape of the particles changes from spherical towards triangular plates, the colour of the solution changes from almost clear to bright yellow, orange, red, purple, and then to blue and blue-green. shows the progressive red-shifting of the optical absorption of the Ag NP solution as the shape of the nanoparticles changes. The curve does not broaden significantly, indicating that a shape change is occurring rather than nanoparticle aggregation. The TEM image of the synthesised Ag NP that absorb near 800 nm further indicates that a dramatic shape change occurred, by comparing the shape of the starting seed particles () to the final product (). Dynamic light scattering, including measurement of the zeta potential, reveals that the synthesised Ag NP have an average hydrodynamic diameter of 76.1 ± 0.6 nm and a positive surface charge of +18 ± 2 mV. Batches of Ag NP typically yield between 3–6 mg of Ag NP, which is often too much for immediate experiments. Therefore, stability of the Ag NP over time, in aqueous solutions, was determined. As shown in , the solution exhibited a slight blue-shifting of 18 nm over a 5-day period and then did not show any further shifting. The inset photographs show that at day 7, the Ag NP had not precipitated from solution. There is moderate variability in yield between batches of Ag NP. To account for this, an absorption concentration calibration curve, shown in , was developed to allow for determination of the Ag NP yield immediately at the time of synthesis. The optical absorbance of the Ag NP increases linearly with concentration, and the slope of the line allows for calculation of Ag NP concentration.
Figure 1. (A) The change in the colour of silver solutions as the synthesis proceeds over time. (B) The corresponding absorption shift for the silver solution as it evolves in time.
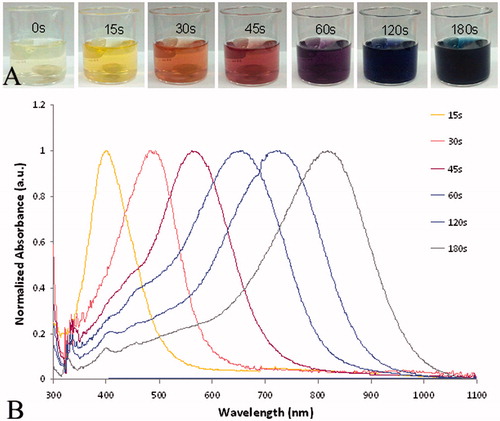
Figure 2. Electron microscopy image of the silver nanoparticles synthesised for use as photothermal agents. (A) Seed, which is mostly spherical and (B) triangular plates.
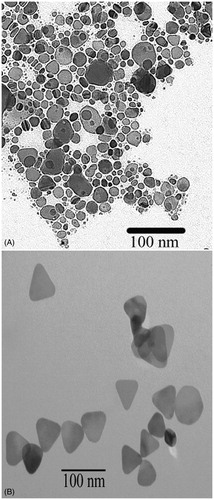
Figure 3. The silver nanoparticles are stable in water over a 7-day period, as observed by measuring shifts in the optical spectrum each day and by observing that no precipitation on the nanoparticles occurred as shown in the inset in the figure. Day 0, 792 nm; day 1788 nm; day 2, 782 nm; day 3, 780 nm; day 4, 776 nm; day 5, 774 nm; day 6, 774 nm; day 7, 774 nm; total shift is 18 nm and then it stabilised at day 5, with no further shifting. a.u.: Arbitrary units.
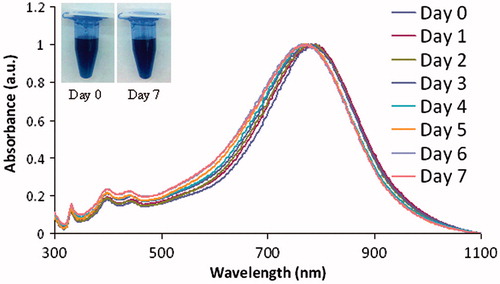
Figure 4. Absorbance at 800 nm, corresponding to the concentration of Ag NP. AU: Arbitrary units.
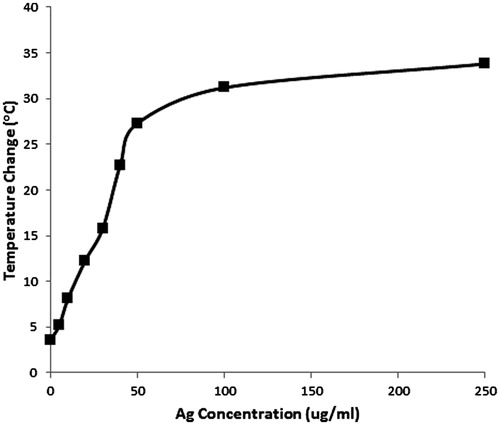
Silver nanoparticles were designed to strongly absorb near 800 nm in order to generate heat due to their inherent plasmon resonance. The concentration versus change in temperature of a 500 µL volume is plotted in . There is a plateau in concentration above 50 μg/mL, where there is no longer a significant increase in temperature change. The same trend was observed using a 200 µL volume of aqueous Ag NP in a 48-well plate (data not shown). When a 48-well plate was used there was a temperature increase of 0.078 °C/μg of Ag NP. When the 12-well plate was used, there was a temperature increase of 0.24 °C/μg of Ag NP.
Figure 5. Temperature change versus concentration of silver nanoparticles designed specifically to absorb near 800 nm. This reflects the temperature change of a 500-μL volume, with an 800 nm diode laser, spot size of 3.8 cm2, applied at 3 W, CW for 60 s. The optimal concentration for heating is below the plateau, between 5–50 μg/mL, where a sufficient temperature change of 5–35 °C occurs.
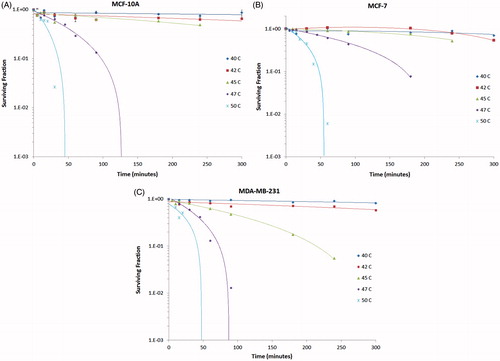
shows the effect that a range of hyperthermic temperatures, between 40–50 °C, have on MCF 10A, MCF7, and MDA-MB-231 cells. The plots illustrate the surviving fraction corresponding to the temperature at which the cells were incubated for specific time intervals. Both MCF 10A and MCF7 cells are resistant to 45 °C, for 250 min, whereas MDA-MB-231 cells exhibit a reduction in the number of surviving colonies. All three cell lines have a reduction in the number of colonies at 47 °C, although a longer time is needed for killing of MCF7 cells at this temperature. At 50 °C, all three cell lines have a marked reduction in the surviving fraction around 50 min at elevated temperature.
Figure 6. Semi-log plots of the survival fraction of MCF 10A, MCF7 and MDA-MB-231 cells to hyperthermia between 40° and 50 °C for 0 to 300 min. MCF7 cells appear to have the greatest resistance to hyperthermia, as indicated by the higher surviving cell fraction at 47 °C compared to MCF 10A and MDA-MB-231 cells. MDA-MB-231 cells succumb to hyperthermia beginning at 45 °C, suggesting that this cell line may be more sensitive to hyperthermia than either MCF 10A or MCF7 cells.
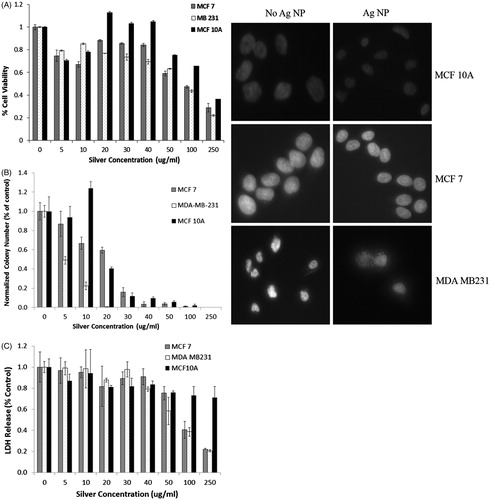
demonstrates the response of the breast cells to increasing concentrations of Ag NP alone, in the absence of infrared light, after a 24-h exposure. The results of the MTS assay are shown in , and initially there is a 20–30% decrease in cell viability at the 5 and 10 μg/mL concentration. Between 20–40 μg/mL there is a rebound in cell viability for each of the cell lines, with the MCF 10A cells having greater than 100% cell viability. At 50 μg/mL and above, all of the cell lines show progressive decrease in cell viability. However, even at the highest concentration, 250 μg/mL of Ag NP, MCF 10A has greater than 40% cell viability. A secondary technique undertaken to evaluate the response of MCF7, MCF 10A, and MDA-MB-231 cells to a 24-h exposure to Ag NP was the clonogenics assay, and the results are presented in . Even at the lowest concentration of 5 µg/mL, MDA-MB-231 cells are sensitive to Ag NP, with a 50% reduction in the number of colonies formed. At 10 µg/mL, the MCF7 cell line exhibits a 45% reduction and MDA-MB-231 has an 80% reduction, which is in contrast to MCF 10 A cells which have a 25% increase in colony number. From 20 to 100 µg/mL, there is a progressive decline in the number of colonies for MCF 10 A and MCF7, while no colonies formed for MDA-MB-231 cells for any of the concentrations greater than 10 µg/mL. No colonies were formed for any of the cell lines at 250 µg/mL. Lactate dehydrogenase assay was performed as a tertiary method to evaluate the cytotoxic response to Ag NP, and the results are shown in . There were no increases in LDH in any of the three cell lines. There is a statistically significant decrease in LDH release for 50, 100, and 250 µg/mL, which correlates with the lower number of cells measured by the MTS assay at these concentrations. MCF 10A cells differ from the breast cancer lines at 100 and 250 µg/mL by having less of a decline in LDH release. The images in show DAPI-stained cells with and without 50 µg/mL of Ag NP exposure. There is no severe condensation of cell nuclei upon treatment with Ag NP, although there is a slight reduction in the diameter of the nuclei. The images indicate that Ag NP do not appear to stimulate apoptosis.
Figure 7. (A) MTS assay of cell viability of the breast cell lines exposed to Ag NP for 24 h indicates an approximate 20–30% reduction in viable cells upon exposure to the low amount, 5 μg, of Ag NP, with an increase in viability between 20–40 μg/mL, especially for the MCF 10A line. A progressive decrease in cell viability is observed for all cell lines as the silver nanoparticle concentration increases above 50 μg/mL, with MCF 10A cells being the most resistant to silver cytotoxicity, followed by MCF-7, then MDA-MB-231 cells. Concentration, cell type, and the interaction of the two factors are each significant on a p < 0.001 level. Both cancer cell lines are significantly different from the MCF 10A cells at each concentration of 20 μg/mL or higher. (B) Clonogenics assay of breast cells incubated with varying concentrations of Ag NP for 24 h indicate a lower cytotoxicity threshold for all other the cell lines. MCF 10A have increased colony numbers at 10 µg/mL of Ag NP. MDA-MB-231 cells are the most susceptible to Ag NP, with a 50% reduction at the lowest concentration and no colonies formed upon exposure to 20 µg/mL or higher concentrations. (C) Lactate dehydrogenase released from the cells decreases progressively upon incubation of the cells with Ag NP. There is significantly less LDH released by MCF7 and MDA-MB-231 cells, compared to MCF 10A cells at 100 and 250 µg/mL. All images were taken at 20× magnification. There are slight reductions in the size of the nuclei of MCF 10A and MCF7 cells treated for 24 h with 50 µg/mL of Ag NP, although this is not observed in the MDA-MB-231 cells.
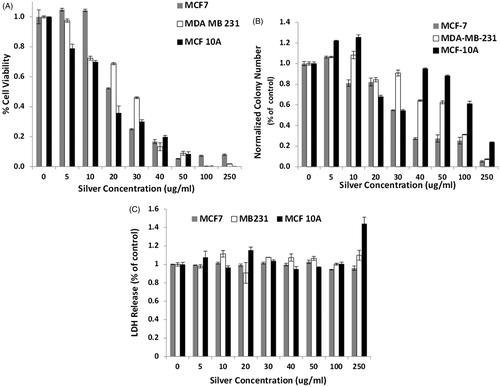
The effect of infrared-stimulated Ag NP heating on MCF 10A, MCF7, and MDA-MB-231 cells is shown in . All experimental groups were normalised to their own cell line control of cells not treated with either Ag NP or laser exposure. shows the cellular response 24 h after photothermal treatment, as measured by MTS assay. At the lowest concentration of 5 μg/mL, only the MCF 10A cells have significantly decreased cell viability, although at 10 μg/mL the MDA-MB-231 cells begin to succumb to Ag NP-induced hyperthermia. For all the concentrations, the response of MCF7 cells to Ag NP-induced hyperthermia is resistance, as indicated by cell survival at 100 and 250 μg/mL. This result is in agreement with the data from that MCF7 cells may be more resistant to hyperthermia. Clonogenic results are shown in . MCF7 cells have a 20% reduction in the number of colonies at 10 μg/mL of Ag NP. In contrast, both MDA-MB-231 and MCF 10A have an 8 and 25% increase in the number of colonies, compared to the control. MCF 10A and MDA-MB-231 cells do not show significant decreases in the number of colonies until a concentration of 20 μg/mL is reached (ΔT ∼ 12 °C). The MCF 10A cell line has 88% and 24% survival fractions for photothermal treatment using 50 and 250 μg/mL of Ag NP. For both the MCF7 and MDA-MB-231 cells there is a progressive decrease in the surviving fraction as the Ag NP concentration increases. There is a 1.5–3-fold increase in the surviving fraction of MCF 10A cells over the MCF7 or MDA-MB-231 cells for concentrations above 40 μg/mL and exposure to 0.79 W/cm2 of 800 nm light for 60 s. LDH assay was performed 24 h after photothermal treatment and the results support the idea that cells that survive the photothermal treatment may be able to retain their cell membrane integrity, since there is no increase in the amount of LDH released, as shown in .
Figure 8. Cell viability of the breast cancer cell lines incubated for 10 min only with increasing concentrations of silver, and infrared light exposure for 60 s. Cell viability was determined to be 100% for the control population of each cell line not exposed to either silver nanoparticles or infrared light, and the fractional viability is what is presented in this plot. (A) MTS assay results of cell viability measured 24 h after photothermal treatment. At 5 and 10 μg/mL, MCF7 cells have a slight increase in cell proliferation compared to the control. As the concentration of Ag NP increases, there is a decrease in the number of viable cells after exposure to 800 nm light. A small percentage of MCF7 cells remains viable after photothermal treatment at the highest concentrations of 100 and 250 μg/mL. (B) Clonogenics assay results show that at low concentrations of Ag NP, 5 and 10 μg/mL, MCF 10A cells had a higher percentage of colonies formed compared to cells without Ag NP and laser exposure. There is a decrease in the number of colonies formed for MCF7, MDA-MB-231 and MCF 10A cell lines as the Ag NP concentration increases. For concentrations of 40 μg/mL and higher, the MCF 10A cells have a statistically greater number of colonies forming 12 days after photothermal treatment compared to the MCF7 and MDA-MB-231 cell lines. (C) The amount of LDH released from cells 24 h after photothermal treatment using Ag NP does not show much of an increase until 250 μg/mL of Ag NP. At this concentration, both MDA-MB-231 and MCF 10A cells have an increased release of LDH, whereas MCF7 cells have a constant level of LDH released among all the concentrations of Ag NP evaluated.
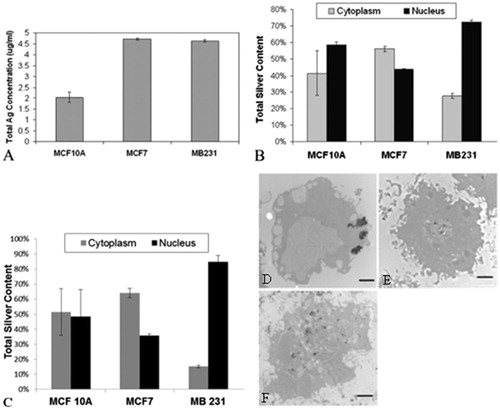
shows the intracellular silver concentration distributed over 3 000 000 cells in the 4 mL volume, as determined through ICP analysis. There is a statistically significant difference in the total amount of intracellular silver, with MDA-MB-231 and MCF7 having the highest concentration at close to 4.5 μg/mL (6 pg per cell), and MCF 10A having 2 μg/mL (2.67 pg per cell). shows the ICP analysis of nuclear and cytoplasmic cell fractions from cells exposed to 50 µg/mL of Ag NP for 24 h. The vast majority of silver in the MDA-MB-231 cells is in the nucleus rather than in the cytoplasm. In contrast, MCF7 cells have slightly more silver in the cytoplasm than in the nucleus, and MCF 10A cells appear to have about equal amounts of Ag NP in the cytoplasm as compared to the nucleus. A secondary method to determine intracellular Ag NP location is UV-Vis spectroscopy of lysates of cells treated with 50 µg/mL of Ag NP for 24 h. The spectroscopic results are presented in , and they corroborate the ICP findings. MDA-MB-231 cells have the vast majority of Ag NP in the nucleus, whereas MCF7 cells have more in the cytoplasm and MCF 10A cells have an almost equal distribution in the cytoplasmic and nuclear cell fractions. TEM further supports these findings, as shown in . is a representative image of an MCF7 cell, which reveals a large concentration of Ag NP in the cytoplasm. shows a representative image of an MDA-MB-231 cell, and the Ag NP are contained mainly in the nucleus. is a representative image of an MCF 10A cell, where the Ag NP are widely distributed throughout all parts of the cell.
Figure 9. (A) The total amount of intracellular silver for each of the breast cell lines was evaluated by ICP mass spectroscopy. Notably, MCF7 and MDA-MB-231 cell lines have approximately the same amount of intracellular silver and MCF 10A have much less. The MCF 10As are significantly different on a p < 0.001 level from the other two cell lines, which are not different from each other. From this information we can calculate the total amount of intracellular silver delivered by the Ag NP using the experimental parameters of 4 mL total volume for ICP analysis and 3 000 000 cells total. (B) Cell populations for each of the breast cell lines were fractionated to evaluate the total silver content present in either the nucleus or cytoplasm using ICP-OES. MCF7 cells have about the same silver concentration in the nucleus or cytoplasm, whereas both the MCF 10A and MDA-MB-231 cells have a much higher proportion of silver (72–82%) in the nucleus compared to the cytoplasm. The nuclear fraction is significantly different in the MCF7 and MDA-MB-231 cells on a p < 0.001 level relative to the MCF 10A cells. However, the cytoplasmic fraction of either cancer cell line is not different from the MCF 10A cells. (C) Cytoplasmic and nuclear cell fractions were evaluated by UV-Vis spectroscopy to determine the intracellular location of silver nanoparticles. MCF 10A has about the same amount of Ag NP in the cytoplasm as the nucleus. MCF7 cells have more Ag NP in the cytoplasm than the nucleus, which is opposite to the results from MDA-MB-231 cells, which have much more Ag NP in the nucleus than the cytoplasm. (D) The representative TEM image of MCF7 cell shows that Ag NP tend to be concentrated in the cytoplasm. (E) The representative TEM image of MDA-MB-231 cells shows that Ag NP tend to localise to the nucleus and are not found throughout the rest of the cell. (F) The representative TEM image of MCF 10A cells shows that Ag NP are located throughout the cell, in both the cytoplasm as well as the nucleus. Scale bars for images D–F are 2 µm.
Discussion
The results presented in this work support the findings of other authors that cancer cells have decreased cell viability at low silver concentrations. To our knowledge, this work is the first to demonstrate how breast cells respond to higher Ag NP concentrations. Previously published results from Boca et al. [Citation17] demonstrated that a non-tumorigenic cell line did not have decreased cell viability upon exposure to chitosan-stabilised Ag NP; however, they only showed the response for doses up to 1.75 μg/mL. The MCF 10A cells, a non-tumorigenic breast epithelial cell line, appear to be more resistant to Ag NP than the tumorigenic cell lines, perhaps because this cell line has a lower intracellular silver concentration than the tumorigenic cell lines. Our work shows that the ideal concentration for inducing a temperature increase greater than 8 °C in a 500 μL volume is between 5–50 μg/mL. One way to account for this would be if there were more MCF 10A cells, but the doubling time for each of the breast cell lines is similar (MCF 10A, 20 h; MCF7, 29 h; MDA-MB-231, 26 h), so there is approximately the same number of cells at the end of the overnight incubation period for obtaining the concentration of intracellular silver.
The use of chitosan-stabilised Ag NP has a few advantages. First, chitosan helps stabilise the edges of the triangular particles, which inhibits blue-shifting. The chitosan may also reduce the cytotoxic response of bare Ag NP, and the positive charge of chitosan may help facilitate increased cellular uptake compared to uncoated Ag NP. Hsin et al. [Citation19] quantified the intracellular silver concentration corresponding to incubation of either fibroblasts or colorectal cancer cells with uncoated, spherical Ag NP for either 1 or 8 h, and showed that silver concentration was about 600 ng/mL, independent of the time of incubation. In comparison, the chitosan-stabilised Ag NP used in the present research leads to a 3–7 times higher amount of silver inside cells. The average size of the Ag NP synthesised in this work is 76.1 nm, which might be large enough to be excluded from the nucleus [Citation21]. The positive surface charge may be aiding delivery to the nucleus, similar to the previous demonstration that 176 nm cationic gold nanoparticles can enter the nucleus [Citation22]. This is an important result, since previous literature describes that intracellular silver resides in the cytoplasm and affects mitochondrial membrane potential leading to apoptosis [Citation7,Citation20,Citation23]. It is not yet clear why the MDA-MB-231 cell line has a much higher percentage of silver contained in the nucleus compared to the cytoplasm, or why MCF7, another breast cancer cell line, does not display the same trend. Further research into the intracellular Ag NP location dependent upon cell type will be needed to elucidate the mechanisms and potential advantages for using cationic silver nanoparticles.
Elevated temperatures are induced rapidly and dissipate quickly using Ag NP-induced heating. Differences are observed between bulk hyperthermia and Ag NP-induced hyperthermia of breast cells. Bulk heating shows that MDA-MB-231 cells are more sensitive to heat, with MCF7 cells being more resistant as the temperature increases, as shown in . However, MCF7 cells are the most sensitive to Ag Np-induced heating, as observed by the reduction in colony number with increasing Ag NP concentration (and hence increased temperature) compared to MCF 10A and MDA-MB-231 cell lines, as shown in .
From the results in , a concentration of 10 μg/mL produces an average temperature of 8 °C, which the MCF7 cells should be moderately resistant to, according the colongenics assay data on bulk heating from . The clonogenics results after photothermal ablation of the MCF 10A cells shows that Ag NP at low concentrations appear to have a protective benefit for this cell line, as demonstrated by the increased number of colonies formed after photothermal treatment using 5 and 10 μg/mL of Ag NP. This same trend was also seen in , where MCF 10A cells exposed to 10 μg/mL of Ag NP for 24 h have an increase in the number of colonies. Photothermal treatment using Ag NP may be a successful treatment option as there is a very low fraction of cells that survive treatment with 250 μg/mL of Ag NP and exposure to 800 nm light. Clonogenics results from indicate that cells recover from 10 min exposure to Ag NP in the absence of light, but cannot recover upon exposure to application of 800 nm and the Ag NP tuned to absorb this wavelength of light. Most notably, this is observed for the breast cancer cell lines which have a differential recovery to Ag NP-induced PTT at concentrations above 40 μg/mL compared to the non-tumorigenic cell line.
Nanoparticle concentration versus temperature change in a specific volume has been demonstrated for other nanoparticles, such as carbon nanotubes, but this is the first time that it has been shown for Ag NP. indicates that for the particles used in these experiments, ideal concentrations for generating sufficient temperature change for hyperthermia is along the linear region of the plot, between 5–50 μg/mL. Assuming a normal starting temperature of 37 °C, thermal ablation temperatures above 50 °C, where cellular damage is irreversible, are achievable using 20-μg/mL and higher Ag NP concentrations.
In the present research, infrared radiation (either 0.79 or 2.94 W/cm2), applied for 60 s to stimulate 100 or 250 μg/mL of Ag NP for photothermal treatment of cells, led to a 90% decrease in cell viability for all three cell lines via the MTS assay and a 94% decrease in the tumorigenic cell lines in the clonogenics assay. In contrast, Boca et al. [Citation17] used a much higher energy, 54 W/cm2 for 10 min, to achieve a 90% decrease in acute cell viability. In their experiment, cells were incubated with Ag NP, and then washed to remove any non-internalised Ag NP, but the amount of intracellular silver for inducing hyperthermia was not quantified [Citation17]. Our results are able to define the concentration as well as the laser power and time needed to achieve the same level of cell kill as shown by previous authors. For medical applications it is usually ideal to deliver as few nanoparticles as possible to achieve the desired effect. The beneficial effects of higher concentrations of Ag NP on non-tumorigenic phenotypes should also be considered, as demonstrated by the increased viability of MCF 10A cells to both Ag NP and Ag NP-induced heating at 10 μg/mL.
Although both MCF7 and MDA-MB-231 cells have about the same amount of total intracellular silver concentration, light exposure to induce hyperthermia using 20 and 30 μg/mL of Ag NP demonstrates that MDA-MB-231 cells appear to be more resistant to hyperthermia, for these Ag NP concentrations only. This finding may correlate with the results that MDA-MB-231 cells have more silver in the nucleus whereas MCF7 has more silver in the cytoplasm, and MCF 10A has less intracellular silver overall. This begs the question of whether the intracellular location of particles that induce hyperthermia is of great consequence. There may be certain clinical advantages to using Ag NP for heating to combat breast cancer based on the resistance of the non-tumorigenic MCF 10A phenotype to Ag NP at higher concentrations and the increase in cell viability that occurs at low concentrations.
Conclusion
Silver nanoparticles have been demonstrated to be effective agents for photothermal therapy against both common ductal carcinoma cells (MCF7), and treatment-resistant triple negative (MDA-MB-231) breast cancer cells. Synthesis of Ag NP can be performed within a few minutes, and produces a high yield of nanoparticles that is stable in aqueous media for up to 1 week. The optical absorption was specifically tuned to be near 800 nm, so that the Ag NP would generate heat upon exposure to 800 nm light. The novel aspects of this work include determining the concentration of Ag NP needed to induce sufficient heat for hyperthermia, leading to cell death, and relating this to intracellular silver concentration. One major result of this work is that the ideal concentration of Ag NP for temperatures that can cause irreversible cell damage was found to be in the range of 20–250 μg/mL. Our results confirm previous findings by other authors that cancer cells exhibit decreased cell viability upon exposure to Ag NP compared to non-tumorigenic phenotypes, and we classify this as a differential response that cancer cells have to Ag NP.
Declaration of interest
The authors would like to thank the Department of Plastic and Reconstructive Surgery for providing funding for this research. Michelle Alimpich would like to thank Wake Forest University Health Sciences for providing research support through the Translational Science Institute’s Summer Research Fellowship. The authors alone are responsible for the content and writing of the paper.
Acknowledgements
The authors would like to thank Aaron Mohs, of Wake Forest University, for use of the Malvern Instrument to measure zeta potential and hydrodynamic diameter, and Waldemar Debinski and Denise Gibo for use and assistance with using the optical microscope.
References
- Ip M, Lui SL, Poon VKM, Lung I, Burd A. Antimicrobial activities of silver dressings: An in vitro comparison. J Med Microbiol 2006;55:59–63
- Kwan KH, Liu X, Yeung KW. Silver nanoparticles improve wound healing. Nanomedicine 2011;6:595–6
- Mishra M, Kumar H, Tripathi K. Diabetic delayed wound healing and the role of silver nanoparticles. Dig J Nanomater Bios 2008;3:49–54
- Nadworny PL, Wang JF, Tredget EE, Burrell RE. Anti-inflammatory activity of nanocrystalline silver in a porcine contact dermatitis model. Nanomed Nanotechnol 2008;4:241–51
- Wright JB, Lam K, Buret AG, Olson ME, Burrell RE. Early healing events in a porcine model of contaminated wounds: Effects of nanocrystalline silver on matrix metalloproteinases, cell apoptosis, and healing. Wound Repair Regen 2002;10:141–51
- Arora S, Jain J, Rajwade JM, Paknikar KM. Interactions of silver nanoparticles with primary mouse fibroblasts and liver cells. Toxicol Appl Pharmacol 2009;236:310–18
- Martinez-Gutierrez F, Thi EP, Silverman JM, de Oliveira CC, Svensson SL, Hoek AV, et al. Antibacterial activity, inflammatory response, coagulation and cytotoxicity effects of silver nanoparticles. Nanomed Nanotechnol 2012;8:328–36
- Gurunathan S, Lee KJ, Kalishwaralal K, Sheikpranbabu S, Vaidyanathan R, Eom SH. Antiangiogenic properties of silver nanoparticles. Biomaterials 2009;30:6341–50
- Kalishwaralal K, Banumathi E, Pandian SRK, Deepak V, Muniyandi J, Eom SH, et al. Silver nanoparticles inhibit VEGF induced cell proliferation and migration in bovine retinal endothelial cells. Colloids Surf B Biointerfaces 2009;73:51–7
- Jain PK, Huang XH, El-Sayed IH, El-Sayed MA. Noble metals on the nanoscale: Optical and photothermal properties and some applications in imaging, sensing, biology, and medicine. Accounts Chem Res 2008;41:1578–86
- Lu W, Xiong CY, Zhang GD, Huang Q, Zhang R, Zhang JZ, et al. Targeted photothermal ablation of murine melanomas with melanocyte-stimulating hormone analog-conjugated hollow gold nanospheres. Clin Cancer Res 2009;15:876–86
- O’Neal DP, Hirsch LR, Halas NJ, Payne JD, West JL. Photo-thermal tumor ablation in mice using near infrared-absorbing nanoparticles. Cancer Lett 2004;209:171–6
- Zhang JZ. Biomedical applications of shape-controlled plasmonic nanostructures: A case study of hollow gold nanospheres for photothermal ablation therapy of cancer. J Phys Chem Lett 2010;1:686–95
- Burke A, Ding XF, Singh R, Kraft RA, Levi-Polyachenko N, Rylander MN, et al. Long-term survival following a single treatment of kidney tumors with multiwalled carbon nanotubes and near-infrared radiation. Proc Natl Acad Sci USA 2009;106:12897–902
- Fisher JW, Sarkar S, Buchanan CF, Szot CS, Whitney J, Hatcher HC, et al. Photothermal response of human and murine cancer cells to multiwalled carbon nanotubes after laser irradiation. Cancer Res 2010;70:9855–64
- Iancu C, Mocan L, Bele C, Orza AI, Tabaran FA, Catoi C, et al. Enhanced laser thermal ablation for the in vitro treatment of liver cancer by specific delivery of multiwalled carbon nanotubes functionalized with human serum albumin. Int J Nanomed 2011;6:129–41
- Boca SC, Potara M, Gabudean AM, Juhem A, Baldeck PL, Astilean S. Chitosan-coated triangular silver nanoparticles as a novel class of biocompatible, highly effective photothermal transducers for in vitro cancer cell therapy. Cancer Lett 2011;311:131–40
- Franco-Molina MA, Mendoza-Gamboa E, Sierra-Rivera CA, Gomez-Flores RA, Zapata-Benavides P, Castillo-Tello P, et al. Antitumor activity of colloidal silver on MCF-7 human breast cancer cells. J Exp Clin Cancer Res 2010;29:148–155
- Hsin YH, Chena CF, Huang S, Shih TS, Lai PS, Chueh PJ. The apoptotic effect of nanosilver is mediated by a ROS- and JNK-dependent mechanism involving the mitochondrial pathway in NIH3T3 cells. Toxicol Lett 2008;179:130–9
- Kim TH, Kim M, Park HS, Shin US, Gong MS, Kim HW. Size-dependent cellular toxicity of silver nanoparticles. J Biomed Mater Res A 2012;100A:1033–43
- Verma A, Uzun O, Hu YH, Hu Y, Han HS, Watson N, et al. Surface-structure-regulated cell-membrane penetration by monolayer-protected nanoparticles. Nat Mater 2008;7:588–95
- Brown SD, Nativo P, Smith JA, Stirling D, Edwards PR, Venugopal B, et al. Gold nanoparticles for the improved anticancer drug delivery of the active component of oxaliplatin. J Am Chem Soc 2010;132:4678–84
- Park EJ, Yi J, Kim Y, Choi K, Park K. Silver nanoparticles induce cytotoxicity by a Trojan-horse type mechanism. Toxicol in Vitro 2010;24:872–8