
Abstract
Purpose: The use of correct tissue thermal diffusivity values is necessary for making accurate thermal modelling predictions during magnetic resonance-guided focused ultrasound (MRgFUS) treatment planning. This study evaluates the accuracy and precision of two non-invasive thermal diffusivity estimation methods, a Gaussian temperature method and a Gaussian specific absorption rate (SAR) method. Materials and methods: Both methods utilise MRgFUS temperature data obtained during cooling following a short (<25 s) heating pulse. The Gaussian SAR method can also use temperatures obtained during heating. Experiments were performed at low heating levels (ΔT∼10 °C) in ex vivo pork muscle and in vivo rabbit back muscle. The non-invasive MRgFUS thermal diffusivity estimates were compared with measurements from two standard invasive methods. Results: Both non-invasive methods accurately estimated thermal diffusivity when using MR temperature cooling data (overall ex vivo error <6%, in vivo <12%). Including heating data in the Gaussian SAR method further reduced errors (ex vivo error <2%, in vivo <3%). The significantly lower standard deviation values (p < 0.03) of the Gaussian SAR method indicated that it had better precision than the Gaussian temperature method. Conclusions: With repeated sonications, either MR-based method could provide accurate thermal diffusivity values for MRgFUS therapies. Fitting to more data simultaneously likely made the Gaussian SAR method less susceptible to noise, and using heating data helped it converge more consistently to the FUS fitting parameters and thermal diffusivity. These effects led to the improved precision of the Gaussian SAR method.
Introduction
Because of large spatial temperature gradients near the focal zone during focused ultrasound (FUS) sonications, conduction plays a significant role in the temporal progression of FUS treatments and their ultimate outcomes. The significant tissue parameter that accounts for conduction is the thermal diffusivity. Accurate thermal diffusivity values can result in efficient pretreatment thermal modelling and treatment planning, fewer impromptu adjustments during treatments, increased efficacy and safety of treatments, and ultimately greater clinical acceptance of FUS as a thermal therapy.
Tissue thermal diffusivity can vary significantly among individuals and tissue types. As an example, the IT’IS Foundation tissue property database, which includes tissue property data from many different studies in the literature, provides thermal diffusivity values of human kidney ranging from 0.114 to 0.150 mm2/s [Citation1]. In a simulated FUS heating pulse, this variability in thermal diffusivity leads to a 22% variation in the peak temperature increase after only 30 s of heating. Applied to real treatments, such errors would severely limit the value of pretreatment planning. Hence, identifying patient- and tissue-specific thermal diffusivity is essential if treatment planning is to provide its full potential contribution to treatment safety and efficacy.
A common approach to obtaining local estimates of the thermal diffusivity is to fit experimental temperature data to an analytical temperature solution that includes the thermal diffusivity as a fitting parameter. Traditionally, researchers have used invasive thermistor or thermocouple probes [Citation2–7] for thermal property estimation. More recently developed non-invasive temperature measurement techniques are not only more acceptable for clinical applications but also provide more extensive temperature data for fitting [Citation8–11].
In a non-invasive MR-based approach, Cheng and Plewes [Citation12] developed a method which uses magnetic resonance-guided focused ultrasound (MRgFUS) temperature data to find the tissue thermal diffusivity. That method assumes that a Gaussian temperature distribution is present at the end of heating and that a Gaussian temperature distribution is retained during cooling. They applied their technique to several ex vivo tissues and in vivo rabbit thigh muscle, reporting precision errors of less than 10%. Subsequent studies have applied their method in ex vivo perfused porcine kidney (precision of 10% [Citation13]), in vivo porcine kidney (precision of 40–50% [Citation14]), and in vivo porcine thigh muscle (precision of 10% [Citation15]). In those studies, the maximum focal temperature and noise in temperature measurements varied significantly, limiting the value of directly comparing precision values. More recently, a different method using MRgFUS temperature data was proposed by Dillon et al. [Citation16] and has been applied in tissue mimicking phantoms [Citation16] and ex vivo pork muscle [Citation17]. That method assumes a Gaussian specific absorption rate (SAR) heating pattern applied to the tissue, and uses temperature data acquired during the heating, but not the cooling, period. The only published precision data for that method is from one ex vivo pork muscle sample (four sonications at a single location), where the standard deviation (SD) of thermal diffusivity estimates was 7% of the mean value [Citation17].
Interestingly, none of these MRgFUS studies have established the accuracy of their methods by comparing their results directly with concomitant measurements in the same tissue samples from more established invasive methods, instead relying upon comparison with data reported in the literature.
The purpose of this study is to assess the accuracy and precision of the two MRgFUS thermal diffusivity estimation techniques developed by Cheng and Plewes [Citation12] and Dillon et al. [Citation16] at heating levels that do not cause tissue damage. The Cheng and Plewes method, hereafter termed the Gaussian temperature method, uses data exclusively from the cooling portion of the temperature curve. The Dillon method, hereafter called the Gaussian SAR method, has been extended to include cooling data and will be applied in two ways: (1) using only the cooling data for direct comparisons with the Gaussian temperature method, and (2) using both heating and cooling temperature data. Results will be compared with two established invasive estimation techniques in ex vivo pork muscle samples and in vivo rabbit back muscle to quantify the accuracy and precision of these non-invasive methods using clinically relevant heating and MR parameters.
Materials and methods
Theory: non-invasive MR temperature-based methods
The derivation of the analytical solutions for the two non-invasive MR temperature-based methods can be found in the original papers [Citation12,Citation16]. For reference, the theoretical approximations applied to the non-invasive methods are summarised in .
Table 1. Comparison of approximations of two non-invasive MRgFUS thermal diffusivity estimation methods.
Gaussian temperature method
Cheng and Plewes demonstrated that the transverse plane’s () analytical temperature distribution following an impulse heat source with an elliptical (axial and radial) Gaussian heating pattern is given by:
where r is the radial distance (mm) from the axis of beam propagation, z = 0 is the axial position (mm) at the centre of the focal zone, t is the time (s) after the instantaneous heating pulse, A is the time- and perfusion-dependent temperature (°C) at the centre of the focal zone, α is the local tissue thermal diffusivity (mm2/s), and β is the transverse Gaussian variance of the focused ultrasound beam (mm2).
Figure 1. Set-up for MRgFUS experiments and orientation of coordinate axes in analytical solutions used for thermal diffusivity estimation.
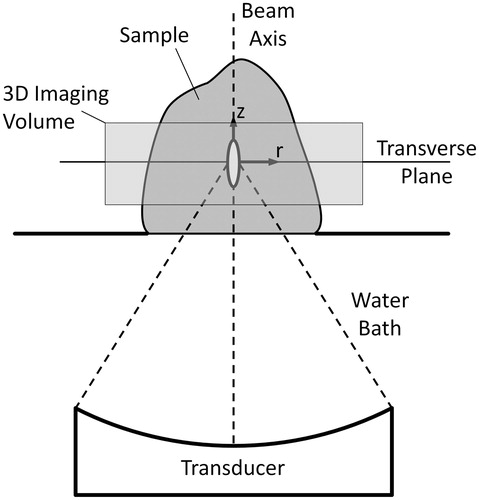
The basic approximation in this method is that the temperature distribution at the beginning of cooling is Gaussian, as would be achieved by instantaneous heating with a Gaussian power deposition pattern. Estimating the thermal diffusivity with this approach is performed in a two-part process. First, at the time of each temperature measurement during the cooling period, Equation 1 is fitted to the experimental temperatures to determine parameter 4α t + β, the temperature distribution’s Gaussian variance. Since the first derivative of this parameter with respect to time is directly proportional to the thermal diffusivity, the second step involves plotting the parameter 4α t+β vs. time and applying a linear fit from which estimates of the tissue thermal diffusivity are made.
Gaussian SAR method
Dillon et al. [Citation16] used the analytical solution for a radial Gaussian heating pattern (uniform in the axial direction) to estimate thermal diffusivity for situations where blood perfusion effects are negligible. The transverse plane’s analytical solution during heating was shown to be:
where Ei is the exponential integral function [Citation18], t is the time (in s) since the onset of ultrasound heating, and C is the initial rate of temperature increase (°C/s) at the centre of the focal zone. Like the Gaussian temperature method, this solution assumes a Gaussian SAR heating pattern, but it does not require that the temperature distribution remain Gaussian during heating, making it more applicable when longer sonication times are used.
For this method, because thermal diffusivity also plays a significant role during tissue cooling, it should be useful to utilise both the heating and cooling curves for diffusivity estimation. This requires an analytical expression for the temperature profile after the ultrasound is turned off, which was not provided in the original Dillon et al. [Citation16] derivation. Applying the principle of superposition, the desired cooling solution is given by:
where th is the ultrasound heating time (in s). A single three-parameter fit (fitting parameters: C, α, and β) to the transverse experimental temperature data obtained during heating (Equation 2) and cooling (Equation 3) provides an estimate of the local tissue thermal diffusivity α (mm2/s).
Theory: invasive reference methods
To obtain reference data for assessing the accuracy of the non-invasive MR temperature-based estimation methods, two commonly used invasive methods were applied to measure the tissue thermal diffusivity. These methods are applicable when perfusion effects are negligible.
Transient line source method
The transient line source method makes use of a long, thin, constant-power heating probe. The probe is invasively inserted in the sample and the power source is turned on while a thermocouple at known radial distance, r, from the heating probe takes temperature measurements.
The theory behind the transient line source method uses the analytical solution for an infinite line source with constant power per unit length. This analytical temperature solution during heating is given by Carslaw and Jaeger [Citation19]:
where Q is the power per unit length (W/m) of the probe, k is the tissue thermal conductivity (W/m/°C), and Ei is the exponential integral function. After heating for a given time th, the analytical solution during cooling is:
By applying a known power Q, measuring the temperature at a known distance r, and fitting the measured heating and cooling data to Equation 4 and Equation 5 respectively, the two fitting parameters of thermal conductivity k and thermal diffusivity α can be determined.
The similar analytical form of the cooling solutions for the transient line source method (Equation 5) and the Gaussian SAR method (Equation 3) is noteworthy. In model approximations and derivations the only significant difference between these methods is found in the energy source term; for the transient line source method, the source in the transverse plane is a single point, and for the Gaussian SAR method the source is a radial Gaussian. This difference manifests itself by the presence of the Gaussian variance of the ultrasound beam β in Equation 3 and its absence in Equation 5. When the methods are applied, the source term is assumed known for the transient line source method, and for the Gaussian SAR method its distribution is determined via fitting parameters C and β.
Combined property method
Thermal diffusivity is defined by the ratio of the thermal conductivity k to the density ρ and specific heat capacity ct of the tissue (α = k/ρct). As discussed above, the transient line source method provides estimates for the tissue thermal conductivity. Tissue density can be calculated by measuring the mass of a tissue sample and dividing by its volume, as determined by the volume of water it displaces when submerged. A digital scanning calorimeter can be used to measure the specific heat capacity from a small tissue sample. Using the combination of these invasive property measurements, a second independent measurement of the tissue thermal diffusivity can be made.
MRgFUS experimental set-up
Ex vivo experiments were performed in four pork muscle samples purchased at a local organic market 2–6 h prior to the experiment and allowed to thermally equilibrate to room temperature in air-tight packaging. Heating was performed using an MR-compatible 256-element FUS phased array system (Image Guided Therapy, Pessac, France) and no electronic steering was utilised in ex vivo experiments. The geometric focus was positioned 3.4–4.7 cm into the sample (N = 8 total heating locations, n = 30 total sonications). Heating times varied from 3.6–21.8 s, with the applied acoustic power varied (7--18 W) to obtain a temperature rise of approximately 10 °C by the end of heating. A delay of at least 7 min was provided between sonications to ensure that the tissue cooled to a uniform temperature before subsequent heating.
In vivo experiments were performed on the back muscles of two female New Zealand white rabbits (4.1, 4.5 kg). The rabbits were initially anaesthetised with ketamine (40 mg/kg, intramuscular (IM)) and xylazine (5 mg/kg, IM). Hair in the beam path was removed with clippers and depilatory cream to improve acoustic coupling. Animals were then intubated and mechanically ventilated with isoflurane (1–3%) to maintain anaesthesia. Each rabbit was positioned supine on the MRgFUS system and sonications were repeated in two locations of the back muscle separated by 1.0–1.5 cm (N = 4 total heating locations, n = 25 total sonications), each with a focal depth of 2 cm. Transducer power was 8 W and heating time ranged from 21.7–23.6 s with a minimum delay of 7 min between individual sonications. Heart rate, end tidal CO2, percentage oxygen saturation, and rectal temperature were monitored continuously during the experiment. Following FUS sonications, the animals were euthanised, the back muscle was exposed, and invasive thermal diffusivity measurements were made. The protocol was approved by the Institutional Animal Care and Use Committee.
MR temperature imaging (3T Trio MRI scanner, Siemens, Erlangen, Germany) was performed during FUS experiments with the following parameters: 3D segmented echo planar imaging (EPI), repetition time = 35--44 ms, echo time = 11 ms, flip angle = 15--30°, bandwidth = 738--744 Hz/pixel, voxel size = 1 × 1 × 3 mm3, field of view = 128--192 × 80--132 mm3, 8 transverse slices (plus 25% oversampling), EPI factor = 9, and temporal resolution = 3.6–5.4 s. Ex vivo samples were positioned between a pair of two-channel surface coils built in-house; in vivo experiments used a single-loop coil positioned under the rabbit and a two-channel surface coil placed on the rabbit’s abdomen. Reconstruction of the MR data included weighting of the coils by the inverse covariance matrix [Citation20] and zero-filled interpolation to 0.5-mm isotropic spatial resolution [Citation17,Citation21]. Temperatures measured with the proton resonance frequency method [Citation22,Citation23] were determined by a 2D referenceless technique using a fifth-order polynomial [Citation24]. A summary of the temperature data for these experiments along with selected ultrasound parameters is provided in . Noise in the temperature measurements was defined using the average of the SD of the temperature measured over time for each voxel in an unheated region of the tissue.
Table 2. Selected ultrasound parameters and temperature information from experimental data.
Thermal dose values were calculated to demonstrate that this technique can be repetitively applied in vivo without causing extensive damage [Citation25]. Ex vivo thermal dose values assumed an initial reference temperature of 37 °C, while in vivo calculations used the rectal temperature measured during the in vivo experiments, which ranged from 31–36 °C. The voxel with the highest cumulative thermal dose from a single heating sonication acquired 11 CEM43 °C, which is below reported damage thresholds [Citation25–27]. Also, no visible lesions or tissue changes were observed in histology of the FUS heating region.
Experiments: non-invasive determination of thermal diffusivity
Estimations of tissue thermal diffusivity using the Gaussian temperature method employed a least squares 2D Gaussian fit (MATLAB function: fminsearch) of Equation 1 to the cooling MR temperature data in the slice of maximum temperature increase. The data presented herein utilised a spatial fitting region that included all voxels within a radius of r = 6 mm from the beam axis. This region was selected because early results varying the size of the spatial fitting region identified a fitting radius of r ≈ 5.5 mm, above which including additional data did not significantly affect diffusivity estimates.
Following the Cheng and Plewes criteria for data inclusion [Citation12], only Gaussian variances from cooling temperature images where the focal temperature signal-to-noise ratio (SNR) (defined as the ratio of the maximum focal temperature for a given acquisition time to the noise SD) was greater than 5 were included in the Gaussian temperature method linear fits (MATLAB function: polyfit). For in vivo data, a focal temperature SNR > 3 was required.
Thermal diffusivity estimates using the Gaussian SAR method employed the same circularly symmetrical spatial fitting region with radius of 6 mm used in the Gaussian temperature method (the fitting radius for the Gaussian SAR method, above which estimates did not change, was r ≈ 4 mm). Temporally, the single three-parameter fit (MATLAB function: fminsearch) of the Gaussian SAR method was applied in two different ways. First, for direct comparisons, the Gaussian SAR/cool only method included only the cooling data used in the Gaussian temperature method (ex vivo focal temperature SNR > 5, in vivo SNR > 3). Second, the Gaussian SAR/heat and cool method was applied using those cooling data plus the heating data.
The initial guess for each fitting parameter in both methods used a random number generator between zero and one. Each estimate of thermal diffusivity was repeated several times with different randomised initial guesses to ensure that fitting parameters consistently converged to the same values for a given data set.
The focal temperature SNR constraints limited the data for thermal diffusivity estimation to less than 80 s of data for ex vivo experiments and less than 75 s of data for in vivo experiments. Temperature rise at the nearest tissue boundaries (always located at r > 10 mm) was minimal (<1 °C), indicating that boundary effects could be neglected since the infinite sold assumption should be satisfied. Limiting temperature data to the spatial fitting region with radius of 6 mm should also have limited boundary effects, if present.
Experiments: invasive determination of thermal diffusivity
A commercially available device (KD2 Pro Thermal Properties Analyzer, Decagon Devices, Pullman, WA, USA) was used for invasive transient line source measurements of thermal diffusivity. The device has two 30-mm probes spaced 6 mm apart, with one probe being used for heating and the other for temperature measurements. The quoted accuracy of the device is ± 10% for both thermal conductivity and thermal diffusivity in materials with a conductivity greater than 0.1 W/m/°C).
For ex vivo samples, measurements were taken immediately before and after FUS experiments with the probe inserted through a freshly cut sample surface to minimise effects of tissue dehydration and decomposition. These measurements were made at several locations throughout the pork muscle to assess the homogeneity of the tissue sample (n = 7–8 per sample). Pre-experiment measurements were taken on the periphery of samples, since in one early experiment air pockets from probe measurements near the FUS heating region introduced MR artefacts which confounded MR temperature-based thermal diffusivity estimates. No significant changes in thermal diffusivity or thermal conductivity were observed when comparing pre- and post-experiment measurements. For in vivo experiments, measurements were taken at several locations in the back muscle (n = 4–5 per animal), including the region of FUS heating, immediately following euthanasia of the animal. Measurements in the heated region did not vary significantly from other locations.
For ex vivo samples, density measurements were made with the displaced water technique prior to experiments and repeated the day following experiments. Samples were stored overnight in an airtight plastic bag in a refrigerator. No changes in density were observed when comparing measurements made before and after experiments.
Tissue-specific heat capacity was measured using a digital scanning calorimeter (Q20, TA Instruments, New Castle, DE). Tissue samples (30–50 mg) were hermetically sealed in aluminium pans to prevent water loss during the heating protocol, which included equilibration at 25 °C, a 1-min isothermal period, ramped temperature increase at 10 °C/min to 65 °C, and another 1-min isothermal period. The tissue specific heat capacity was determined as the average of values for which the prescribed heating rate (10 °C/min) was met. Variation in specific heat capacity over this temperature range was less than 4%. Also, no changes were observed when comparing pre- and post-experiment measurements of specific heat capacity.
Combined property diffusivity calculations used the mean of thermal conductivity values from the KD2 Pro divided by the mean of density and specific heat capacity measurements from pre- and post-experiment measurements. No combined property diffusivity estimates were made in sample 3 of the ex vivo experiments because equipment for measuring specific heat capacity was unavailable at the time of the experiment. The combined property method for measuring thermal diffusivity was not used for in vivo experiments.
Results
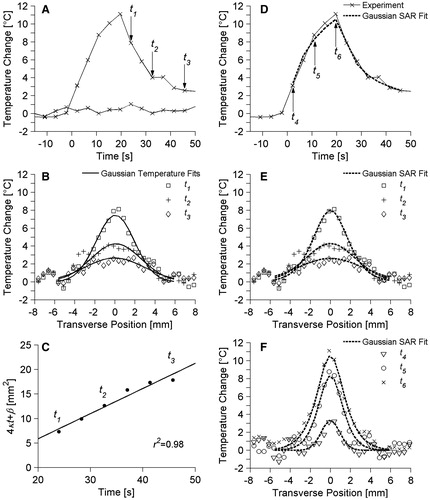
Both non-invasive thermal diffusivity estimation methods rely upon fitting to experimental temperature profiles. Some representative temperature data from ex vivo pork muscle are presented in . plots the temperature vs.. time since the onset of ultrasound heating for two locations in the transverse plane. The first location is at the centre of the focal zone and includes the maximum temperature change measured in the experiment (ΔT = 11.1 °C) at 19.6 s of heating. The second location is in a non-heated region of the pork muscle, and its relatively constant baseline values (SD = 0.4 °C) illustrate the experimental variability in temperature measurements. Arrows in identify three times (t1 = 24.0 s, t2 = 32.7 s, t3 = 45.7 s) during the cooling period for which transverse temperature data are plotted in . The results of the Gaussian temperature method’s fits to those temperature data are also shown in . presents the time variation of parameter 4α t + β as determined from the Gaussian fits of and other fits during cooling. The excellent linear fit (r2 = 0.98) to those data is shown in , from which a Gaussian temperature method thermal diffusivity estimate of 0.128 mm2/s was made. display results from the Gaussian SAR/heat and cool estimation method. replicates the experimental temperature vs.. time data at the centre of the focal zone from and also includes the Gaussian SAR/heat and cool analytical fit for that position. Three times during the heating period (t4 = 2.2 s, t5 = 10.9 s, t6 = 19.6 s) are identified for which transverse experimental temperature profiles are shown in . repeats the experimental temperature data from at times t1, t2, and t3. and also include the Gaussian SAR/heat and cool analytical temperature fit to experimental data at the specified time points. Differences between the Gaussian SAR/heat and cool fit presented in and the Gaussian SAR/cool only fit (not shown) are nominal with a maximum difference of 0.28 °C. The Gaussian SAR method produced thermal diffusivity estimates of 0.151 mm2/s and 0.153 mm2/s for the cool only and heat and cool data, respectively.
Figure 2. Representative ex vivo pork muscle experimental temperatures and fits used in thermal diffusivity estimation. (A) Temperature vs. time profile at the centre of the focal zone as well as baseline temperature measurements in a non-heated region 15 mm from the focus. Time is measured from the onset of heating. Arrows identify time points (t1, t2, t3) whose transverse temperature distributions are plotted in B and compared with Gaussian temperature fits to those data. (C) Estimates for 4α t+β vs. time and the linear fit used in the Gaussian temperature method for thermal diffusivity estimation. (D) The temperature vs. time profile at the centre of the focal zone and the corresponding data from the Gaussian SAR/heat and cool temperature fit at that location. Transverse temperature profiles and the Gaussian SAR/heat and cool fit are plotted in E for cooling times t1, t2, and t3 and in F for heating times t4, t5, t6 (indicated by arrows in D).
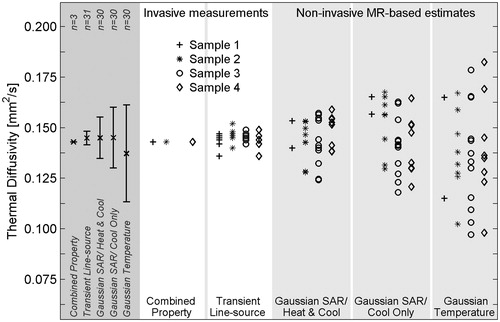
shows the ex vivo pork muscle results from the non-invasive MRgFUS estimation methods and both invasive methods. The far left column in shows the mean of all measurements made with each method, with error bars extending to ± 1 SD from the mean measurement. The invasive combined property method exhibited the least variation of all methods, but results were limited to three measurements. The small SD of the transient line source method (2% variation) shows the homogeneity of pork muscle. Using the average of the transient line source measurements for normalisation, the SD of the Gaussian SAR method is 7% for the heat and cool data and 10% for the cool only data. The SD of the Gaussian temperature method is 16% of the expected value. Using a one-tailed variance ratio test, each of these differences in SD is significant with p < 0.03.
Figure 3. Thermal diffusivity measurements and estimates in four ex vivo pork muscle samples. Invasive measurements (white columns) serve as the reference standard for thermal diffusivity values. Non-invasive MR temperature-based estimates (light grey columns) were repeated multiple times in each sample. Results for the combination of all ex vivo pork muscle experiments are shown in the left column (dark grey) with error bars extending to ± 1 SD from the mean value.
The quantitative results from ex vivo pork muscle experiments are presented in . Non-invasive MR-based thermal diffusivity estimates are presented as the mean of repeated sonications at a given location with SD values in parentheses. Invasive transient line source measurements are presented as the mean of measurements at several locations (n = 7–8) with the SD given in parentheses. When estimates and measurements from all samples and sonications are considered, the mean values are very consistent, ranging from 0.137 mm2/s to 0.145 mm2/s, and the non-invasive MR temperature-based estimation methods are accurate to within 6% when compared to the standard invasive thermal diffusivity measurements.
Table 3. Summary of thermal diffusivity measurements and estimates in ex vivo pork muscle experiments. Results are presented as the mean value with SD values in parentheses. Thermal diffusivity units are mm2/s.
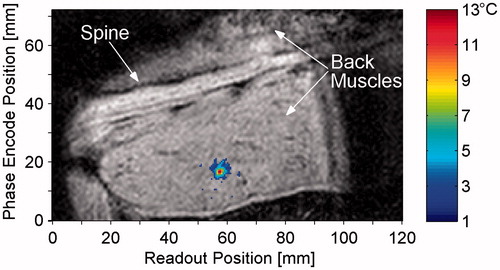
is a coronal magnitude image from a representative in vivo rabbit experiment. The temperature change at the end of heating is overlaid in colour, with a threshold value of 2 °C. The maximum temperature from this sonication was 13.2 °C and the SD of the temperatures was 0.8 °C as determined from a non-heated region of the muscle.
Figure 4. Magnitude image in coronal slice at time of maximum heating with temperature change overlay. The animal is supine, slightly oblique, with the head to the right of the image, and the field of view has been truncated to show only the region of interest, including the spine and back muscles. The threshold for temperature display is 2 °C.
The results of in vivo thermal diffusivity estimation and measurement in rabbit back muscle are presented in . The overall mean of each method is shown in the far left column of , with error bars extending to ± 1 SD from the mean. As with the ex vivo experiments, the normalised SD of measurements was smallest with the invasive method (5%), progressively greater with the Gaussian SAR/heat and cool (15%) and Gaussian SAR/cool only methods (23%), and greatest in the Gaussian temperature method (83%). Differences between the SD values of the non-invasive methods were significant (p < 0.03).
Figure 5. Thermal diffusivity measurements and estimates in in vivo rabbit back muscle. Invasive transient line source measurements (white column) serve as the reference standard and were made at 4–5 locations in the back muscle. Non-invasive MR temperature-based estimates were repeated 6–7 times at two locations in each animal. Two estimates using the Gaussian temperature method in rabbit 1 do not fit within the limits of the plot (α = −0.159, 0.554 mm2/s). Results for the combination of all in vivo experiments are shown in the left column (dark grey) with error bars extending to ± 1 SD from the mean value.
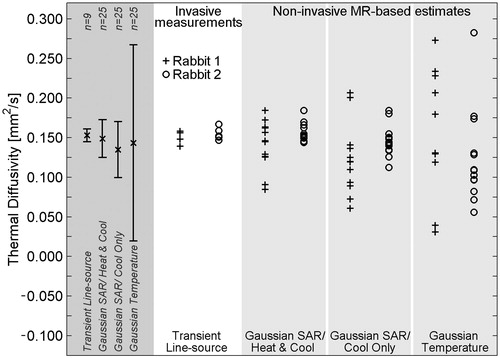
provides the mean and SD of in vivo thermal diffusivity estimates and measurements displayed in . The overall mean thermal diffusivity values for non-invasive estimation methods and invasive measurements matched well, varying from 0.135 mm2/s to 0.153 mm2/s, less than a 12% error when using invasive measurements as the reference.
Table 4. In vivo results of thermal diffusivity measurement and estimation in rabbit back muscle presented as the mean value with SD values in parentheses. Thermal diffusivity units are in mm2/s.
Discussion
This study demonstrates that both the Gaussian temperature and Gaussian SAR methods can accurately and non-invasively estimate tissue thermal diffusivity in ex vivo and in vivo situations using MRgFUS data with temperature rises of∼10 °C. Because the precision of the Gaussian SAR method was better than the Gaussian temperature method, fewer estimates would potentially be required with that method to confidently establish the tissue thermal diffusivity for use in pretreatment planning of MRgFUS thermal therapies.
Accuracy of MR temperature-based methods
To the authors’ knowledge this is the first study to assess the accuracy of either of these two MRgFUS-based thermal diffusivity estimation methods by comparison with standard invasive measurements. Comparing the mean values (×symbol) in the left columns of and , which are also found in the bottom rows of and , it is clear that the non-invasive estimation methods are consistent with the invasive standard methods for measuring thermal diffusivity. Using invasive measurements as truth (α = 0.145 mm2/s for ex vivo porcine muscle, α = 0.153 mm2/s for in vivo rabbit muscle), the overall error for the non-invasive MR-based methods is less than 12% in both ex vivo (n = 30) and in vivo (n = 25) situations.
These values also fall within the range of published literature values. For porcine muscle, thermal diffusivity is reported between 0.117 and 0.166 mm2/s in a temperature range of −10–40 °C [Citation28,Citation29]. The ICRU report on tissue properties [Citation30] reports a reference skeletal muscle thermal diffusivity of 0.147 mm2/s and a range of 0.140 to 0.153 mm2/s at 37 °C from animal data.
In practice, while an individual estimate from a single MRgFUS sonication may not accurately represent the tissue thermal diffusivity (see light grey columns of and ), repeating sonications many times at each location would ensure confidence in the accuracy of the thermal diffusivity mean. Unfortunately this approach is not clinically desirable for two reasons. First, it could make the pretreatment procedure long and expensive. Second, the cumulative effect of repeated heating could lead to unintended tissue damage. A better alternative is to improve the precision of these estimation techniques so that no more than one or two measurements are required to ensure an accurate tissue thermal diffusivity value.
Precision of MR temperature-based methods
Since precision represents the ability of a measurement to be consistently reproduced, the SD of measurements repeated at the same location (or even different locations if the sample is homogeneous) serves as a measure of a method’s precision. In this study the SD of all ex vivo pork muscle diffusivity estimates was 16% of the true diffusivity (determined by invasive measurements) for the Gaussian temperature method and 10% for the Gaussian SAR/cool only method. For in vivo results, the SD of estimates was 83% and 23% for the Gaussian temperature and Gaussian SAR/cool only methods, respectively. Because these two methods make use of the same spatial and temporal data for fitting, these statistically significant differences in precision indicate that the Gaussian SAR/cool only method is less sensitive to noise in the MR temperature data than the Gaussian temperature method.
It is believed that this difference in noise sensitivity is due to the difference in how these two methods are implemented. While each of them uses the fminsearch algorithm, the Gaussian temperature method performs fits to spatial data multiple times, one fit for each time frame of the cooling period. The Gaussian SAR/cool only method uses exactly the same temperature data as the Gaussian temperature method, but applies a single fit to all of the spatial and temporal data. Because the method makes use of all the data at once, it should be less susceptible to errors introduced by noise than the Gaussian temperature method, whose multiple fits to smaller data sets are more vulnerable to noise errors.
The precision of the Gaussian SAR method is further improved when the analytical temperature solution to heating, as well as cooling, is applied in the Gaussian SAR/heat and cool method. The overall normalised SD in ex vivo samples was reduced from 10% to 7% by including the heating data, and in vivo SD values dropped from 23% to 15%, each of which are statistically significant changes (p < 0.03). The Gaussian SAR method with the addition of heating data is likely more precise for two reasons.
Firstly, as was seen when comparing the Gaussian temperature and Gaussian SAR/cool only methods, fitting to more data simultaneously makes a method less vulnerable to noise errors. The additional data included in the Gaussian SAR/heat and cool method are especially useful because the temperature SNR is greater during heating than for much of the cooling data, as can be seen in .
Secondly, the addition of heating data causes the Gaussian SAR/heat and cool method to converge more consistently to fitting parameters C and β in Equations 2 and 3. The SDs of these parameters were reduced by approximately 50% in the ex vivo study by including the heating data; the in vivo SD values decreased over 80%. When the Gaussian SAR/cool only method finds an estimate of these two parameters, which are directly related to the FUS beam amplitude and width, the parameters are necessarily extrapolated from data in which absorption of the focused ultrasound beam is not present. On the other hand, the Gaussian SAR/heat and cool method includes the physics of the FUS sonication directly, allowing for more precise determination of the SAR-linked fitting parameters C and β. The improved precision of these two parameters contributes to a corresponding improvement in the precision of thermal diffusivity estimates, as seen when comparing the cool only and heat and cool results.
It may be argued that estimates made exclusively from heating data could be even more precise. However, early results of this study (not shown) demonstrated that while the temperature SNR is lower, the cooling temperature data still contains useful information and improves the precision of thermal diffusivity estimates. This was the initial motivation in utilising Equation 3 in this study.
The significance of precision is that even when two methods are accurate, it will take fewer sonications to establish the thermal diffusivity of the tissue using a method with better precision. Currently, the precision of these non-invasive methods is limited by unavoidable MR noise, the desire to avoid ablative temperatures in pretreatment protocols (limiting the temperature SNR values obtainable), and the accuracy of MR temperature reconstruction methods [Citation12,Citation17,Citation21]. With the continuing improvements being made to MR temperature imaging accuracy and precision, these non-invasive methods of estimating local tissue thermal diffusivity have the potential to become very useful in pretreatment planning of MRgFUS thermal therapies.
Significance of invasive method results
It should be emphasised that the SD of non-invasive thermal diffusivity estimates and the SD of invasive measurements with the transient line source method are not directly comparable. Because only single measurements are made at several locations in the sample, SD values for the invasive transient line source method are a measure of the tissue sample homogeneity and do not address the precision of the measurement technique. Pork muscle was found to be very homogeneous, both within samples and across different samples, indicating that in future studies a thermal diffusivity of 0.145 mm2/s may be used as a reference standard. Rabbit back muscle was more variable. Because the tissue of interest in the rabbit was smaller and not excised, the invasive probes used to measure thermal diffusivity may have encountered different tissue types along their length, affecting thermal diffusivity measurements.
Study limitations
This study has sought to evaluate the accuracy and precision of two non-invasive MRgFUS thermal diffusivity estimation methods. The methods assume the tissue is homogeneous and further studies would be required to assess their applicability in heterogeneous tissues. Invasive measurements are also limited by this approximation of homogeneity, and all of these methods, invasive and non-invasive, when applied in heterogeneous tissues, measure a tissue average thermal diffusivity that would also be useful in patient treatment planning. These methods also assume the tissue thermal diffusivity is constant, which may not be a reasonable approximation for the much larger temperature ranges of interest in MRgFUS therapies, since property changes from water loss and protein denaturation at higher ablative temperatures can significantly alter thermal histories during heating [Citation31].
Using an optimisation routine that is more robust to outliers in the noise, such as an L1 objective function, may affect each of these thermal diffusivity estimation methods to different degrees, and might affect the conclusions of this study. It is anticipated that implementing such a function would be beneficial to both of these methods and will be considered in future work.
The current study did not address how perfusion or blood flow from large vessels might affect the two non-invasive methods. Cheng and Plewes [Citation12] demonstrated that as long as perfusion is constant and homogeneous in a Pennes blood flow model [Citation32], it does not affect the spatial distribution of temperatures and should not affect their estimation technique. Dillon et al. [Citation16] showed in simulations that high perfusion (>10 kg/m3/s) will significantly affect estimates of the FUS SAR. Such errors would also be seen in thermal diffusivity values from that estimation method at high perfusion levels. In the current study, in vivo thermal diffusivity estimates using the Gaussian SAR/heat and cool method gave the same values as the invasive transient line source method in the same tissue after the animals had been euthanised (<3% difference); therefore perfusion values did not significantly affect the diffusivity estimates. These results were not surprising given that resting muscle perfusion is generally less than 1 kg/m3/s [Citation1]. In tissues with higher perfusion, different analytical solutions that include blood flow, or ex vivo studies for estimating thermal diffusivity may be necessary to obtain reliable results.
Conclusion
This study has shown that both of the non-invasive MRgFUS thermal diffusivity estimation methods can accurately quantify tissue thermal diffusivity if a sufficient number of heating sonications are applied. The Gaussian SAR method demonstrated better precision than the Gaussian temperature method because it is less sensitive to noise in MR temperature data and the method can make use of heating data as well as cooling data. In the clinical setting, application of these methods for accurate determination of tissue thermal diffusivity will contribute to improved treatment safety and efficacy in MRgFUS treatment planning.
Declaration of interest
Financial support for this work was provided by Siemens Healthcare AG, the FUS Foundation, the Ben and Iris Margolis Foundation, and National Institutes of Health grants R01 EB013433 and R01 CA134599. The authors alone are responsible for the content and writing of the paper.
Acknowledgements
The authors would like to thank Dennis Parker, Nick Todd, and Josh de Bever for their contributions to this work.
Related Research Data
References
- Hasgall PA, Neufeld E, Gosselin MC, Klingenböck A, Kuster N. IT’IS database for thermal and electromagnetic parameters of biological tissues, version 2.4. www.itis.ethz.ch/database (accessed 30 July 2013)
- Chen MM, Holmes KR, Rupinskas V. Pulse-decay method for measuring the thermal conductivity of living tissue. J Biomech Eng 1981;103:253–60
- Valvano JW, Allen JT, Bowman HF. The simultaneous measurement of thermal conductivity, thermal diffusivity, and perfusion in small volumes of tissue. J Biomech Eng 1984;106:192–7
- Chato JC. Measurement of thermal properties of biological materials. In: Shitzer A, Eberhard RC, eds. Heat Transfer in Medicine and Biology. New York: Plenum, 1985, pp. 167–92
- Bowman HF. Estimation of tissue blood flow. In: Shitzer A, Eberhard RC, eds. Heat Transfer in Medicine and Biology. New York: Plenum, 1985, pp. 193–230
- Bhavaraju NC, Cao H, Yuan DY, Valvano JW. Measurement of directional thermal properties of biomaterials. IEEE Trans Biomed Eng 2001;48:261–7
- Kharalkar NM, Hayes LJ, Valvano JW. Pulse-power integrated-decay technique for the measurement of thermal conductivity. Meas Sci Technol 2008;19:1--10
- Milner TE, Goodman DM, Tanenbaum BS, Anvari B, Nelson JS. Noncontact determination of thermal diffusivity in biomaterials using infrared radiometry. J Biomed Opt 1996;1:92–7
- Telenkov SA, Youn J, Goodman DM, Welch AJ, Milner TE. Non-contact measurement of thermal diffusivity in tissue. Phys Med Biol 2001;46:551–8
- Kondyurin AV, Sviridov AP, Obrezkova MV, Lunin VV. Noncontact measurement of thermal and optical parameters of biological tissues and materials using IR laser radiometry. Russian J Phys Chem A 2009;83:1405–13
- Anand A, Kaczkowski PJ. Noninvasive measurement of local thermal diffusivity using backscattered ultrasound and focused ultrasound heating. Ultrasound Med Biol 2008;34:1449–64
- Cheng HL, Plewes DB. Tissue thermal conductivity by magnetic resonance thermometry and focused ultrasound heating. J Magn Reson Imaging 2002;16:598–609
- Dragonu I, de Oliveira PL, Laurent C, Mougenot C, Grenier N, Moonen C, et al. Non-invasive determination of tissue thermal parameters from high intensity focused ultrasound treatment monitored by volumetric MRI thermometry. NMR Biomed 2009;22:843–51
- Cornelis F, Grenier N, Moonen CT, Quesson B. In vivo characterization of tissue thermal properties of the kidney during local hyperthermia induced by MR-guided high-intensity focused ultrasound. NMR Biomed 2011;24:799–806
- Zhang J, Mougenot C, Partanen A, Muthupillai R, Hor PH. Volumetric MRI-guided high-intensity focused ultrasound for noninvasive, in vivo determination of tissue thermal conductivity: Initial experience in a pig model. J Magn Reson Imaging 2013;37:950–57
- Dillon CR, Vyas U, Payne A, Christensen DA, Roemer RB. An analytical solution for improved HIFU SAR estimation. Phys Med Biol 2012;57:4527–44
- Dillon CR, Todd N, Payne A, Parker DL, Christensen DA, Roemer RB. Effects of MRTI sampling characteristics on estimation of HIFU SAR and tissue thermal diffusivity. Phys Med Biol 2013;58:7291–307
- Abramowitz M, Stegun IA. Handbook of mathematical functions: With formulas, graphs, and mathematical tables. New York: Dover, 1964
- Carslaw HS, Jaeger JC. Conduction of heat in solids. London: Oxford University Press, 1959
- Roemer PB, Edelstein WA, Hayes CE, Souza SP, Mueller OM. The NMR phased array. Magn Reson Med 1990;16:192–225
- Todd N, Vyas U, de Bever J, Payne A, Parker DL. The effects of spatial sampling choices on MR temperature measurements. Magn Reson Med 2011;65:515–21
- De Poorter JD, De Wagter C, De Deene Y, Thomsen C, Stahlberg F, Achten E. Noninvasive MRI thermometry with the proton resonance frequency (PRF) method: In vivo results in human muscle. Magn Reson Med 1995;33:74–81
- Ishihara Y, Calderon A, Watanabe H, Okamoto K, Suzuki Y, Kuroda K, et al. A precise and fast temperature mapping using water proton chemical shift. Magn Reson Med 1995;33:814–23
- Rieke V, Vigen KK, Sommer G, Daniel BL, Pauly JM, Butts K. Referenceless PRF shift thermometry. Magn Reson Med 2004;51:1223–31
- Sapareto SA, Dewey WC. Thermal dose determination in cancer therapy. Int J Radiat Oncol Biol Phys 1984;10:787–800
- McDannold NJ, King RL, Jolesz FA, Hynynen KH. Usefulness of MR imaging-derived thermometry and dosimetry in determining the threshold for tissue damage induced by thermal surgery in rabbits. Radiology 2000;216:517–23
- Dewhirst MW, Viglianti BL, Lora-Michiels M, Hanson M, Hoopes PJ. Basic principles of thermal dosimetry and thermal thresholds for tissue damage from hyperthermia. Int J Hyperthermia 2003;19:267–94
- Kent M, Christiansen K, Van Haneghem IA, Holtz E, Morley MJ, Nesvadba P, et al. COST 90 collaborative measurements of thermal properties of foods. J Food Eng 1984;3:117–50
- Sanz PD, Alonso MD, Mascheroni RH. Thermophysical properties of meat products: General bibliography and experimental values. Trans ASAE 1987;30:283–9
- International Commission on Radiation Units and Measurements. Tissue Substitutes, Phantoms and Computational Modelling in Medical Ultrasound. ICRU Report 61. Bethesda, MD: ICRU, 1998
- Choi J, Morrissey M, Bischof JC. Thermal processing of biological tissue at high temperatures: Impact of protein denaturation and water loss on the thermal properties of human and porcine liver in the range 25–80 °C. ASME J Heat Transfer 2013;135:1--7
- Pennes HH. Analysis of tissue and arterial blood temperatures in the resting human forearm. J Appl Physiol 1948;1:93–122