
Abstract
Purpose: The aim of this study was to characterise changes in tissue volume during image-guided microwave ablation in order to arrive at a more precise determination of the true ablation zone. Materials and methods: The effect of power (20–80 W) and time (1–10 min) on microwave-induced tissue contraction was experimentally evaluated in various-sized cubes of ex vivo liver (10–40 mm ± 2 mm) and muscle (20 and 40 mm ± 2 mm) embedded in agar phantoms (N = 119). Post-ablation linear and volumetric dimensions of the tissue cubes were measured and compared with pre-ablation dimensions. Subsequently, the process of tissue contraction was investigated dynamically during the ablation procedure through real-time X-ray CT scanning. Results: Overall, substantial shrinkage of 52–74% of initial tissue volume was noted. The shrinkage was non-uniform over time and space, with observed asymmetry favouring the radial (23–43 % range) over the longitudinal (21–29%) direction. Algorithmic relationships for the shrinkage as a function of time were demonstrated. Furthermore, the smallest cubes showed more substantial and faster contraction (28–40% after 1 min), with more considerable volumetric shrinkage (>10%) in muscle than in liver tissue. Additionally, CT imaging demonstrated initial expansion of the tissue volume, lasting in some cases up to 3 min during the microwave ablation procedure, prior to the contraction phenomenon. Conclusions: In addition to an asymmetric substantial shrinkage of the ablated tissue volume, an initial expansion phenomenon occurs during MW ablation. Thus, complex modifications of the tissue close to a radiating antenna will likely need to be taken into account for future methods of real-time ablation monitoring.
Introduction
Thermal ablation therapies rely on the interaction between a physical energy source such as microwave (MW) or radiofrequency (RF) and the tissue to heat the target cells sufficiently to induce irreversible injury. To destroy a tumour the entire target volume must be subject to cytotoxic temperatures for an adequate amount of time that increases as the ablation temperature is lowered [Citation1]. Thus, irreversible cellular damage is obtained increasing the tissue temperature to 46 °C for 60 min; or to 50–52 °C for 4–6 min. Increasing the temperature over to 60 °C leads to almost instantaneous coagulation and above 100 °C the tissue carbonises.
Minimally invasive thermal ablation technologies are becoming ever more prevalent in clinical practice and have the potential to improve upon current therapies [Citation1–3]. They are less invasive and less expensive than surgery, and allow treatment of non-surgical patients with satisfactory results. When thermal ablation systems are used with appropriate imaging it is possible to accurately plan and control the tumour ablation operation improving the placement of the applicator into the target tissue, detecting the shape of the ablated area and the surrounding anatomy, discriminating the rim of the treated tumour, and detecting complications in the post-ablation procedures [Citation4–7]. Nevertheless, ablation techniques require further study and investigation to improve the clinical procedures. In fact, the implementation of ablation treatment planning presents challenging issues, relying on the structural modifications that the target tissue undergoes by RF or MW heating, yielding to changes in both dielectric and thermal properties, and eventually affecting the size and shape of the induced thermal lesion [Citation8].
For MW thermal ablation, the temperature increase is induced by an electromagnetic (EM) field in the MW frequency range (typically 915 MHz or 2.45 GHz). Unlike RF, MW energy can propagate in hydrated as well as in desiccated tissue and it is not limited by tissue charring [Citation9,Citation10]. As a consequence, MW ablation induces higher temperatures close to the radiating antenna and consequently enables potentially greater zones of coagulation than RF ablation [Citation9–12]. When thermal ablation is used to treat a tumour it is usually a requirement that the ablated area should extend to the whole tumour volume including an ablative margin of at least 5 mm of apparently healthy tissue [Citation1]. Accordingly, great accuracy in the delivery of the MW field and proper understanding of the behaviour of the biological tissue during the treatment are required to control the ablated volume.
Recently, shrinkage of the ablated tissue volume has been reported in clinical practice and in experimental investigation of MW, and to a lesser extent in RF heating [Citation13–16]. Looking at the spatial and temporal tissue contraction via CT scans performed during a MW ablation procedure, significant shrinkage was observed during the first minutes of heating [Citation13,Citation16]. Moreover, expansion of the tissue was also noticed in some samples [Citation14,Citation17]. The reported results underline that the volume occupied by the ablated tissue as measured at the end of the thermal ablation procedure is smaller than the volume occupied by the equivalent untreated tissue. Moreover, the shrinkage is directly linked to the deployed energy [Citation15], and it increases with the temperature [Citation16]. As a consequence, it is important to be able to adequately characterise the shrinkage of the tissue during a MW thermal ablation procedure ideally in real-time in order to correctly predict the true treatment volume.
The aim of this study was to further investigate and better quantify the tissue shrinkage that occurs during a MW ablation treatment, particularly by characterising the extent of the contraction over time in well-defined blocks of tissue. To this end, ex vivo experimental set-ups were developed and used to ablate small cubes of tissue using different MW power values and different times of treatment. This approach allowed the development of a reproducible experimental set-up and standardised experimental conditions to measure the tissue’s shrinkage with as much accuracy as possible. Moreover, this enabled us to create different-sized cubes to study different amounts of tissue undergoing carbonisation and/or ablation processes from MW application. Changes in tissue volume were evaluated comparing the post-ablation dimensions of the treated cubes with the pre-ablation ones. Finally, a CT imaging system was also used to monitor the dynamic process of tissue volume changes while MW energy was actively applied to tissue.
Materials and methods
Tissue samples
Various-sized cubes of ex vivo bovine liver (side: 10, 20, 30 and 40 mm ± 2 mm) and ex vivo turkey breast muscle (20 and 40 mm ± 2 mm) were cut from larger blocks of tissue (up to 10 kg for the liver) which were obtained from a local slaughterhouse and stored in freezer at −40 °C. The day before the experiment, one piece was defrosted and cut as required for the specific test. Before each experiment, the temperature of the tissue was measured to insure an initial ablation temperature within the range 18–24 °C.
Agar phantoms
The cubes of ex vivo tissue were submerged in an agar phantom (9%) to lower the electromagnetic and thermal discontinuity at the tissue boundaries. Tissues were inserted in a hole cut precisely centrally in the simulator and then covered with additional agar diluted in saline solution (). A glass beaker (500 mL, inner diameter 10 cm) was used to contain the phantom and tissue. The dielectric phantom was prepared on a combined hot-plate magnetic-stirrer device, mixing distilled water (400 mL), agar powder (36 g, i.e. 9% of the water weight), sucrose (1.5 g), and sodium chloride (1.5 g). Sodium chloride was added to ensure an electrical conductivity (σ = 2.2 S/m @ 2.45 GHz) approximating that of liver tissue (σ = 1.8 S/m @ 2.45 GHz) [Citation18] with the sucrose aiding solidification. The chosen agar concentration gave the most suitable density to maintain the position of the cube of tissue during the whole ablation procedure. For dynamic CT studies, the phantom recipe was adjusted to enable better discrimination of the agar from the liver during the CT scan, in particular by replacing 10% of distilled water with iodinate contrast agent (Iomeron 350, iomeprol 714.4 mg/mL, Bracco, Milan, Italy) ().
Figure 1. Experimental set-up. (A) Schematic of the side view with reference system: antenna (black), ex vivo tissue (maroon inner-square) and dielectric simulator (grey). (B) Photo of the set-up.
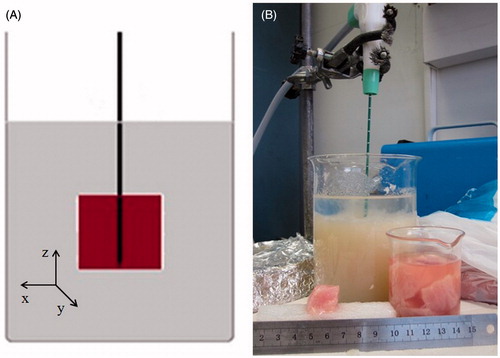
Figure 2. Experimental set-up. (A) Schematic of the side view with reference system: antenna (black), ex vivo tissue (maroon inner-square) and dielectric simulator (grey). (B) Photo of the set-up.
MW ablation equipment
An internally cooled 14-gauge MW ablation antenna (HS Amica probe 14 G, HS Hospital Service, Rome, Italy) was used. This applicator is made from an asymmetrical dipole with a miniaturised choke, which limits the back heating effects, and a pointed capacitive cap that allows an easier insertion of the applicator [Citation2]. The applicator is internally cooled via a fully automated peristaltic pump: distilled water at 15–16 °C traverses the length of the antenna up to the choke section to avoid the overheating of the applicator.
The MW antenna was connected to a generator (HS Amica GEN H 1.0) via a coaxial cable. The generator can supply a MW power up to 140 W at 2.45 GHz, and monitors the probe temperature as well as the direct and reflected power continuously.
Post-ablation changes in tissue volume: experimental set-up and evaluation
The MW ablation antenna was inserted into the centre of the cube of tissue with the tip reaching the boundary of the cube with the active portion of the antenna surrounded by the tissue and further by the agar phantom. This positioning optimised the operating and boundary conditions, preventing potential EM field reflections and interferences caused by other tools and instruments used in the set-up.
Various combinations of MW power and time of irradiation were applied to the ex vivo tissues; the achieved contraction was measured as a difference between the cube dimensions before and after the ablation procedure. Percentage of tissue shrinkage was evaluated as a percentage of the initial size, applying the reference system centred on the antenna tip (). The reference power was defined as 60 W, measured at the probe input section, based upon clinical protocols suggested by the manufacturer [Citation19–21]. Accordingly, a first set of experiments was performed at the fixed power of 60 W for five different time intervals (). Time curves were constructed for liver cubes of four different sizes (10, 20, 30 and 40 mm) (N = 69) and for muscle cubes of two different sizes (20 and 40 mm) (N = 31). In the second set of experiments the irradiation time was fixed at 5 min and the power was varied (see ). These power-time combinations were tested on liver cubes of 20 mm (N = 19).
Table 1. Number of trials for each combination of tissue type, cube size, power supplied and time interval.
The temperature of the tissue during the MW ablation process decreases with the distance from the antenna axis; temperature values of about 100 °C or higher are reached in the central carbonised area, while temperature values between 62 °C and 98 °C have been recorded within the outer thermal ablated area [Citation8].
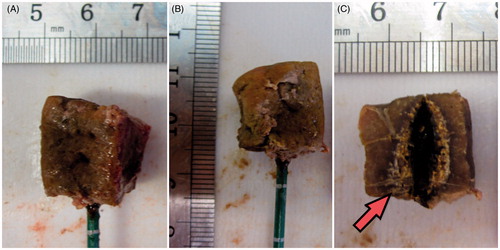
At the end of the ablation procedure, the cube was extracted from the agar phantom, measured and photographed to record the post-ablation size (). The tissue was then sectioned along the antenna’s axis to measure the overall coagulated region and the central carbonised region (). The radial and longitudinal dimensions were measured as the average height of the cube sides, and the volumetric dimension was obtained from the cube’s volume formula.
Figure 3. Example of a heat-treated cube: the 20-mm ex vivo bovine liver cube was ablated with a 14-gauge MW antenna operated at 60 W for 5 min. (A) and (B) Treated pieces of tissue with the antenna inserted. (C) Section of the cube along the antenna axis: the carbonised area is shown (red arrow).
A minimum of three trials for each power-time combination were conducted (N = 119 ablations in total, see ). Results are reported in terms of average values, with minimum and maximum values presented and best-fit lines drawn to highlight the behaviour of the collected data.
Dynamic changes in tissue volume: experimental set-up and evaluation
MW ablation procedures were performed on cubes of ex vivo tissue under CT control, to evaluate the real-time behaviour of the tissue while heated. In these experiments, cubes of ex vivo bovine tissue (20 mm and 30 mm) were used, with the MW antenna operating at 60 W for 10 min.
Similar to the initial experiments, the MW ablation antenna was inserted into the cube of liver, immersed in the phantom, with the antenna’s tip reaching the boundary of the liver cube and the active part of the antenna surrounded by the tissue. In place of the glass beaker, a plastic box was used to contain the tissue and dielectric phantom, and the antenna was inserted parallel to the work bench. The set-up was placed into the CT gantry (Brilliance iCT, Philips Healthcare, Cleveland, OH, USA) and operated under CT control. The CT scanner was calibrated before the experiment and a reference scan was acquired to identify the position of the apparatus. Subsequently, a CT protocol (120 kVp and 500 mAs) was used to monitor the experiments, similar to that previously reported in [Citation22]. CT scans were obtained every 29 s during the 10 min of the ablation procedure. At the conclusion of the ablation and scanning, the cube of liver was extracted from the agar phantom for visual inspection and measurement as described above.
Results
Post-ablation changes in tissue volume
Outcomes of the experiments, conducted on different-sized cubes of ex vivo liver tissue (10–40 mm) as a function of time for a radiated power of 60 W, are presented in . demonstrates that a volume reduction in the range of 52–74% of the initial volume is obtained after 10 min. For the 10-mm cube, the volume is already less than 50% of baseline after 2.5 min, whereas larger cubes reach a similar extent of contraction after about 5 min. Furthermore, during all ablation times studied, the 10-mm cubes show a percentage volume reduction greater than the other cube sizes.
Figure 4. (A) Volumetric, (B) radial and (C) longitudinal shrinkages as a function of the ablation time in ex vivo bovine liver cubes of different sizes treated with a 14-gauge MW antenna radiating 60 W.
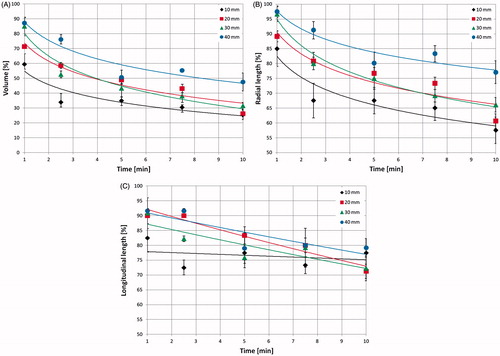
Asymmetry of the tissue shrinkage process was also noted. Specifically, the tissue shrinks over time following a logarithmic relationship in the radial direction (R2 = 0.86–0.98), whereas a linear relationship is observed in the longitudinal direction (R2 = 0.74–0.94) for all samples of sufficient tissue volume (i.e. those greater than 1 cm3). Moreover, the radial shrinkage is greater than that in the longitudinal direction for all cube sizes and times of irradiation studied ( vs. ). For example, at 10 min, for the 10-mm cube, the radial shrinkage is 43% and the longitudinal one is 23%, and for the 30-mm cube, they are 34% and 28%, respectively. The radial shrinkage is more evident in the smallest cubes for all times of irradiation; as an example, at 5 min the radial shrinkage is 33% for the 10-mm cube and 20% for the 40-mm cube (). The same can be said for the asymmetry of the shrinkage.
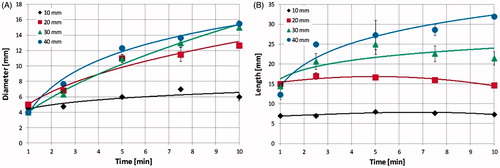
displays the dimensions of the carbonised central region as a function of time for the same operating conditions as in . From it is apparent that the carbonised region of the 10-mm cubes already extends to 4.5 mm in diameter after 1 min of ablation, and then increases slowly with time until reaching 6 mm in diameter at 10 min. The diameter of the carbonised region of the larger cubes increases more consistently with time, e.g. in the 40-mm cube from 4 mm (at 1 min) to 15.5 mm (at 10 min of ablation). In contrast to radial measurements, the length of the carbonised region () does not appreciably change with time in the 10-mm cubes, remaining approximately constant, i.e. equal to 7 mm, from the first minute of ablation. For larger cubes, carbonisation reaches a maximum at a time which depends on the cube dimensions: 2.5 min for the 20-mm cube, 5 min for the 30-mm cube, whereas for the 40-mm cube it is still increasing after 10 min. This behaviour can be represented by a logarithmic time-vs.-cube dimensions relationship, according to the formula y = 14.43 ln(x) + 6.78 (R2 = 1). Comparing the rate of carbonisation with that of contraction, the radial dimension shows similar behaviour (e.g. a logarithmic time-dependence in the 40-mm cubes: y = 5.06 ln(x) + 3.71, R2 = 0.99 for the shrinkage curve and y = 3.43 ln(x) + 0.89, R2 = 0.93 for the carbonisation curve). On the other hand, during the first minutes of heating, the length of the carbonised region grows faster than the longitudinal contraction, with the only exception being the 10-mm cubes where both slightly increase with time.
Figure 5. (A) Diameter and (B) length of the carbonised region as a function of the ablation time in ex vivo bovine liver cubes of different sizes, treated with a MW antenna radiating 60 W (same operating conditions as ).
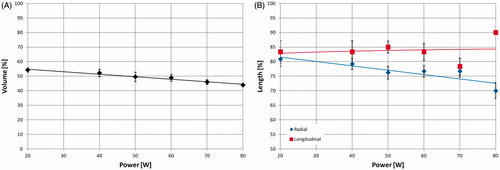
shows the shrinkage obtained for 20-mm cubes treated for 5 min with increasing MW power (from 20 W to 80 W). There is a linear decrease (R2 = 0.97) of the post-ablation volume dimension with increasing power (46% shrinkage at 20 W, 56% at 80 W) (). However, the radial dimension (blue) decreases with the power, whereas the longitudinal dimension (red curve) is almost constant (equal to about 84%) (). At 80 W the longitudinal contraction is substantially lower than in the other cases. This latter observation occurred in tandem with the phantom liquefying, pointing to a probable breakdown of the set-up used, with the density changes likely leading to antenna mismatching.
Figure 6. Volumetric (A), radial (B, blue rhombus-dots) and longitudinal (B, red square-dots) shrinkages as a function of the power supplied to 20-mm ex vivo bovine liver cubes treated with a 14-gauge MW antenna for 5 min. The longitudinal data point at 80 W has no standard deviation because all the measured data were the same.
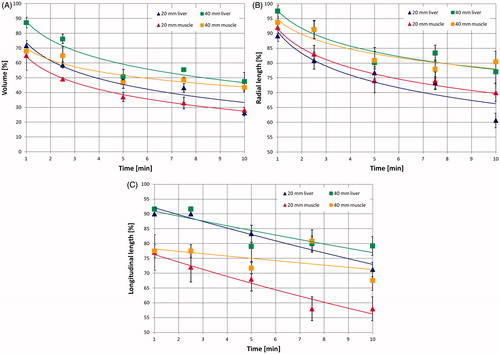
compares the results obtained in cubes (20 mm and 40 mm) of ex vivo bovine liver and ex vivo turkey muscle radiating 60 W for different times. These curves confirm a logarithmic decrease of the volume (liver: y = −0.18 ln(x) + 0.74, R2 = 0.92; muscle: y = −0.16 ln(x) + 0.64, R2 > 0.99 for 20-mm cubes) and of the radial dimension (liver: y = −0.11 ln(x) + 0.91, R2 = 0.86; muscle: y = −0.10 ln(x) + 0.92, R2 = 0.97 for 20-mm cubes). A linearly decreasing trend of the longitudinal dimension was observed in both cases ( = 0.94 and
= 0.93), but with more substantial shrinkage (16%) in the muscle cubes with respect to the liver cubes.
Figure 7. (A) Volumetric, (B) radial and (C) longitudinal shrinkages as a function of the ablation time of ex vivo bovine liver and turkey muscle cubes treated with a 14-gauge MW antenna at 60 W.
Dynamic changes in tissue volume
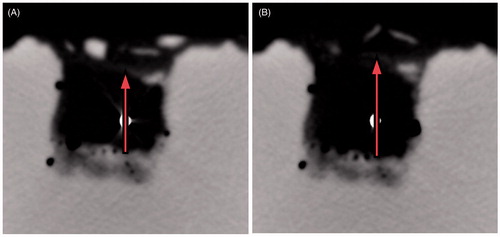
reports the radial dimension obtained from the CT monitoring of 20-mm (three tests) and 30-mm (one test) ex vivo bovine liver cubes treated at 60 W for 10 min. At CT, an expansion of the cubes of tissue was noted over the first 3 min of the ablation procedure (about 31% for the 20-mm cubes and about 23% for the 30-mm cube), followed by contraction. At the end of the experiments a final contraction of about 43% for the 20-mm cube and about 28% for the 30-mm cube was found. The radial expansion (highlighted in ) proved more consistent along the vertical direction: along the horizontal direction it was about 4% for the 20-mm cube, and not obtained in the experiment on the 30-mm cube.
Figure 8. Radial dimension of ex vivo bovine liver cubes as a function of ablation time (radiated power 60 W) observed under CT control: 30-mm cube (blue rhombus-dots) and 20-mm cubes (red square-dots).
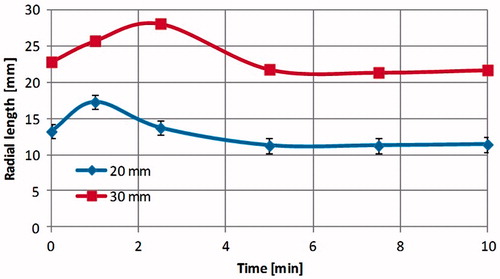
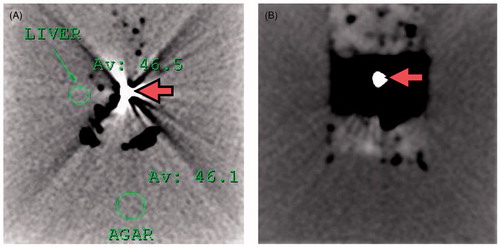
Figure 9. CT images obtained during a 60 W MW ablation procedure performed on 30-mm ex vivo bovine liver cubes (less reflective) submerged in agar phantom (more reflective). A section orthogonal to the antenna axis at the antenna feed point is represented. The white dot in the middle is the 14-gauge antenna (A) prior to the heat-treatment; (B) after 1.5 min of heating. From the figure the expansion phenomenon is evident. On top of the tissue cube the agar phantom shows a poor contrast due to the presence of the added saline solution (see Materials and methods section).
Discussion
Minimally invasive MW thermal ablation procedures have great potential for the treatment of focal tumours, provided that the thermally ablated area obtained is carefully predictable and controlled. Recently it has been shown that during thermal ablation procedures a process of tissue contraction occurs, which is tissue-dependent and specific for the ablation technique. In particular it is less pronounced in RF ablation than in MW ablation, where higher temperature values are reached and, consequently, more dehydration is observed, especially close to the radiating energy source [Citation13]. In this work, tissue contraction was investigated as a function of MW power and time of irradiation, measuring the dimensions of different-sized cubes of ex vivo tissue before and after the thermal ablation procedure.
The collected data confirm and extend prior results [Citation13–17]. Previously, investigators had reported: 1) that the relative contraction is most marked near the applicator, 2) that the effect decreases further from the centre of the ablation zone, 3) that the shrinkage depends on the tissue type, and 4) that the contraction rate is an increasing function of temperature. Subsequently, observations of expansion between adjacent markers in the first 2 min of ablation followed by contraction were noted under CT imaging [Citation17]. The acquired CT images suggested water vaporisation. These results were confirmed in more recent works, which also pointed out that most of the radial contraction occurs within the first minutes of ablation [Citation14,Citation16].
Our experiments conducted on tissue cubes (which enable direct determination of tissue shrinkage without placement of markers that could alter energy application or the changes in tissue) confirm substantial tissue shrinkage, in the range of 52–74% of the initial volume. The shrinkage was greater for the smallest cubes: after 10 min of irradiation at 60 W, the average volume of the 10-mm cubes was 26% of the initial value, whereas that of the 40-mm cubes was about 48%. As the smaller the cube dimension, the greater the percentage of volume occupied by the carbonised tissue, the results obtained suggest that contraction occurs mainly in the tissue region where temperature reaches the highest values. Comparing the time-behaviour of the shrinkage () and that of the dimensions of the carbonised region (), it can be noted that the carbonised region extends almost over the whole 10-mm cube even for the shortest time of irradiation (1 min), and then increases slowly with time. In tandem, most of the shrinkage of the 10-mm cubes occurs within 1 min of irradiation. Moreover, the carbonisation shows a time-behaviour similar for the different cube dimensions, and the same can be said for the shrinkage time course. This conclusion is in agreement with the finding that contraction increases with the temperature [Citation16], and since in MW ablation very high temperatures can be reached near the applicator device (i.e. up to 134 °C [Citation8]) with respect to RF ablation (maximum 100 °C), this could also account for the more pronounced contraction found in MW procedures with respect to RF [Citation13].
We further demonstrated that the carbonised region has a variable extension in the different-sized cubes, including the fact that the 10-mm cubes do not extend enough to include all the carbonisation achievable in solid tissue under most conditions. Yet, since in the 10-mm cubes the carbonisation covers almost the whole tissue even for the shortest time of irradiation, the quantification of the shrinkage obtained in these cubes may account for the shrinkage obtainable in carbonised tissue. Further verification will require additional study.
Correlation of our findings with ablation temperatures is also possible based upon prior published observations. In particular, Lopresto et al. [Citation8], used similar MW ablation equipment and performed ablations at 40 W for 10 min; temperatures higher than 98 °C were associated with radial distances from the antenna axis up to about 6 mm, where tissue charring occurred, while temperatures between 62 °C and 98 °C were associated with radial distances between 6 mm and 15 mm, corresponding to the surrounding necrotic zone; temperatures in the range from 53 °C to 62 °C were associated with the outer boundary of the zone of ablation, at the radial distance of 15–18 mm. It follows that in the smallest cubes (i.e. 10 mm), almost the whole tissue is undergoing the highest temperature values, whereas the larger the cube the higher the amount of tissue undergoing lower temperature values.
A non-uniform increase of the volumetric contraction over time was noted in all the cubes, with more than 50% of the shrinkage occurring during the first 5 min of the treatment (). Similarly, an asymmetry between the radial and the longitudinal contraction has been shown for fixed radiated power and different times of irradiation () as well as for fixed times of irradiation and different radiated powers (). Accordingly, the observed shrinkage is non-uniform in time, being more consistent during the first minutes of heating and then reaching a plateau, and for the different cube dimensions, with the smallest cubes showing more substantial and faster contraction (in the 10-mm cube 65% of shrinkage occurs within the first 2.5 min of treatment).
With reference to the asymmetry of the contraction observed comparing radial with longitudinal directional shrinkage, it should be noted that in the longitudinal direction the antenna defines a mechanical boundary condition for the tissue which is not present in the radial direction.
The comparison between two different tissues, i.e. bovine liver and turkey muscle, demonstrated that the MW-induced contraction is also dependent on the type of tissue ablated, with the turkey muscle shrinking more consistently in the longitudinal direction (16%) compared to the bovine liver; whereas the volumetric and radial contraction was not appreciably affected from the type of tissue. The observed behaviour could be due to the different tissue structure and morphology (i.e. the directionality of the muscle fibres) and to the different dielectric properties of the two tissues, which likely correspond to a different absorption of the electromagnetic field. As an example, the relative permittivity and conductivity of healthy human liver at 2.45 GHz are 43.03 and 1.68 S m−1, respectively; whereas those of healthy human muscle are 52.73 and 1.74 S m−1, respectively [Citation23].
Finally, the experiments conducted under CT control showed that tissue expansion occurs within the first 3 min of the heat-treatment, prior to the contraction phenomenon (). The values of final contraction recorded (at 10 min) are within the experimental variability of the results obtained from the post-ablation study. On the other hand, in the post-ablation study a contraction was observed even for the shortest times: after 1 min the volume is 60–87% of its initial value depending on the cube dimension considered (). This different result between the two experiments, with and without the CT control, suggests that the expansion is due to the presence of gasses generated by the very high temperatures reached close to the MW antenna which tend to escape from the tissue. In fact, close to the MW antenna, temperatures as high as 100 °C–120 °C were reached, which caused the vaporisation of liquids [Citation24] and a change in the tissue dielectric and thermal properties [Citation25–29]. The movement of the gas is linked to the tissue structure (e.g. non-homogeneity, presence of vessels) and is not predictable; however, as a general rule, the gas tended to move upward. Indeed, a more consistent expansion of the tissue has been recorded in the vertical direction (31% vs. 4%, for the 20-mm cubes). According to this interpretation, while the CT images are able to capture the mechanical tissue reaction to the gas movements, the measurements performed at the end of the 1-min procedure give time for the gas to completely escape from the tissue, so that only the final contraction can be measured, thus putting into evidence that even for very short procedures the shrinkage phenomenon is present.
The present study quantitatively characterised the tissue contraction during a MW ablation procedure through measurements on different-sized cubes of ex vivo tissue. The importance of quantifying the amount of shrinkage is evident in tumour ablation procedures, where the whole tumour volume including a safety margin of at least 5 mm of apparently healthy tissue must be covered by the ablated area. Accordingly, the evaluation of the true dimension of the tissue volume involved in the ablation process is essential to adequately accomplish the procedure.
The experimental set-up developed enables great accuracy in the measurements, allowing distinction between longitudinal shrinkage, i.e. along the antenna axis, and radial, i.e. orthogonal to the antenna axis. It is interesting to note that in the liver cubes the radial shrinkage is always higher than the longitudinal one, whereas the carbonised region has a greater extension in the longitudinal direction. Considering that the higher the tissue temperatures the higher the shrinkage [Citation16], the difference observed between shrinkage and carbonisation should be further investigated, possibly considering the tissue temperature gradient. Moreover, further investigations are needed to go beyond the limits of this set-up, linked to the discontinuity between ex vivo tissue and the surrounding agar phantom, and to the relation between the electromagnetic field absorption and the cube dimension [Citation2]. In particular, the 10-mm cube is smaller than the maximum absorption area and leaves the hottest spot (i.e. maximum radiated field point) outside the tissue. Understanding the surrounding tissue properties and the relative position between antenna and tissue structure is also essential. A deeper investigation could be conducted to compare the dimensions of the coagulated and carbonised area obtained in the cubes with those achievable in bigger pieces of tissue, and changing the phantom recipe in order to achieve dielectric properties closer to those of ex vivo liver tissue [Citation25]. Moreover, although observed contraction is associated with the temperature values reached by the tissue, different MW antennas may lead to different temperature patterns, so that the same study should be repeated for each type of MW device.
Tissue cubes were used in our ex vivo study to obtain accuracy and reproducibility not possible in vivo. Yet future in vivo studies should be carried out to determine the effects of blood perfusion. Likewise, under in vivo conditions, the presence of mechanical constraints and the elasticity of the tissue fibres in the peripheral zones of the ablated area may attenuate the extension of the observed contraction. Finally, to improve the characterisation of tissue shrinkage, further studies about the expansion observed and the local behaviour of tissue during a MW ablation treatment are likely warranted. How the gas dispersion and the tissue properties influence the outcomes of the procedure could also be investigated by examining the local behaviour of the tissue during the treatment.
In conclusion, the aim of this study was to characterise tissue contraction occurring during a MW ablation procedure. To this end, several cubes of ex vivo tissue were treated with different time-power combinations and the cube dimensions were recorded before and after the ablation procedure. Our results show substantial shrinkage, in the range of 52–74% of initial tissue volume, which is non-uniform with time and more consistent in smaller pieces of tissue. This contraction has been linked to the dimension of the carbonised region. Moreover, the presence of an expansion phenomenon during the first minutes of the heat-treatment was evidenced, presumably due to the movement of gases into the treated tissue. Thus, complex modifications of the tissue close to a radiating antenna will likely need to be taken into account for future methods of real-time ablation monitoring.
Declaration of interest
Nevio Tosoratti, Claudio Amabile and Simone Cassarino are employees of HS Hospital Service, which supported the study through the provision of the MW antennas and generator. The authors alone are responsible for the content and writing of the paper.
Related Research Data
References
- Ahmed M, Brace CL, Lee FT Jr, Goldberg SN. Principles of and advances in percutaneous ablation. Radiology 2011;258:351–69
- Cavagnaro M, Amabile C, Bernardi P, Pisa S, Tosoratti N. A minimally invasive antenna for microwave ablation therapies: Design, performances, and experimental assessment. IEEE Trans Biomed Eng 2011;58:949–59
- Chiang J, Wang P, Brace CL. Computational modelling of microwave tumour ablations. Int J Hyperthermia 2013;29:308–17
- Goldberg SN, Gazelle GS, Solbiati L, Livraghi T, Tanabe KK, Hahn PF, et al. Ablation of liver tumors using percutaneous RF therapy. Am J Roentgenol 1998;170:1023–8
- Mitsuzaki K, Yamashita Y, Nishiharu T, Sumi S, Matsukawa T, Takahashi M, et al. CT appearance of hepatic tumors after microwave coagulation therapy. Am J Roentgenol 1998;171:1397–403
- Raman SS, Lu DSK, Vodopich DJ, Sayre J, Lassman C. Creation of radiofrequency lesions in a porcine model: Correlation with sonography, CT, and histopathology. Am J Roentgenol 2000;175:1253–8
- Brace CL, Hinshaw JL, Laeseke PF, Sampson LA, Lee FT Jr. Pulmonary thermal ablation: Comparison of radiofrequency and microwave devices by using gross pathologic and CT findings in a swine model. Radiology 2009;251:705–11
- Lopresto V, Pinto R, Cavagnaro M. Experimental characterisation of the thermal lesion induced by microwave ablation. Int J Hyperthermia 2014;30:110–18
- Li X, Zhang L, Fan W, Zhao M, Wang L, Tang T, et al. Comparison of microwave ablation and multipolar radiofrequency ablation, both using a pair of internally cooled interstitial applicators: Results in ex vivo porcine livers. Int J Hyperthermia 2011;27:240–8
- Simon CJ, Dupuy DE, Mayo-Smith WW. Microwave ablation: Principles and applications. Radiographics 2005;25:S69–83
- Andreano A, Huang Y, Meloni MF, Lee FT Jr, Brace C. Microwaves create larger ablations than radiofrequency when controlled for power in ex vivo tissue. Med Phys 2010;37:2967–73
- Andreano A, Brace C. A comparison of direct heating during radiofrequency and microwave ablation in ex vivo liver. Cardiovasc Intervent Radiol 2013;36:505–11
- Brace CL, Diaz TA, Hinshaw JL, Lee FT Jr. Tissue contraction caused by radiofrequency and microwave ablation: A laboratory study in liver and lung. J Vasc Interv Radiol 2010;21:1280–6
- Liu D, Brace CL. CT Imaging during microwave ablation: Analysis of spatial and temporal tissue contraction. Paper presented at the Interventional Oncology Sans Frontieres Congress, Villa Erba, Cernobbio, Italy, 29 May–1 June 2013
- Sommer CM, Sommer SA, Mokry T, Gockner T, Gnutzmann D, Bellemann N, et al. Quantification of tissue shrinkage and dehydration caused by microwave ablation: Experimental study in kidneys for the estimation of effective coagulation volume. J Vasc Interv Radiol 2013;24:1241–8
- Rossmann C, Garrett-Mayer E, Rattay F, Haemmerich D. Dynamics of tissue shrinkage during ablative temperature exposures. Physiol Meas 2014;35:55–67
- Brace CL, Gagnon D, Borden Z, C. Roen. Ablation-induced tissue contraction measured by CT: Correlation with dehydration. Poster presented at the World Conference on Interventional Oncology, New York, NY, 9–12 June 2011
- Lopresto V, Pinto R, Lodato R, Lovisolo GA, Cavagnaro M. Design and realisation of tissue-equivalent dielectric simulators for dosimetric studies on microwave antennas for interstitial ablation. Phys Med 2012;28:245–53
- Wang Y, Sun Y, Feng L, Gao Y, Ni X, Liang P. Internally cooled antenna for microwave ablation: Results in ex-vivo and in-vivo porcine livers. Eur J Radiol 2008;67:357–61
- Zhou Q, Jin X, Jiao D, Zhang F, Zhang L, Han X, et al. Microwave ablation: Results in ex vivo and in vivo porcine livers with 2450-MHz cooled-shaft antenna. Chin Med J 2011;124:3386–93
- Hoffmann R, Rempp H, Erhard L, Blumenstock G, Perelra PL, Claussen CD, et al. Comparison of four microwave ablation devices: An experimental study in ex vivo bovine liver. Radiology 2013;268:89–97
- Weiss N, Goldberg SN, Sosna J, Azhari H. Temperature-density hysteresis in X-ray CT during HIFU thermal ablation: Heating and cooling phantom study. Int J Hyperthermia 2014;30:27–35
- Andreuccetti D, Fossi R, Petrucci C. An Internet resource for the calculation of the dielectric properties of body tissues in the frequency range 10 Hz–100 GHz. Available from http://niremf.ifac.cnr.it/tissprop/htmlclie/htmlclie.htm
- Yang D, Converse MC, Mahvi DM, Webster JG. Measurement and analysis of tissue temperature during microwave liver ablation. IEEE Trans Biomed Eng 2007;54:1382–8
- Lopresto V, Pinto R, Lovisolo GA, Cavagnaro M. Changes in the dielectric properties of ex vivo bovine liver during microwave thermal ablation at 2.45 GHz. Phys Med Biol 2012;57:2309–27
- Ji Z, Brace CL. Expanded modeling of temperature-dependent dielectric properties for microwave thermal ablation. Phys Med Biol 2011;56:5249–64
- Ai H, Wu S, Gao H, Zhao L, Yang C, Zeng Y. Temperature distribution analysis of tissue water vaporization during microwave ablation: Experiments and simulations. Int J Hyperthermia 2012;28:674–85
- Lu Y, Nan Q, Li L, Liu Y. Numerical study on thermal field of microwave ablation with water cooled antenna. Int J Hyperthermia 2009;25:108–15
- Gonzales-Suarez A, Trujillo M, Burdio F, Andaluz A, Berjano E. Feasibility study of an internally cooled bipolar applicator for RF coagulation of hepatic tissue: Experimental and computational study. Int J Hyperthermia 2012;28:663–73