
Abstract
Purpose: The main aim of this study was to compare physiological and psychological reactions to heat stress between people who exhibited fast cooling (FC, n = 20) or slow cooling (SC; n = 20) responses to 14 °C cold water immersion. Methods: Forty healthy young men (19–25 years old) were recruited to this study based on their tolerance to cold exposure (FC versus SC). The heat stress was induced using immersion in bath water at 43–44 °C. Motor and cognitive performance, immune variables, markers of hypothalamic–pituitary–adrenal axis activity (i.e. stress hormone concentrations), and autonomic nervous system activity were monitored. Results: In the FC group, time to warm the body from a resting rectal temperature (Tre) of 37.1 ± 0.2 °C before warming to 39.5 °C was 63.7 ± 22.4 min. In the SC group, the time to warm the body from a Tre 37.1 ± 0.3 °C before warming to 39.5 °C was 67.2 ± 13.8 min (p > 0.05 between groups). The physiological stress index (PSI) after warming was 8.0 ± 0.6 and 8.2 ± 1.0 in the FC and SC groups, respectively (p > 0.05 between groups). During warming, the changes in subjective indicators of heat stress did not differ significantly between the FC (7.4 ± 0.5) and SC (7.1 ± 1.1) groups, respectively. Conclusion: The increase in cortisol, epinephrine, norepinephrine, and corticosterone concentrations after passive body heating did not differ between the FC and SC groups. Heat stress did not change indicators of innate and specific immunity in the FC or the SC group. An interesting finding was that heat stress did not affect motor and cognitive function in either group, although central fatigue during 1-min maximal voluntary contraction increased after heat stress in both groups.
Introduction
High environmental temperature impairs neuromuscular [Citation1–4], aerobic [Citation5], and cognitive performance [Citation1,Citation6,Citation7,Citation8–10] and the ability to activate skeletal muscles [Citation1,Citation11]. High temperature also increases central fatigue during exercise [Citation1,Citation3–4], decreases the H-wave, M-wave, and V-wave [Citation1], and increases catecholamine [Citation12–16] and other stress hormone levels [Citation12,Citation16]. Passive heat stress that increases core temperature to >39 °C is associated with an increase in circulating leucocyte numbers primarily because of large increases in circulating neutrophil numbers and smaller increases in circulating lymphocyte and monocyte numbers [Citation17–19]. Hyperthermia increases concentration of interleukin 6 (IL-6), and prolactin suppresses tumour necrosis factor-alfa (TNF-α) gene expression and increases heat shock proteins [Citation20,Citation21]. The concentrations of blood markers such as cortisol and IL-6 are commonly used to evaluate the physiological strain associated with work in the heat [Citation21,Citation22].
The experiment was designed to explore the effect of acute heat stress on physiological and psychological markers measured between two groups of participants who were similar in physical characteristics () but who originally exhibited two different response strategies to 14 °C cold-water immersion (i.e. fast cooling (FC) versus slow cooling (SC)). Individuals in whom the resting rectal temperature (Tre) decreased to a set point of 35.5 °C before the end of the 170-min cooling time were indicated as the FC group; individuals in whom the Tre did not decrease to the set point of 35.5 °C before the end of the 170-min cooling time were classified as the SC group [Citation23]. The set points (i.e. Tre, cooling time) are relevant to a moderate survival risk zone in cold water at 14 °C in humans (based on the classic curve for cold water survival introduced by the Canadian Red Cross).
Table 1. Physical characteristics of participants.
No one has explored the effects of heat stress (warm water immersion) on motor and cognitive performance, immune variables, and the hypothalamic–pituitary–adrenal axis and autonomic nervous system in young men who react differently in physiological mechanism response to cold stress, despite similar physical characteristics. We assessed motor performance (skeletal muscle force, spinal reflexes, supraspinal reflexes, and voluntary contraction force), markers of innate and specific immune function, and neuroendocrine stress indicators in two groups of participants who had demonstrated different responses to cold stress in our earlier study [Citation23]. One group had demonstrated a rapid decrease in rectal temperature (FC group) and the other a slow decrease in rectal temperature (SC group). We reasoned that, originally, FC versus SC related more to an insulative–hypothermic response to cold, and that SC vs FC related more to a metabolic–insulative response to cold (these different responses were indicated by rectal temperature decreasing significantly less in SC than in the FC group; skin temperature decreasing and metabolic heat production increasing significantly in both groups similarly) [Citation23,Citation24].
The main aim of this study was to determine whether the FC and SC groups would display different responses to heat stress of motor, cognitive, and immune functions, and indicators of hypothalamic–pituitary–adrenal and autonomic nervous functions. Here we reasoned that the reduced ability to perceive cold stress might be related to a deficiency in the response to heat stress. Heat stress contrasts with cold stress because heat stress does not require the body to produce heat through shivering and non-shivering mechanisms to maintain core temperature (body insulation mechanisms). Instead, during heat stress, the excess heat must be removed effectively and heat production reduced. If the resistance mechanisms to cold and heat are antagonistic [Citation25], then one might expect that the SC group would perceive greater physiological stress, as indicated by the physiological stress index (PSI), than the FC group and that heat stress would have greater effects on stress indicators, such as cortisol, epinephrine, and norepinephrine levels, and immunity in the SC group. We also expected that greater induced heat stress would have greater effects in the SC group than in the FC group on motor (skeletal muscle, spinal reflexes, supraspinal reflexes, and voluntary contraction force) and cognitive performance. Alternatively, we hypothesised that resistance to cold and resistance to heat are controlled by different and independent mechanisms which do not suppress one another. If so, we would expect to find no difference in the response to hyperthermia between the FC and SC groups.
Methods
Participants
Forty healthy young men were recruited from a larger ongoing association study based on their tolerance to cold exposure. From the earlier study we selected an FC group whose Tre decreased to the set point of 35.5 °C before the end of the 170-min cooling time, and an SC group whose Tre did not decrease to the set point of 35.5 °C before the end of the 170-min cooling time. The two groups comprised 20 participants each. This was intended to provide the largest power to detect differences between the cold tolerance groups. The two groups did not differ in physical characteristics (). The participants were moderately physically active (<2 h/week) but did not participate in any formal physical exercise or sport programme. They had not been involved in any temperature manipulation programme or extreme temperature exposure for at least 3 months. Participants with any existing medical condition or taking medication that could affect natural thermoregulation were excluded from the study. Participants were also asked to refrain from taking any medication during the study. Each participant volunteered to participate after being informed of the purpose, experimental procedures and known risks of the study. Each participant read and signed a written informed consent form consistent with the principles outlined in the Declaration of Helsinki. The Kaunas Regional Research Ethics Committee approved this study (No.BE-2-41).
The study comprised a control trial and an experimental trial, which were performed in random order, at least 1 week apart. To attain a stable level of performance, at least 4 days before the control or experimental trial participants attended a familiarisation session during which they were introduced to the experimental procedures for cognitive and neuromuscular testing. During this session, each participant performed all three cognitive tests and learned to achieve and maintain maximal-effort ankle plantar flexion for 3–4 s with a 250-ms stimulation train test at 100 Hz (TT-100 Hz) superimposed on a voluntary contraction, and the tolerance to electrical stimulation was assessed. To control for circadian fluctuations in blood stress hormone levels and body temperature, all experiments began at 7.30 a.m. The participants refrained from consuming any food for at least 12 h before the experiment. To standardise the state of hydration and the feeling of thirst, participants were allowed to drink still water as desired until 60 min before the experiment. The experiments were performed at 22 °C (room temperature) and 60% relative humidity.
Control trial
On arrival at the laboratory, the participant was asked to rest in a semi-recumbent posture for 10 min dressed in a T-shirt, swimming shorts, and socks. Resting pulmonary gas exchange was recorded for the next 20 min in the same semi-recumbent posture. Skin (Tsk), muscle (Tmu), and rectal (Tre) temperature stabilisation was assessed, and control Tsk, Tmu, and Tre were measured. A blood sample was then drawn from a vein and stored for later analysis. The participant was seated at a table, and cognitive testing was performed. Upon completion of the cognitive tests, the participant was positioned in the dynamometer chair, stimulating electrodes were placed over the tibial nerve, electromyography electrodes were placed over the soleus (SOL) muscle of the right leg, and the reflexes were assessed. After a 5-min rest, during which the electrodes were moved from over the tibial nerve to over the posterior calf muscle, the force-generating capacity of the posterior calf muscle was assessed by applying 1-s trains of electrical stimuli at 1, 20, TT-100 Hz, and 100 Hz. About 3 s was needed to change the stimulation frequency. After a 1-min rest, two attempts at a 3–4-s maximal voluntary contraction (MVC) separated by a 1-min rest interval were performed with a TT-100 Hz stimulus superimposed on the voluntary contraction. A 2-min rest period then followed, and a final 1-min sustained MVC effort (1-min MVC) was then tested. The TT-100 Hz was superimposed on the contraction at about 3 s and 59 s.
The TT-100 Hz contractions were used to assess the central activation ratio (CAR) of the posterior calf muscle. The CAR (in percent) was calculated as the ratio of the maximal voluntary force to the peak force generated with the additional TT-100 Hz superimposed on an MVC.
Experimental trial
The initial part of the experimental trial was identical to the control trial. After measurement of body temperature and pulmonary gas exchange, sampling of blood, and cognitive and muscle testing, the participant began the water immersion heating protocol. The water bath temperature was 43–44 °C and the participant was immersed to the waistline. The procedure continued until the Tre increased to 39.5 °C, and the exposure time until this Tre was achieved was recorded [Citation26]. Ratings of perception and Tre were recorded every 5 min throughout the heating procedure. Pulmonary gas exchange was recorded during water immersion. Within ∼1 min after leaving the bath, the volunteer was towel-dried, Tsk and Tmu were measured, and a blood sample was taken. The participant was clothed in a long-sleeved sweater, trousers, socks, and a warm cap (balaclava). The cognitive and neuromuscular testing was then performed in the same order as before the warm water immersion. The experiment was then terminated by a 1-min MVC with the application of TT-100 Hz as in the control trial.
Preliminary measurements
The anthropometric characteristics of the participants are presented in . The participant’s weight (kg), body fat (%) (TBF-300 body composition analyser, Tanita, West Drayton, UK) and height (in cm) were measured, and body mass index (BMI) was calculated. Body surface area (in m2) was estimated as 128.1 × weight0.44 × height0.60 [Citation27]. Skinfold thickness (in mm) was measured (SH5020 skinfold calliper, Saehan, Masan, Korea) at 10 sites (chin, subscapular, chest, side, suprailium, abdomen, triceps, thigh, knee and calf [Citation28] and the mean subcutaneous fat thickness was calculated [Citation29].
Body temperature measurements
Tre was measured throughout the experimental trial using a thermocouple (Rectal Probe, Ellab, Hvidovre, Denmark; accuracy ± 0.01 °C) inserted to a depth of 12 cm past the anal sphincter. The rectal thermistor sensor was placed by each participant. Tmu and Tsk were measured before and at the end of the water immersion. The Tmu was measured with a needle microprobe (MKA, Ellab, Hilleroed, Denmark) inserted ∼3 cm under the skin covering the lateral gastrocnemius muscle of the right leg. The skin was prepared before each intramuscular temperature measurement by shaving and disinfecting before and after insertion with a cotton-wool tampon soaked with medicinal alcohol. After the first measurement, the insertion area was marked with a 0.5-cm diameter circle. This was done to ensure repeatability and to allow use of the same insertion point for each measurement (i.e. control versus experimental trial; before and after passive heating). Tsk was measured with thermistors taped at three sites: back, thigh and forearm (DM852, Ellab; accuracy ± 0.01 °C), and mean Tsk was calculated by the Burton [Citation30] equation as: Tsk = 0.5back + 0.36thigh + 0.14forearm.
Physiological stress index
The method to measure PSI has been described elsewhere [Citation31]. Thus the following normalised PSI is suggested:
The measurements for PSI were taken before (Tre0 and HR0) and at the end of passive heating (Tret and HRt). Tre and HR were assigned with the same weight by using a constant of 5. Thus, the index was scaled to a range of 0–10: 1–2 (no/little heat stress); 3–4 (low heat stress); 5–6 (moderate heat stress); 7–8 (high heat stress); and 9–10 (very high heat stress), within the limits of the following values: 36.5 ≤ Tre ≤ 39.5 °C and 60 ≤ HR ≤ 180 beatsċmin–1.
Measurement of perceptions and state of hydration
The method to measure subjective perception for the whole body has been described elsewhere [Citation11,Citation32]. Briefly, the rating of thermal sensation ranged from 1 (very cold) to 9 (very hot), with 5 being neutral. The sweating sensation ranged from 4 (not at all) being neutral to 7 (heavily sweating). The rating of perception was reported by the participants every 5 min during passive heating. A mean rating score was calculated for each session.
Regardless of lost sweat, the state of hydration was determined by taking nude body mass (in kg) of each participant before and 30 min after the passive heating (TBF-300, Tanita).
Isometric torque and electrical stimulation
The isometric torque of ankle plantar flexion muscles was measured using an isokinetic dynamometer (System 4, Biodex Medical Systems, Shirley, NY) calibrated according to the manufacturer’s service manual with a correction for gravity performed using the Biodex Advantage program (version 4.X). Participants were seated in the dynamometer chair with the trunk inclined at 45° with respect to the vertical, and with hip, knee and ankle joint angulations of 90°, 100° (full knee extension = 180°) and 90°, respectively. For MVC measurement, the participant was instructed to achieve and maintain maximal effort of ankle plantar flexion for 3–4 s. Each trace was inspected visually to ensure that there were no artefact spikes at the start of the signal curve. The arms were crossed on the chest with the hands grasping the trunk-supporting belt during all tests on the dynamometer. To help ensure a maximal effort, standard vocal encouragement was provided during each voluntary ankle plantar flexion trial by the same experienced investigator. The participant was asked to perform two attempts with a rest interval of 1 min. The best attempt was recorded.
The equipment and procedure for electrically stimulated torque have been described previously [Citation23,Citation33]. Briefly, muscle stimulation was applied using flexible surface electrodes (MARP Electronic, Krakow, Poland), covered with a thin layer of electrode gel (ECG–EEG Gel; Medigel, Modi’in, Israel), with one electrode (8 × 12 cm) placed transversely across the width of the proximal portion of the posterior calf just below the popliteal fossa, and the other electrode (8 × 8 cm) covered the distal portion of the muscle just below the muscle fibres of the gastrocnemius. A constant current electrical stimulator (MG 440; Medicor, Budapest, Hungary) was used to deliver 0.5-ms square-wave pulses at 150 V. Peak torques induced by a 1-s electrical stimulation at 1 Hz (P1; representing the properties of muscle excitation–contraction coupling), at 20 Hz (P20; representing the steep section of the force–frequency relationship curve) and at 100 Hz (P100; which is close to maximal force) were measured with a 3-s rest interval between electrical stimulations. The half-relaxation time (in ms) was measured in resting TT-100 Hz contractions. The half-relaxation time (HRT) was calculated as the time taken for torque to decline from the peak value to half of that value at the end of the TT-100 Hz contraction. A rest interval of 1 min was set between the electrical stimulation trial and MVC measurements.
Reflex recordings
The participant positioning, testing environment and electrical stimulator assessment were essentially the same as those described above. After careful preparation of the skin (shaving, abrading, and cleaning with alcohol wipes) to obtain low impedance, bipolar Ag–AgCl surface bar electrode (10 mm diameter, 20 mm centre-to-centre distance) (DataLOG type no. P3X8 USB, Biometrics, Newport, UK) were used for electromyography (EMG) recording. For the SOL, the electrode was placed over the SOL ∼13 cm above the calcaneus below the muscle fibres of the gastrocnemius. The actual electrode position was marked, and the same recording site was used in the pre- and post-session measurements. The ground electrode was positioned on the tarsus of the same leg. EMG signals were recorded by amplifiers (gain 1000), with signal measurements using a third-order filter (18 dB/octave) bandwidth of 20–460 Hz. The analogue signal was sampled and converted to digital form at a sampling frequency of 5 kHz. The EMG signal was telemetered to a receiver that contained a differential amplifier with an input impedance of 10 MΩ, the input noise level was less than 5 µV, and the common mode rejection ratio was higher than 96 dB. Before recording the EMG, we set the channel sensitivity at 3 V and excitation output at 4600 mV as recommended by the manufacturer. EMG files were stored simultaneously on the biometrics memory card and PC hardware, and dedicated software (Biometrics DataLOG) was used for data processing and analysis.
SOL H-reflexes, V-waves and M-waves () were evoked by 0.5-ms square-wave pulses stimulated by a cathode placed in the popliteal cavity and an anode distal to the patella over the posterior tibial nerve with an inter-electrode distance of ∼4 cm. The resting maximal H-reflex (Hmax; reflects the efficiency of the transmission in Ia afferent-α motor neuron synapses) and maximal M-wave (Mmax, reflects sarcolemmal excitability) were obtained by increasing the electrical intensity by 3 V every 10 s in the 30–150 V range. With increasing stimulation intensity, the H-reflex response initially increased progressively before decreasing and then disappearing, whereas the M-wave achieved its maximum and remained stable. Thereafter, the participant was instructed to perform three brief MVCs of the plantar flexor muscles with at least a 1-min rest between contractions. A superimposed stimulus (at Mmax intensity) was evoked to obtain the V-wave (Vsup). The peak-to-peak amplitude of the V-wave reflects the magnitude of the central descending neural drive to spinal motor neurons, although spinal factors such as motor neuron excitability and pre- or post-synaptic inhibition may also be involved [Citation34]. M-wave amplitude was also used to normalise the amplitude of the reflex waves recorded (i.e. Hmax/Mmax ratio). This was done to ensure that any changes in the evoked Hmax and Vsup amplitudes reflected changes at the muscle fibre membrane or neuromuscular junction. The latencies of the electrically evoked action potentials were calculated from the stimulation artefact at the peak of the wave.
Figure 1. An example of reflexes at rest and during maximal voluntary contraction (MVC) before and after passive body heating (original data obtained from one participant).
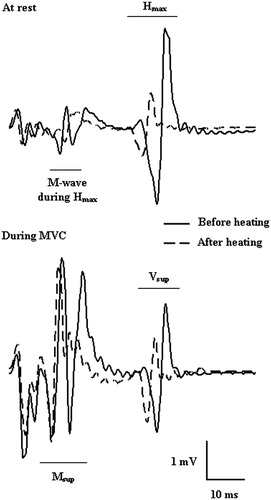
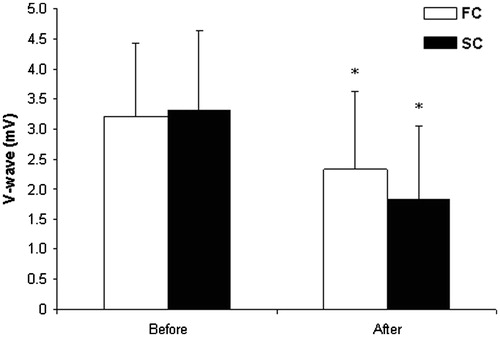
Figure 2. Changes in V-wave response before and after passive body heating. *p < 0.05, compared with before; FC, fast cooling group; SC, slow cooling group. Values are means ± SD.
Spirometry
A mobile spirometry system (Oxycon Mobile, Jaeger/VIASYS Healthcare, Hoechberg, Germany) was used to measure pulmonary gas exchange at rest and during water immersion. This system uses a tightly fitting face mask that covers the nose and mouth with a lightweight integrated flow meter (Triple V volume sensor; 45 g) with a dead space of 30 mL. The system monitors ventilatory parameters, oxygen uptake and VCO2 production on a breath-by-breath basis. The processing, recording and battery system comprises two units attached to a belt, which was hung as close as possible to the participant’s nose and mouth during immersion. The data were stored on memory cards and PC hardware. This instrument was calibrated before recording as indicated in the manufacturer’s manual by using the automatic volume and gas calibration functions. A flow volume sensor calibration procedure assures that the Oxycon quantification system (including the amplifier, Triple V sensors and pressure transducer) is functioning correctly. The gas analyser and delay time calibrations were also automatic, as provided by the manufacturer: a calibration gas at 180 kPa (15.2% O2, 5.02% CO2 and 79.78% N2) was introduced to the Oxycon to attain gain, offset and delay times within 1%. Oxygen consumption was recorded in 5-s increments. Because the total water-immersion time differed between participants, the mean values for VO2 (in mL/min/kg and L/min) and VCO2 (L/min) were calculated.
Metabolic rate (MR) was calculated in W from the respiratory gas exchange measurements of VO2 (L/min) and the respiratory exchange ratio (RER = VCO2/VO2) according to Peronnet and Massicotte [Citation35] as follows: MR = (281.65 + 80.65 × RER) × VO2.
Cognitive performance
A programmed cognitive test battery was used to assess short-term memory and attention [Citation23,Citation33]. All tasks were computer controlled, and the information was presented on the screen of a laptop (HP Compaq 6730b). In a pilot study, participants (n = 53) completed the cognitive test battery on four separate occasions, and the performance on the three tests was compared using the intra-class test of reliability by analysis of variance (ANOVA) [Citation36]. The reliability was considered acceptable because the intra-class correlations were R ≥ 0.80 for all tests and there were no significant differences in performance. The coefficient of variation for repeated tests was <5%. All tests were performed in a quiet and semi-darkened laboratory with a laptop screen ∼40 cm in front of the participant. The test battery took ∼10 min to perform and included the following tasks.
Unpredictable task switching: The odd/even test [Citation37] measures choice reaction time (in ms) to an unpredictable digit-choice protocol. This test reflects cognitive flexibility, which is defined as the ability to adjust to changing demands [Citation38]. Forty randomised single-digit stimuli from 0 to 9 of 180 s duration were displayed with varying inter-stimulus intervals in the middle of the screen. As fast as possible, the participant had to press the button for the even (right button) or odd (left button) digit corresponding to the digit presented.
The forward digit-span task [Citation38–39] tests the ability to remember a sequence of digits in a short time. This test assesses short-term memory [Citation38], which can hold a limited amount of information in a very accessible state temporarily. The participant was instructed to remember a seven-digit sequence displayed for 3 s in the middle of the screen. The participant then immediately entered the digits using a numeric keyboard in the same consecutive sequence as presented. If the digits were identified correctly, for the next attempt, the sequence was one digit longer; if an error was made, the next sequence was one digit shorter. There were 16 sequences. The mean number of digits identified successfully was recorded.
The forced-choice recognition memory test [Citation40] assesses visual recognition memory. After looking at nine visual figures displayed for 15 s in the middle of the screen, the participant was required to recognise the nine items from 28 figures presented in the study list in any order. The number of correctly identified images was recorded.
Blood variables
Blood samples were collected by venipuncture into vacuum tubes (EDTA-K3, 3 mL) before (in the control and experimental trials) and after passive heating, mixed gently by inverting 8–10 times, and kept at room temperature until analysed for differential blood cell counting of neutrophils, lymphocytes, and monocytes. Blood samples were analysed 1–2 h after blood collection using an automated haematology analyser, XE-5000 (Sysmex, Kobe, Japan).
Blood samples for measurement of epinephrine and norepinephrine concentrations were collected in vacuum tubes using EDTA as an anticoagulant (EDTA-K3, 3 mL), mixed gently by inverting 8–10 times and kept at 2–8 °C until centrifugation. Blood samples were centrifuged at 1200 × g for 15 min within 30 min of blood collection. Plasma samples were separated as soon as possible (maximum 10–15 min) from the red cells after centrifugation, and kept at −70 °C until analysis. Epinephrine and norepinephrine concentrations were measured using an ELISA kit (Gemini analyser, Stratec Biomedical, Birkenfeld, Germany).
Blood samples for measurement of cortisol, corticosterone, IL-6 and TNF-α concentrations were collected by venepuncture into vacuum tubes for serum separation using a gel separator (5 mL). Blood samples were allowed to clot, and the serum was separated by centrifugation at 1200 × g for 15 min. The serum samples were aliquoted and stored at −70 °C until analysis. Concentrations of corticosterone, IL-6 and TNF-α were measured by ELISA (Gemini analyser, Stratec Biomedical), and cortisol concentration was measured using an automated enzyme immunoassay analyser, AIA-2000 (Tosoh, Tokyo, Japan).
Data analysis
The data were tested for normal distribution using the Kolmogorov–Smirnov test, and all scale data were normally distributed. Statistical analysis involved general linear model analysis of variance (ANOVA) for repeated measures with FC and SC as a between-group factor, and time as within-group factor of two levels (before and after heating) on dependent variables (body temperatures, pulmonary gas exchange, MR, reflexes, blood variables, and motor and cognitive performance). Physical characteristics of participants () and changes in PSI were analysed via one-way analysis of variance with FC versus SC as a between-group factor. For all ordinal data the non-parametric Wilcoxon signed-rank test was used to compare changes in subjective ratings of perceptions (thermal and sweating sensations). Descriptive data are presented as mean and standard deviation (SD). Observed power (OP) was calculated for all mechanical indicators based on an alpha level of 0.05, sample size (n = 20), standard deviation and average level of variables. The level of significance was set at p < 0.05 and all statistical analyses were performed using IBM SPSS Statistics 22 (Armonk, NY).
Results
Body surface area, mean subcutaneous fat, and BMI did not differ significantly between the FC and SC groups (). The initial body temperature, pulmonary gas exchange, blood variables, and cognitive and muscle testing results did not differ significantly between the control and experimental trials.
Changes in rectal, muscle, and skin temperatures during heat stress
In the FC group, the time to warm the body from a Tre of 37.1 ± 0.2 °C before warming to 39.5 °C was 63.7 ± 22.4 min. In the SC group, the time to warm the body from a Tre of 37.1 ± 0.3 °C before warming to 39.5 °C was 67.2 ± 13.8 min (p > 0.05 between groups). In the FC group, Tmu increased during warming by 3.5 ± 0.7 °C from 36.8 ± 0.5 °C (p < 0.001; OP > 99%). In the SC group, Tmu increased during warming by 3.8 ± 0.7 °C from 36.4 ± 0.6 °C (p < 0.001; OP > 99%; p > 0.05 between groups). In the FC group, Tsk increased during warming by 4.4 ± 1.2 °C from 31.9 ± 0.7 °C (p < 0.001; OP > 99%). In the SC group, Tsk increased during warming by 4.1 ± 1.3 °C from 32.2 ± 1.1 °C (p < 0.001; OP > 99%; p > 0.05 between groups).
VO2 and MR
MR and VO2 increased significantly after body warming in both groups (p < 0.001; OP > 99%) (). However, there were no significant differences in the changes in VO2 and MR after body warming between the FC and SC groups.
Table 2. VO2 and metabolic rate (MR)*.
PSI and subjective indicators of heat stress
The PSI after warming was 8.0 ± 0.6 and 8.2 ± 1.0 in the FC and SC groups, respectively (p > 0.05 between groups). During warming, the changes in subjective indicators of heat stress did not differ significantly between the FC (7.4 ± 0.5) and SC (7.1 ± 1.1) groups. The thermal comfort sensation did not differ significantly between the FC (2.25 ± 0.59) and SC (2.16 ± 0.58) groups (p > 0.05 between groups). The sweating sensation did not differ significantly between the FC (5.97 ± 0.39) and SC (5.85 ± 0.53) groups (p > 0.05 between groups).
State of hydration during hyperthermia
Body weight decreased after warm water immersion: 1.4 ± 0.5 kg and 1.4 ± 0.3 kg in the FC and SC groups, respectively (p > 0.05 between groups).
Skeletal muscle force-generating capacity
There were no significant differences between the FC and SC groups in the values for torque in electrically induced contractions, MVC, CAR, and HRT before and after heat stress (). Warming had no significant effect on any measure of skeletal muscle force variables in either group.
Table 3. Voluntary and electrically induced skeletal muscle properties before and after passive body heating.
Effects of body warming on spinal and supraspinal reflex excitability
Body warming changed most excitability variables significantly (p < 0.05; OP > 80%) in both groups, but there were no significant differences in these responses between groups () ().
Table 4. Spinal reflex excitability before and after passive body heating.
Effects of warming on central and peripheral muscle fatigue during 1-min MVC
MVC and CAR decreased significantly (p < 0.001; OP > 99%) during the 1-min MVC before and after body warming. However, there were significant changes in CAR after body warming compared with that before warming () in both groups. The change in CAR did not differ between the FC and SC groups. There was a significant relationship between the change in CAR after 1-min MVC during heat exposure and the changes in the H-wave and M-wave after heating (r = 0.52 and r = 0.49 in the FC and SC groups, respectively). By contrast, there was no significant relationship between the change in CAR after 1-min MVC during heat exposure and change in the V-wave after heating.
Table 5. The changes in maximal voluntary contraction (MVC) and central activation ratio (CAR) during 1-min MVC.
Effect of body heating on cognitive performance
Body warming had no significant effect on any aspect of cognitive performance in either group (p > 0.05) ().
Table 6. Cognitive performance before and after passive body heating.
Blood variables before and after body heating
The concentrations of cortisol, corticosterone, epinephrine, and norepinephrine changed significantly after body warming in both groups (p < 0.05; OP > 80%) but did not differ significantly between groups. The numbers of neutrophils, lymphocytes, and monocytes, and concentrations of IL-6 and TNF-α did not change significantly after body warming in both groups ().
Table 7. The blood variables before and after passive body heating.
Discussion
As expected, both groups perceived the hyperthermia, but, contrary to our expectations, the subjective indicators of thermal, comfort, and sweating sensation, PSI, dehydration, and time for the body to warm to 39.5 °C did not differ between groups. The effects of heat stress on motor and cognitive performance and stress markers (cortisol, corticosterone, epinephrine, and norepinephrine concentrations) did not differ between the FC and SC groups. The heat stress did not cause significant changes in markers of innate and specific immunity in either group. Thus, our first hypothesis – that those who are more resistant to cold are not less resistant to heat – was not supported. Alternatively, we hypothesised that resistance to cold and resistance to heat are controlled by different and independent mechanisms, which do not suppress one another. The principal thermoregulatory effectors are the cutaneous blood vessels, which control heat loss, and brown adipose tissue and skeletal muscle, which exhibit thermogenesis [Citation41]. The activation of these effectors is regulated by parallel but distinct effector-specific core efferent pathways within the central nervous system; these effectors are strongly influenced by shared cutaneous thermal afferent signals [Citation41]. To our knowledge, this is the first study to compare the physiological, immunological, and psychological responses to acute heat stress in people with different physiological responses to cold exposure (insulative–hypothermic versus metabolic–insulative).
Despite the higher cold strain index in the FC group, the PSI and neuroendocrine response to heat stress did not differ between groups
The objective and subjective indicators of heat stress did not differ between the FC and SC groups. Neuroendocrine markers changed significantly after passive body heating but did not differ between the FC and SC groups. Tre, Tmu, and Tsk also did not differ between the FC and SC groups before and after exposure to heat. MR and VO2 increased significantly after body heating in both groups. Body Tre increased to 39.5 °C in both groups. During warm water exposure, the body attempts to maintain a normal body temperature by increasing heat loss. This study was designed to examine the acute effects of brief heat exposure in young men who exhibited fast or slow cooling responses to 14 °C cold water immersion. Our heat exposure protocol does not represent the typical conditions that humans encounter during daily activities that might provoke a natural stress response.
The response of the FC group to cooling versus the SC group response was more likely an insulative–hypothermic response, because the Tre decreased more in relation to changes in the Tsk and MR compared with the SC group (Tsk decreased and MR increased significantly in both groups, but there was no significant difference between the groups). The SC versus the FC group displayed a metabolic–insulative response, because the Tre decreased significantly less in relation to changes in Tsk and MR than it did in the FC group [Citation23,Citation24].
Contrary to our expectation, stress markers in the blood (cortisol, epinephrine, norepinephrine, and corticosterone concentrations) did not differ between the SC and FC groups (), although all of these markers increased significantly during heat stress. We found no differences between the FC and SC groups in sympathetic–adrenomedullary and hypothalamic–pituitary–adrenocortical activation after passive body heating. This suggests that participants in both groups experienced similar neuroendocrine stress because these systems are activated in stress conditions [Citation42].
Immune markers did not change significantly during heat stress in either group
Commonly used stress biomarkers are cortisol, catecholamines, and proinflammatory cytokines. Acute stress enhances and chronic stress suppresses immune function [Citation21,Citation43,Citation44]. Stress experiments suggest that the plasma concentration of epinephrine is inversely related to specific immune functions of lymphocytes and monocytes, and that catecholamines are immunosuppressive [Citation45]. In our study the heating time extended for about 1 h and was applied only once, although there is no doubt that this induced acute stress in the participants. Immersion for about 2 h in 39.5–45 °C water increases the core temperature to about 39.5 °C and increases numbers of circulating leucocytes, neutrophils, lymphocytes, natural killer cells, and eosinophils, but either does not change or decreases the monocyte number [Citation17–18]. However, in our study, even though Tre increased to 39.5 °C with warm water immersion, there were no significant changes in the numbers of circulating neutrophils, lymphocytes, and monocytes, or IL-6 and TNF-α concentrations in either group (). Stress-induced changes in plasma corticosterone are accompanied by significant decreases in the number and percentage of lymphocytes and by increases in the number and percentage of neutrophils [Citation43]. In our earlier studies [Citation23,Citation46], the neutrophil percentage increased and the lymphocyte percentage decreased and the corticosterone level decreased after head-out immersion cooling. However, although the corticosterone level increased in our current study, we did not find any significant changes in these blood markers of immunity. We had expected that heat stress would stimulate innate (natural) immunity. In our earlier studies we found that cold stress stimulated innate immunity but suppressed specific immunity [Citation23]. Recent evidence indicates that glucocorticoids and catecholamines, the major stress hormones, inhibit production of proinflammatory cytokines, such as IL-6 and TNF-α [Citation47]. It is possible that the increased catecholamine concentration inhibited production of IL-6 and TNF-α in our current study ().
Motor and cognitive performance did not differ in hyperthermia between the FC and SC groups
There was no significant difference in motor and cognitive performance after passive body heating between the FC and SC groups. Heat stress did not change voluntary and electrically induced contractions at different stimulation frequencies, muscle force, CAR in the exercising muscle, muscle relaxation properties (), or cognitive function () in either group. However, we observed decreases in spinal and supraspinal reflex excitability () and increased central fatigue during the 1-min MVC () after warm water immersion. Increased central fatigue during the 1-min MVC after heat stress is consistent with previous observations [Citation3,Citation4,Citation11].
In this study, heat stress did not impair cognitive function, which conflicts with previous findings [Citation6,Citation8–10,Citation48]. Stress affects cognitive performance differently, depending on the type of cognitive task [Citation6]. It is possible that cognitive function did not decrease after passive body heating in both groups because our cognitive task was rather simple.
Our data are consistent with other research data showing that decrements in the H-reflex during hyperthermia are confirmed by a decrease in V-waves [Citation1]. Interestingly, the increase in central fatigue during the 1-min MVC after passive body heating was associated with decreased Hmax/Mmax in both groups. It is possible that these decrements in evoked reflex waves are linked to both the inhibition/control loop acting pre-synaptically and to alterations in the excitability of the post-synaptic element, i.e., the motor neuron [Citation1]. However, we did not find any difference between the FC and SC groups. Hmax is an indirect estimate of the number of motor neurons recruited, and Mmax represents the entire motor neuron pool; thus, the Hmax/Mmax ratio can be interpreted as the proportion of the entire motor neuron pool capable of being recruited. The V-wave size indicates increased motor neuron discharge rate or recruitment [Citation34]. However, according to Aagaard et al. [Citation34], it is important to consider that the motoneuron discharge rate reflects both supraspinal input to the motoneuron and the response to all inputs.
It has been suggested recently that stress can also modulate movement through activation of the hypothalamic–pituitary–adrenal axis and via stress-associated emotional changes [Citation49]. It was concluded recently that body core temperature can affect neuromuscular performance and that the effects of Tsk and maximal cardiovascular strain on motor performance are clear [Citation50].
There is a clear effect of temperature on motor [Citation51] and cognitive function [Citation9,Citation10,Citation52], which appears to follow an inverted U relationship. Stressful events can lead to immediate and marked impairment in working memory, which is an executive function [Citation53]. Appropriate responsiveness of the central nervous system to stressors is a crucial prerequisite for a sense of well-being and adequate performance of tasks [Citation54]. However, we found no significant differences between groups in motor and cognitive function during heat stress. We acknowledge that the lack of significant changes may reflect a too short exposure to heat stress or task specificity. It seems likely that the heat stress used in this study was not sufficient to reach the threshold at which motor and cognitive functions start to decrease.
Thus, it is novel despite the SC group originally having a physiological advantage in prolonged exposure to an acute cold environment compared with the FC group; however, no physiological advantage has been found between groups in prolonged exposure to acute heat exposure. These findings indicate that young healthy men have similar chances of risk of getting heat exhaustion, heat stroke, and to be overheated in hot environment, despite their differences between group (SC versus FC) reaction to cold stress. This knowledge is of critical importance for the survival, health and well-being of humans who are exposed to occupational and/or recreational extreme temperature conditions; moreover, this work is important for clinicians dealing with whole-body hyperthermia control in cancer treatment [Citation55], and treatment for HIV infections as well as AIDS [Citation56], and physiologically based therapy (physiological hyperthermia), which treats aches and pains [Citation57,Citation58]. The anatomical differences between men and women [Citation59–61], and weakened thermoregulatory system response to extreme temperature conditions evident with ageing [Citation62] might suggest that the limitation of the present study is that its results cannot probably be transferred to female or older populations. Therefore, further research is warranted, especially with respect to the ageing and gender-dependent difference response in FC and SC groups to whole-body hyperthermia and its effect on cognition and motor fatigue, and changes in kinetics of glucocorticoids, pro- and anti-inflammation cytokines.
Conclusion
Despite the greater cold strain index after acute cold exposure in participants in the FC group than in the SC group, the changes in stress markers (increases in cortisol, epinephrine, norepinephrine, and corticosterone concentrations) after passive body heating to a Tre of 39.5 °C did not differ between the FC and SC groups. Heat stress did not change markers of innate and specific immunity in the FC or the SC group. An interesting finding was that heat stress did not affect motor and cognitive function in either group, although central fatigue during 1-min MVC increased after heat stress in both groups.
Acknowledgements
The authors thank Danute Juciene for blood sample collection.
Declaration of interest
The authors report no conflicts of interest. The authors alone are responsible for the content and writing of the paper.
Related Research Data
References
- Racinais S, Gaoua N, Grantham J. Hyperthermia impairs short-term memory and peripheral motor drive transmission. J Physiol 2008;586:4751–62
- Racinais S, Oksa J. Temperature and neuromuscular function. Scand J Med Sci Sports 2010;20(Suppl.3):1–18
- Nybo LJ. Hyperthermia and fatigue. Appl Physiol 2008;104:871–8
- Brazaitis M, Skurvydas A, Pukenas K, Daniuseviciute L, Mickeviciene D, Solianik R. The effect of temperature on amount and structure of motor variability during 2-minute maximum voluntary contraction. Muscle Nerve 2012;46:799–809
- Shansky RM, Lipps J. Stress-induced cognitive dysfunction: Hormone–neurotransmitter interactions in the prefrontal cortex. Front Hum Neurosci 2013;7:123
- Hancock PA, Vasmatzidis I. Effects of heat stress on cognitive performance: The current state of knowledge. Int J Hyperthermia 2003;19:355–72
- Lieberman HR, Castellani JW, Young AJ. Cognitive function and mood during acute cold stress after extended military training and recovery. Aviat Space Environ Med 2009;80:629–36
- Gaoua N, Grantham J, El Massioui F, Girard O, Racinais S. Cognitive decrements do not follow neuromuscular alterations during passive heat exposure. Int J Hyperthermia 2011;27:10–9
- Jiang Q, Yang X, Liu K, Li B, Li L, Li M, et al. Hyperthermia impaired human visual short-term memory: An fMRI study. Int J Hyperthermia 2013;29:219–24
- Lenzuni P, Capone P, Freda D, Del Gaudio M. Is driving in a hot vehicle safe? Int J Hyperthermia 2014;30:250–7
- Brazaitis M, Skurvydas A. Heat acclimation does not reduce the impact of hyperthermia on central fatigue. Eur J Appl Physiol 2010;109:771–8
- Brenner I, Shek PN, Zamecnik J, Shephard RJ. Stress hormones and the immunological responses to heat and exercise. Int J Sports Med 1998;19:130–43
- Radomski MW, Cross M, Buguet A. Exercise-induced hyperthermia and hormonal responses to exercise. Can J Physiol Pharmacol 1998;76:547–52
- Jimenez C, Melin B, Savourey G, Launay JC, Alonso A, Mathieu J. Effects of passive hyperthermia versus exercise-induced hyperthermia on immune responses: Hormonal implications. Eur Cytokine Netw 2007;18:154–61
- Meeusen R, Roelands B. Central fatigue and neurotransmitters, can thermoregulation be manipulated? Scand J Med Sci Sports 2010;20(Suppl.3):S19–28
- Walsh NP, Whitham M. Exercising in environmental extremes: A greater threat to immune function? Sports Med 2006;36:941–76
- Downing JF, Martinez-Valdez H, Elizondo RS, Walker EB, Taylor MW. Hyperthermia in humans enhances interferon-gamma synthesis and alters the peripheral lymphocyte population. J Interferon Res 1988;8:143–50
- Katschinski DM, Wiedemann GJ, Longo W, d’Oleire FR, Spriggs D, Robins HI. Whole body hyperthermia cytokine induction: A review, and unifying hypothesis for myeloprotection in the setting of cytotoxic therapy. Cytokine Growth Factor Rev 1999;10:93–7
- Wright HE, McLellan TM, Friesen BJ, Casa DJ, Kenny GP. Influence of circulating cytokines on prolactin during slow vs fast exertional heat stress followed by active or passive recovery. J Appl Physiol 2012;113:574–83
- Webster JI, Tonelli L, Sternberg EM. Neuroendocrine regulation of immunity. Annu Rev Immunol 2002;20:125–63
- Wright HE, McLellan TM, Stapleton JM, Hardcastle SG, Kenny GP. Cortisol and interleukin-6 responses during intermittent exercise in two different hot environments with equivalent WBGT. J Occup Environ Hyg 2012;9:269–79
- Tikuisis P, Meunier P, Jubenville CE. Human body surface area: Measurement and prediction using three-dimensional body scans. Eur J Appl Physiol 2001;85:264–71
- Brazaitis M, Eimantas N, Daniuseviciute L, Mickeviciene D, Steponaviciute R, Skurvydas A. Two strategies for response to 14 °C cold-water immersion: Is there a difference in the response of motor, cognitive, immune and stress markers? PLoS One 2014;9:e109020
- Makinen TM. Different types of cold adaptation in humans. Front Biosci (Schol Ed) 2010;2:1047–67
- Nakamura K. Central circuitries for body temperature regulation and fever. Am J Physiol Regul Integr Comp Physiol 2011;301:R1207–28
- Pranskunas A, Pranskuniene Z, Milieskaite E, Daniuseviciute L, Kudreviciene A, Vitkauskiene A, et al. Effects of whole body heat stress on sublingual microcirculation in healthy humans. Eur J Appl Physiol 2015;115:157–65
- van Marken Lichtenbelt WD, Vanhommerig JW, Smulders NM, Drossaerts JM, Kemerink GJ, Bouvy ND, et al. Cold-activated brown adipose tissue in healthy men. N Engl J Med 2009;360:1500–8
- McArdle WD, Magel JR, Gergley TJ, Spina RJ, Toner MM. Thermal adjustment to cold-water exposure in resting men and women. J Appl Physiol Respir Environ Exerc Physiol 1984;56:1565–71
- Allen TH, Peng MT, Chen KP, Huang TF, Chang C, Fang HS. Prediction of total adiposity from skinfolds and the curvilinear relationship between external and internal adiposity. Metabolism 1956;5:346–52
- Burton AC. Human calorimetry: The average temperature of the tissues of the body. J Nutr 1935;9:261–80
- Moran DS, Castellani JW, O’Brien C, Young AJ, Pandolf KB. Evaluating physiological strain during cold exposure using a new cold strain index. Am J Physiol 1999;277:R556–64
- Ha M, Tokura H, Tanaka Y, Holmer I. Effects of two kinds of underwear on thermophysiological responses and clothing microclimate during 30 min walking and 60 min recovery in the cold. Appl Human Sci 1996;15:33–9
- Solianik R, Skurvydas A, Mickevičienė D, Brazaitis M. Intermittent whole-body cold immersion induces similar thermal stress but different motor and cognitive responses between males and females. Cryobiology 2014;69:323–32
- Aagaard P, Simonsen EB, Andersen JL, Magnusson P, Dyhre-Poulsen P. Neural adaptation to resistance training: Changes in evoked V-wave and H-reflex responses. J Appl Physiol 2002;92:2309–18
- Peronnet F, Massicotte D. Table of nonprotein respiratory quotient: An update. Can J Sport Sci 1991;16:23–9
- Baumgartner TA. Norm-referenced measurement: Reliability. In: Safrit MJ, Woods TM, eds. Measurements Concepts in Physical Education and Exercise Sciences. Champaign, IL: Human Kinetics, 1989, pp. 45–72
- Morsella E, Bargh JA, Gollwitzer PM. Oxford Handbook of Human Action. New York: Oxford University Press, 2009
- Diamond A. Executive functions. Annu Rev Psychol 2013;64:135–68
- Miller GA. The magical number seven, plus or minus two: Some limits on our capacity for processing information. Psychol Rev 1956;63:81–97
- Roediger HL, Karpicke JD. (2005). Learning and memory. In K. Kempf-Leonard (Ed.), Encyclopedia of social measurement, Vol. 2, pp. 479–486. Amsterdam: Elsevier, 2005
- Morrison SF, Nakamura K. Central neural pathways for thermoregulation. Front Biosci (Landmark Ed) 2011;16:74–104
- Lupien SJ, McEwen BS, Gunnar MR, Heim C. Effects of stress throughout the lifespan on the brain, behaviour and cognition. Nat Rev Neurosci 2009;10:434–45
- Dhabhar FS, Miller AH, McEwen BS, Spencer RL. Effects of stress on immune cell distribution. Dynamics and hormonal mechanisms. J Immunol 1995;154:5511–27
- Leon LR, Helwig BG. Heat stroke: Role of the systemic inflammatory response. J Appl Physiol 2010;109:1980–8
- Reiche EMV, Nunes SOV, Morimoto HK. Stress, depression, the immune system, and cancer. Lancet Oncol 2004;5:617–25
- Brazaitis M, Eimantas N, Daniuseviciute L, Baranauskiene N, Skrodeniene E, Skurvydas A. Time course of physiological and psychological responses in humans during a 20-day severe-cold-acclimation programme. PLoS One 2014;9:e94698
- Elenkov IJ, Chrousos GP. Stress hormones, proinflammatory and antiinflammatory cytokines, and autoimmunity. Ann NY Acad Sci 2002;966:290–303
- Lieberman HR, Castellani JW, Young AJ. Cognitive function and mood during acute cold stress after extended military training and recovery. Aviat Space Environ Med 2009;80:629–36
- Metz GA. Stress as a modulator of motor system function and pathology. Rev Neurosci 2007;18:209–22
- Sawka MN, Cheuvront SN, Kenefick RW. High skin temperature and hypohydration impair aerobic performance. Exp Physiol 2012;97:327–32
- Galloway SD, Maughan RJ. Effects of ambient temperature on the capacity to perform prolonged cycle exercise in man. Med Sci Sports Exerc 1997;29:1240–9
- Palinkas LA. Mental and cognitive performance in the cold. Int J Circumpolar Health 2001;60:430–9
- Starkie RL, Hargreaves M, Rolland J, Febbraio MA. Heat stress, cytokines, and the immune response to exercise. Brain Behav Immun 2005;19:404–12
- Chrousos GP. Stress and disorders of the stress system. Nat Rev Endocrinol 2009;5:374–81
- van der Zee J. Heating the patient: A promising approach? Ann Oncol 2002;13:1173–84
- Ash SR, Steinhart CR, Curfman MF, Gingrich CH, Sapir DA, Ash EL, et al. Extracorporeal whole body hyperthermia treatments for HIV infection and AIDS. ASAIO J 1997;43:M830–8
- Brockow T, Wagner A, Franke A, Offenbächer M, Resch KL. A randomized controlled trial on the effectiveness of mild water-filtered near infrared whole-body hyperthermia as an adjunct to a standard multimodal rehabilitation in the treatment of fibromyalgia. Clin J Pain 2007;23:67–75
- Tarner IH, Müller-Ladner U, Uhlemann C, Lange U. The effect of mild whole-body hyperthermia on systemic levels of TNF-α, IL-1β and IL-6 in patients with anklylosing spondylitis. Clin Rheumatol 2008;7:367–72
- Stephenson LA, Kolka MA. Thermoregulation in women. Exerc Sport Sci 1993;21:231–62
- Janssen I, Heymsfield SB, Wang ZM, Ross R. Skeletal muscle mass and distribution in 468 men and women aged 18–88 yr. J Appl Physiol 2000;89:81–88
- van Marken Lichtenbelt WD, Vanhommerig JW, Smulders NM, Drossaerts JM, Kemerink GJ, Bouvy ND, et al. Cold-activated brown adipose tissue in healthy men. N Engl J Med 2009;360:1500–8
- Kenney WL, Munce TA. Invited review: Aging and human temperature regulation. J Appl Physiol (1985) 2003;6:2598–603