
Abstract
Purpose: Dosimetry during deep local hyperthermia treatments in the head and neck currently relies on a limited number of invasively placed temperature sensors. The purpose of this study was to assess the feasibility of 3D dosimetry based on patient-specific temperature simulations and sensory feedback. Materials and methods: The study includes 10 patients with invasive thermometry applied in at least two treatments. Based on their invasive thermometry, we optimised patient-group thermal conductivity and perfusion values for muscle, fat and tumour using a ‘leave-one-out’ approach. Next, we compared the accuracy of the predicted temperature (ΔT) and the hyperthermia treatment quality (ΔT50) of the optimisations based on the patient-group properties to those based on patient-specific properties, which were optimised using previous treatment measurements. As a robustness check, and to enable comparisons with previous studies, we optimised the parameters not only for an applicator efficiency factor of 40%, but also for 100% efficiency. Results: The accuracy of the predicted temperature (ΔT) improved significantly using patient-specific tissue properties, i.e. 1.0 °C (inter-quartile range (IQR) 0.8 °C) compared to 1.3 °C (IQR 0.7 °C) for patient-group averaged tissue properties for 100% applicator efficiency. A similar accuracy was found for optimisations using an applicator efficiency factor of 40%, indicating the robustness of the optimisation method. Moreover, in eight patients with repeated measurements in the target region, ΔT50 significantly improved, i.e. ΔT50 reduced from 0.9 °C (IQR 0.8 °C) to 0.4 °C (IQR 0.5 °C) using an applicator efficiency factor of 40%. Conclusion: This study shows that patient-specific temperature simulations combined with tissue property reconstruction from sensory data provides accurate minimally invasive 3D dosimetry during hyperthermia treatments: T50 in sessions without invasive measurements can be predicted with a median accuracy of 0.4 °C.
Introduction
Patients with a tumour in the head and neck (H&N) region are often treated with radiotherapy and/or chemotherapy. At our institute H&N patients can also be treated with radiotherapy combined with hyperthermia, i.e. elevating tissue temperature to 39–44 °C. For this combined treatment, phase III clinical evidence shows a substantially improved clinical outcome without inducing additional toxicity [Citation1–3]. For the hyperthermia treatments we used the HYPERcollar applicator system, which is specifically designed to treat tumours in the H&N region that are located deeper than 4 cm from the skin [Citation4]. The HYPERcollar is a ring-shaped phased array hyperthermia applicator consisting of 12 antennas uniformly divided over two rings of six antennas, which can be individually controlled and operate at a frequency of 434 MHz [Citation5]. Prior to the first treatment with this applicator, a hyperthermia treatment plan (HTP) is made for system settings optimisation, for decision-making, and to apply our real-time adaptive hyperthermia strategy [Citation6]. In our current HTP, electromagnetic (EM) simulations are used to predict the energy deposition, i.e. the specific absorption rate (SAR), in the patient. Clinical studies have shown that treatment outcome is related to thermal dose [Citation7,Citation8], which advocates the use of temperature predictions instead of SAR predictions.
In a previous study [Citation9] a technique was presented that optimises temperature simulation parameter values by fitting the simulated temperatures to the measured temperatures during treatment. The technique used only temperatures at steady state, while for evaluation of the complete treatment a transient temperature simulation is required.
The great strength of temperature simulations over the sparse data from the currently applied invasive thermometry is the possibility of generating temperature maps for the entire 3D volume. Further, temperature simulations provide an economic alternative for 3D magnetic resonance temperature imaging (MRTI) [Citation10], which has not been demonstrated in the head and neck and which might prove challenging due to motion and susceptibility artefacts [Citation11].
The purpose of this study was to assess the feasibility of 3D dosimetry based on patient-specific temperature simulations and sensory feedback. In addition, we established the accuracy of replacing invasive temperature measurements in each hyperthermia session by temperature predictions combined with invasive temperature data of the first session. First, we optimised the thermal conductivity and perfusion patient-group parameter values for muscle, fat and tumour, and assessed the accuracy of the transient temperature simulation in a ‘leave-one-out’ approach. Next, we compared the accuracy of the predicted temperature (ΔT) and the hyperthermia treatment quality (T50) of the optimisations based on the patient-group parameter values to those based on patient-specific parameter values. The parameters were optimised using an applicator efficiency factor of 40% and 100%. The accuracy of the optimisation with an applicator efficiency factor of 100% was used only for comparison with previous studies and as a robustness check of the optimisation technique.
Materials and methods
In our view there are two approaches to validate the 3D simulated temperature using sensory measurements. The first approach is to validate within one treatment by applying a leave-one-out experiment on the measurements points in the 3D volume. In such an experiment, the simulated 3D temperature can be optimised on a number of measurement probes and tested on a measurement probe that is not used in the optimisation. In theory, for the best accuracy this approach requires at least two measurement points per tissue, i.e. six or more for fat, muscle and tumour, to provide validation of the 3D temperature distribution for one treatment only. In an alternative approach we optimised the patient-specific 3D temperature using all probes of the first treatment to predict the temperature for subsequent treatments. This approach not only provides an estimate of the 3D temperature prediction accuracy, including repeatability uncertainty, but also allows for improving patient comfort since at subsequent treatments it provides the accuracy of replacing invasive probes by predictions.
Treatment procedure
Patients were treated once or twice a week with deep, local H&N hyperthermia depending on the radiotherapy radiation schedule. Before the hyperthermia treatment, closed-tip thermometry catheters were placed interstitially, intra-lumenally and/or at the skin. The interstitial catheters were assumed to be located in tumour, muscle or fat tissue. They were placed under computed tomography (CT) guidance or under anaesthesia in an operating room. In the hyperthermia treatment room the patient was positioned in the same orientation with respect to the applicator as in the HTP. After patient positioning, fibre-optic temperature sensors (FISO, Quebec, Canada) were inserted into the closed-tip catheters. The hyperthermia treatment was started by applying 200 W of total input power with antenna phase and power settings from the HTP. Power was increased in steps of 30 W, till one of the tolerance limits was reached [Citation4] or when the patient indicated a hot-spot at a site without thermometry. During the treatment, two phases were defined: 1) ‘power-up phase’, and 2) ‘plateau-phase’, and the transition was assumed to be always after 15 min of heating.
Patient data
Over the past 7 years, 45 patients have been treated with deep local H&N hyperthermia in our institution. From these patients we selected the patients that had invasive temperature monitoring for at least two treatments. In total 10 patients (35 treatments) were included in the study with tumours in the oropharynx, nasopharynx, parotid gland and thyroid gland ().
Table 1. Patient and treatment characteristics, i.e. tumour location, number of treatments and number of probes per tissue as used in the evaluation, thus excluding the first treatment since this data was already used for parameter optimisation. Note that for all treatments invasive probe measurements were available.
EM-based hyperthermia treatment planning (HTP)
Approximately 1 week before treatment a CT scan was acquired for EM-based HTP purposes. This CT was converted into a 3D patient model by automatically segmenting normal and critical tissues using a multi-atlas-based approach [Citation12]. Then the tumour and the target were manually segmented by an H&N radiation oncologist, as in Verhaart et al. [Citation13]. EM tissue property values were assigned as indicated in . The EM-based HTP procedure was applied using simulation settings as in Rijnen et al. [Citation6].
Table 2. Literature values of EM and thermal tissue properties for T simulations at 37 °C, Baseline [Citation5,Citation25–28,Citation31]. See for ‘thermal stress’ (T-stress) and ‘steady-state optimised’ (SSopt) values.
The locations of the closed-tip catheters were reconstructed using a second CT scan. The measurement points were distributed over muscle (65%), fat (18%) and tumour (17%) tissue, of which 28% are located superficially (probe depth < 1 cm), 62% intermediately (1 cm ≤ probe depth ≤ 4 cm) and 10% deep (probe depth > 4 cm), relative to the skin surface. An example of the reconstructed probe location can be seen in , further examples can be found in the report of Paulides et al. [Citation4] and a detailed description of the reconstruction can be found in the report of Verhaart et al. [Citation9].
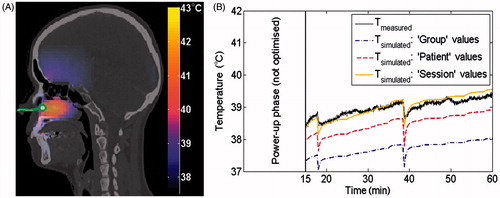
Figure 1. Predicted 3D temperature distribution on the planning CT shown together with the catheter track (solid green line) with a measurement probe at the tip inside the challenging-to-heat nasopharynx tumour (A). As illustration, we show the temperature during treatment (B) for the temperature measured at the tip (solid black) compared with the predicted temperatures using Group (dash-dot purple), Patient (dashed red) and Session (solid orange) parameter values, when six parameters were optimised using an applicator efficiency factor of 100%. Results for an applicator efficiency factor of 40% were similar and therefore not shown.
Temperature simulations
SEMCAD-X (version 14.8.5, Schmid & Partner Engineering, Zurich, Switzerland) was used to predict the 3D temperature distribution according to the Pennes’ bioheat equation [Citation14]:
where T °C is the temperature, t s is the time, ρ kg m−3 is the volume density of mass, c J kg−1 °C−1 is the specific heat capacity, k W m−1 °C−1 is the thermal conductivity, ω mL min−1 kg−1 is the volumetric blood perfusion rate, Q W kg−1 is the metabolic heat generation rate, S W kg−1 is the SAR and the subscript b denotes a blood property. To account for temperature losses, we applied a mix of convective and Neumann (fixed flux) boundary conditions:
where n is the direction normal to the surface (in m), Toutside is the temperature outside the boundary (in °C), h is the heat transfer coefficient due to convective and radiative losses (W m−2 °C−1) and F is the fixed heat flux due to perspiration (W m−2). The boundary conditions were applied at the following interfaces: tissue–surrounding air (hsurrounding air = 8 W m−2 °C−1, [Citation15]), tissue–waterbolus (hWB = 82 W m−2 °C−1, [Citation16]), tissue–internal air, tissue–lung and tissue–metal implants (hinternal air/metal = 50 W m−2 °C−1, [Citation15]). The initial temperature in the tissues was set to 37 °C while the temperature of the surrounding air and the waterbolus was set to 20 °C, as measured during hyperthermia treatments.
To apply actual treatment power steering in the temperature simulation, user-defined sources were created when the applied treatment power and/or phase changed more than ±5 W or 5 °C respectively. For the user-defined source, the treatment phase and amplitude settings were applied to each antenna and the combined EM field was used to compute the SAR. The scaling factor of the source was the applicator efficiency factor (η). Thus, η determines the fraction of the power from the antenna connectors that is transferred into the patient.
Optimisation procedure of thermal parameter values
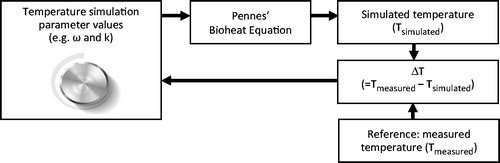
To optimise thermal parameter values we started with the initial temperature simulation parameter values that solved the Pennes’ bioheat equation. The resulting simulated temperatures (Tsimulated) were compared with the measured temperatures (Tmeasured). At each iteration of the optimisation procedure the parameter values were modified in order to minimise the difference (ΔT) between Tmeasured and Tsimulated. shows a block scheme of this procedure.
Figure 2. Block scheme of the optimisation procedure.
Optimisations based on transient temperature simulations were run using two different applicator efficiencies:
Tropt η: 40%
Tropt η: 100%
In both optimisations six thermal tissue parameters were optimised, i.e. ωtumour, ωmuscle, ωfat, ktumour, kmuscle and kfat. In the first optimisation an applicator efficiency of 40% was used, which was obtained for the HYPERcollar applicator by Adibzadeh et al. [Citation17] using the power-off method [Citation18,Citation19]. Since the patients included in our study were all treated with the HYPERcollar applicator we used the result of this optimisation to determine the feasibility of 3D dosimetry. In the second optimisation a perfect applicator efficiency of 100% was assumed. The result of this optimisation was used only for comparison with previous studies and as a robustness check of the optimisation technique.
The temperature simulation parameter values were optimised by minimising the cumulative differences between measured and simulated temperature points over all probes and the complete treatment time, excluding the first 15 min of the power-up phase. A constrained non-linear optimisation function [Citation20] fminsearchbnd in MATLAB (version R2013a, MathWorks, Natick, MA, USA) was used with a maximum number of iterations 300, relative tolerance 0.1 and constraints ω ε (1, ∞) mL min−1 kg−1, k ε (0.01, ∞) W m−1 °C−1. The initial values for ω and k were chosen as in Verhaart et al. [Citation9] (: ‘baseline’ values). Each simulation took on average 48 ± 28 min for Tropt η: 100% and 28 ± 15 min for Tropt η: 40% at a standard desktop computer with i7 3930K processor for a simulation consisting of 15 MCells using a double precision solver.
Table 3. Patient-group optimised values of transient temperature simulations using an applicator efficiency factor of η: 100% and η: 40%. For comparison, we also show literature values for these thermal tissue properties for T simulations at 37 °C: Baseline [Citation5,Citation25–28,Citation31], thermal stress (T-stress) [Citation29] and steady-state optimised (SSopt) values [Citation9].
Evaluation of optimised thermal parameter values
Patient-group values
To quantify the predicted temperature accuracy using transient temperature simulations we validated the patient-group optimised temperature simulation parameter values (Group) in a leave-one-out experiment. In this experiment the data of a single patient was used as the test data, and the data of the remaining patients as the training data to optimise the parameter values. During the test the median value of the optimised parameter values of the training set was applied to the test set. This procedure was repeated such that each single patient data was used once as the test data. The advantage of this experiment was that all patients in our limited patient group could be used for training and testing, while we avoided over-tuning of the parameter values with respect to our group of patients, such that the validation held for new patients.
Patient-specific values
Patient-specific optimised thermal property values (Patient) were obtained by applying the optimisation procedure to the first treatment. These patient-specific optimised values were applied to the next treatments () to investigate the accuracy of temperature simulation.
Session-specific values
The session-specific optimised values (Session) were obtained by applying the optimisation procedure to a treatment and using the resulting optimised thermal parameter values to the same treatment. These session-specific optimised values result in the best accuracy you could obtain with the optimisation procedure, i.e. it describes how well the (optimised) model fits the data.
Overview of analysis
First, the accuracy of the patient-group optimised parameter values of Tropt η: 100% and Tropt η: 40% were compared with the accuracy of using literature parameter values, i.e. from steady-state temperature simulations using six parameters (SSopt), baseline values at 37 °C (Baseline) and values scaled due to the thermal stress (T-stress). Second, the accuracy of temperature simulation was compared between Patient, Group and Session parameter values. Third, the accuracy between Tropt η: 100% and Tropt η: 40% was compared to check the robustness of the optimisation technique. Since the patients included in our study were all treated with the HYPERcollar applicator, we used the result of Tropt η: 40% to determine the feasibility of 3D dosimetry.
The accuracy of temperature simulation was reported by the median and the inter-quartile range (IQR) of the absolute temperature difference (ΔT) between measured and simulated temperature points over all treatments, all probes and the complete treatment duration, excluding the first 15 min of the power-up phase. IQR is the difference between the 75th and the 25th percentiles of the samples in ΔT, as indicated by the edges of the box-plots in and .The feasibility of 3D dosimetry is quantified by ΔT50, defined as the difference between the measured and simulated T50 in the target. T50 is a frequently used hyperthermia treatment quality parameter and is defined as the temperature exceeded by 50% of the monitored probes in the whole target and averaged over all treatments per patient [Citation8]. Note that ΔT and ΔT50 are in fact measures of inaccuracy; however, for readability reasons we used the term accuracy. We tested for statistical significance (p < 0.05) using the non-parametric Wilcoxon signed-rank test [Citation21].
Figure 3. Comparison of the transient temperature simulation accuracy (ΔT) when applying Group, Patient or Session parameter values from transient simulations using an applicator efficiency factor of 100% (Tropt η: 100%) or 40% (Tropt η: 40%). As a cross-check, the Group parameter values from steady-state simulations (SSopt) are given. Statistically significant differences are indicated for Group versus Patient (Δ), Group versus Session (▹) and Patient versus Session (◃). In the box-plots, the central mark is the median, the edges are the 25th and 75th percentiles, the whiskers extend to the most extreme data points not considered outliers (99.3%), and outliers are plotted individually (+).
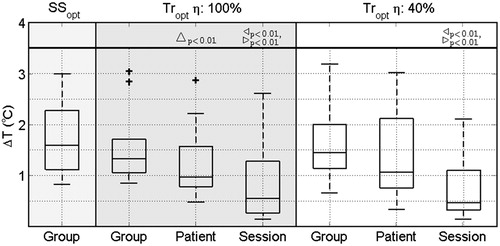
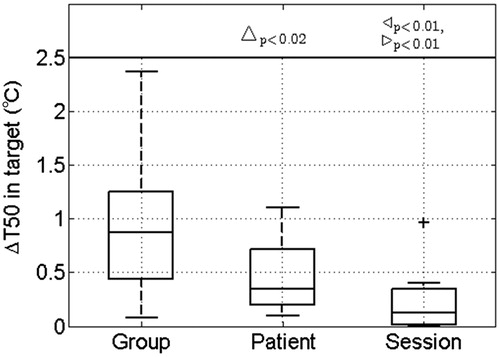
Figure 4. The feasibility of 3D dosimetry quantified by the difference in measured and simulated T50 in the target (ΔT50) using transient temperature simulation with an applicator efficiency of 40% when applying Group, Patient or Session parameter values. Note that the T50 could only be computed for eight patients since they received invasive measurements inside the target. Statistically significant differences are indicated for Group versus Patient (Δ), Group versus Session (▹) and Patient versus Session (◃). In the box-plots the central mark is the median, the edges are the 25th and 75th percentiles, the whiskers extend to the most extreme data points not considered outliers (99.3%) and outliers are plotted individually (+).
Results
shows the patient-group optimised values for transient temperature simulations using an applicator efficiency factor of η: 100% and η: 40%. The values of η: 40% agree most with the literature values.
shows three results. First, it compares the accuracy of the predicted temperature using Group parameter values optimised using either steady-state temperature simulations (SSopt) or transient temperature simulations (Tropt η: 100% and Tropt η: 40%). The accuracy improved when replacing steady-state by transient optimised parameters, i.e. ΔT reduces from 1.6 °C (IQR 1.2 °C) for SS opt to 1.3 °C (IQR 0.7 °C) for Tropt η: 100% and 1.4 °C (IQR 0.9 °C) for Tropt η: 40%. Overall, our optimised parameter values strongly improved the accuracy compared to the accuracy based on literature values: 10.9 °C (IQR 11.5 °C) for baseline values and 2.9 °C (IQR 3.4 °C) for T-stress values (not shown). Second, provides the accuracy of the optimisation procedure using either Group, Patient or Session parameter values for transient temperature simulations using an applicator efficiency factor of η: 100% and η: 40%. A significant improvement in accuracy was found when using patient-specific parameter values of the first treatment for temperature predictions in following treatments for Tropt η: 100%, i.e. ΔT significantly reduced from 1.3 °C (IQR 0.7 °C) to 1.0 °C (IQR 0.8 °C). Although not significant, Tropt η: 40% shows a similar improvement, i.e ΔT reduced from 1.4 °C (IQR 0.9 °C) to 1.1 °C (IQR 1.4 °C). Third, compares Tropt η: 100% with Tropt η: 40%. In general, the optimised parameter values resulted in similar accuracies, indicating the robustness of the optimisation method.
illustrates this improvement, since it clearly shows that the Patient values predicted the measured temperature better than the Group parameter values. Note that the Session parameter values resulted in an almost complete match with the measured temperatures.
further stresses the improvement in 3D temperature simulation with the frequently used hyperthermia treatment quality parameter T50 in the target, for the eight patients that had invasive measurements available inside the target. It shows a significantly reduced median difference between measured and predicted T50 in the target when comparing the application of Group versus Patient parameters, i.e. ΔT50 significantly reduced from 0.9 °C (IQR 0.8 °C) to 0.4 °C (IQR 0.5 °C).
Discussion
3D temperature simulation accuracy
In this study we assessed the feasibility of 3D dosimetry based on patient-specific temperature simulations and sensory feedback. The temperature simulations using patient-specific tissue properties in combination with patient-specific 3D models significantly improved temperature prediction accuracy compared to patient-group averaged properties. In a set of eight patients, the 3D median tumour temperature (T50) can be predicted with a median accuracy of 0.4 °C (IQR 0.5 °C) using these patient-specific properties. This makes our patient-specific temperature simulations a promising tool for minimally invasive 3D dosimetry during hyperthermia treatments.
Other approaches that investigated accuracy of 3D temperature dosimetry were based on the power-off method [Citation18,Citation19] or MRTI. The power-off technique allows SAR or the effective perfusion to be determined, i.e. a combination of perfusion and thermal conduction from the measured temperature decay at power-off, e.g. at the end of the treatment. Raaymakers et al. [Citation22] used this technique to iteratively optimise the tissue perfusion parameter value for the thermal simulation of each single patient. For seven patients they found a patient average absolute temperature difference of 1.3 ± 1.1 °C (68% of data values). We should compare this with our accuracy of the Session values: median: 0.5 °C (IQR 1.0 °C) for Tropt η: 100%, and median: 0.5 °C (IQR 0.8 °C) for Tropt η: 40% (50% of data values). There are several possible explanations for this difference between both studies: the difference in the region of interest: prostate versus head and neck, difference in the less accurate probe reconstruction due to a courser imaging (ultrasound 5 mm versus CT 0.3 × 0.3 × 0.5 − 1 × 1 × 3 mm) and a less accurate temperature simulation due to a less detailed patient-model (MR versus CT + MR).
MRTI is a non-invasive temperature imaging technique, which provides an accuracy in the extremities or in the pelvic lower than 1 °C [Citation23,Citation24]. However, accuracy has not been demonstrated for the H&N and MRTI in this region is expected to be challenging due to motion and susceptibility artefacts [Citation11]. Hence, our transient temperature simulation optimisation technique combined with limited invasive thermometry currently provides the best option for 3D temperature dosimetry during head and neck hyperthermia.
A number of limitations may have affected our results. Firstly, to reduce simulation time, metal implants were not modelled as volumes with metal properties, but instead as inactive while mimicking their impact by a mixed boundary condition. An additional investigation in one patient model showed that this only affected the predicted temperatures <0.5 cm from metal, and hence only a small impact on overall simulation accuracy can be expected. Secondly, the reconstruction of the temperature sensor locations was assumed to be 100% accurate. However, earlier we showed that manual tracking and registration errors affect reconstruction accuracy [Citation9], and thus possibly also the optimised parameter values and reported accuracy. Thirdly, most measurement sensors were available in oropharynx patients, where reconstruction and measurement accuracy is the poorest [Citation4]. Since this region is a worst-case estimate, measurements in other regions should be better. Fourthly, temperature dependency of perfusion is to be expected, but not incorporated in our study. Therefore our optimised values are expected to be less accurate for higher temperatures. Lastly, our results and conclusions are based on H&N hyperthermia treatment data only, but the optimisation of temperature simulations using sensory data is a generic method that can be applied to other sites as well.
Optimised tissue property values
The six optimised parameter values (ω and k for tumour, muscle and fat tissue) using an applicator efficiency factor of 100% (Tropt η: 100%) were all much larger, i.e. one or two orders of magnitude, than previously reported in literature [Citation25–29]. However, they are in agreement with the values previously found with the steady-state simulation-based technique [Citation9]. The values of these parameters became lower and closer to physiological values when an applicator efficiency factor of 40% (Tropt η: 40%) was used (). In this optimisation the largest deviations in tissue properties were found in tumour tissue. This discrepancy in tumour tissue properties could be caused by differences in tumour pathology and physiology. Baseline literature values were from brain tumours [Citation28] and thermal stress values were from pelvic tumours, i.e. cervix, prostate, rectum [Citation29]. Nevertheless, note that in the present study we aimed to assess the feasibility of 3D dosimetry using patient-specific temperature simulation and not necessarily with physiological thermal parameters.
Despite the variation in optimised tissue property values using an applicator efficiency factor of 40% or 100%, a similar T50 accuracy was found. As treatment decisions are based on T50, these decisions will not be dependent of the applicator efficiency used. However, note that a re-optimisation of the tissue property values is needed when a different applicator efficiency factor than 40% or 100% is used.
In one of our optimisations we used an applicator efficiency factor of 40%. Applicator quality assurance measurements showed that 30% can be explained by mismatches and heat generation in the antenna and connector. Hence, a large proportion of SAR modelling uncertainty is caused by an incorrectly modelled water-bolus shape. In our new applicator the HYPERcollar3D [Citation30], we therefore implemented a much more reproducible and conformable water-bolus shape in order to substantially improve the accuracy of simulations. Such a reproducible set-up should further improve the applicability of the method presented here, and hence the clinical potential of this procedure.
Conclusion
In this study we assessed the feasibility of 3D dosimetry based on patient-specific temperature simulations and sensory feedback. The hyperthermia T50 treatment quality parameter in the target can be predicted with a median accuracy of 0.4 °C (IQR 0.5 °C) using patient-specific properties. Our analysis clearly shows the potential of patient-specific temperature simulations combined with sensory data as a promising tool for minimally invasive 3D dosimetry during hyperthermia treatments.
Declaration of interest
This study was financially supported by the technology foundation STW (Grant 10846) and the Dutch Cancer Society (Grant EMCR 2009-4270). The authors alone are responsible for the content and writing of the paper.
References
- Valdagni R, Amichetti M. Report of long-term follow-up in a randomized trial comparing radiation therapy and radiation therapy plus hyperthermia to metastatic lymphnodes in stage IV head and neck patients. Int J Radiat Oncol Biol Phys 1993;28:163–9
- Huilgol NG, Gupta S, Sridhar CR. Hyperthermia with radiation in the treatment of locally advanced head and neck cancer: A report of randomized trial. J Cancer Res Ther 2010;6:492–6
- Hua Y, Ma S, Fu Z, Hu Q, Wang L, Piao Y. Intracavity hyperthermia in nasopharyngeal cancer: A phase III clinical study. Int J Hyperthermia 2011;27:180–6
- Paulides MM, Bakker JF, Linthorst M, van der Zee J, Rijnen Z, Neufeld E, et al. The clinical feasibility of deep hyperthermia treatment in the head and neck: New challenges for positioning and temperature measurement. Phys Med Biol 2010;55:2465–80
- Paulides MM, Bakker JF, Neufeld E, van der Zee J, Jansen PP, Levendag PC, et al. The HYPERcollar: a novel applicator for hyperthermia in the head and neck. Int J Hyperthermia 2007;23:567–76
- Rijnen Z, Bakker JF, Canters RAM, Togni P, Verduijn GM, Levendag PC, et al. Clinical integration of software tool VEDO for adaptive and quantitative application of phased array hyperthermia in the head and neck. Int J Hyperthermia 2013;29:181–93
- Sherar M, Liu FF, Pintilie M, Levin W, Hunt J, Hill R, et al. Relationship between thermal dose and outcome in thermoradiotherapy treatments for superficial recurrences of breast cancer: data from a phase III trial. Int J Radiat Oncol Biol Phys 1997;39:371–80
- Franckena M, Fatehi D, de Bruijne M, Canters R a M, van Norden Y, Mens JW, et al. Hyperthermia dose–effect relationship in 420 patients with cervical cancer treated with combined radiotherapy and hyperthermia. Eur J Cancer 2009;45:1969–78
- Verhaart RF, Rijnen Z, Fortunati V, Verduijn GM, van Walsum T, Veenland JF, et al. Temperature simulations in hyperthermia treatment planning of the head and neck region: rigorous optimization of tissue properties. Strahlenther Onkol 2014;190:1117–24
- Gellermann J, Hildebrandt B, Issels R, Ganter H, Wlodarczyk W, Budach V, et al. Noninvasive magnetic resonance thermography of soft tissue sarcomas during regional hyperthermia: correlation with response and direct thermometry. Cancer 2006;107:1373–82
- Paulides MM, Bakker JF, Hofstetter LW, Numan WCM, Pellicer R, Fiveland EW, et al. Laboratory prototype for experimental validation of MR-guided radiofrequency head and neck hyperthermia. Phys Med Biol 2014;59:2139–54
- Fortunati V, Verhaart RF, van der Lijn F, Niessen WJ, Veenland JF, Paulides MM, et al. Tissue segmentation of head and neck CT images for treatment planning: A multiatlas approach combined with intensity modeling. Med Phys 2013;40:71905
- Verhaart RF, Fortunati V, Verduijn GM, van Walsum T, Veenland JF, Paulides MM. CT-based patient modeling for head and neck hyperthermia treatment planning: Manual versus automatic normal-tissue-segmentation. Radiother Oncol 2014;111:158–63
- Pennes HH. Analysis of tissue and arterial blood temperatures in the resting human forearm. J Appl Physiol 1948;1:93–122
- Bakker JF, Paulides MM, Christ A, Kuster N, van Rhoon GC. Assessment of induced SAR in children exposed to electromagnetic plane waves between 10 MHz and 5.6 GHz. Phys Med Biol 2010;55:3115–30
- Van Der Gaag ML, De Bruijne M, Samaras T, Van Der Zee J, Van Rhoon GC. Development of a guideline for the water bolus temperature in superficial hyperthermia. Int J Hyperthermia 2006;22:637–56
- Adibzadeh F, Verhaart RF, Verduijn GM, Fortunati V, Rijnen Z, Franckena M, et al. Association of acute adverse effects with high local SAR induced in the brain from prolonged RF head and neck hyperthermia. Phys Med Biol 2015;60:995–1006
- Waterman FM, Tupchong L, Phil D, Nerlinger RE, Matthews J. Blood flow in human tumors during local hyperthermia. Int J Radiat Oncol Biol Phys 1991;20:1255–62
- Roemer R, Fletcher A, Cetas T. Obtaining local SAR and blood perfusion data from temperature measurements: steady state and transient techniques compared. Int J Radiat Oncol Biol Phys 1985;11:1539–50
- Lagarias JC, Reeds JA, Wright MH, Wright PE. Convergence properties of the Nelder–Mead simplex method in low dimensions. SIAM J Optim 1998;9:112–47
- Wilcoxon F. Individual comparisons by ranking methods. Biometrics Bull 1945;1:80–3
- Raaymakers BW, Van Vulpen M, Lagendijk JJ, De Leeuw AAC, Crezee J, Battermann JJ. Determination and validation of the actual 3D temperature distribution during interstitial hyperthermia of prostate carcinoma. Phys Med Biol 2001;46:3115–31
- Gellermann J, Wlodarczyk W, Feussner A, Fähling H, Nadobny J, Hildebrandt B, et al. Methods and potentials of magnetic resonance imaging for monitoring radiofrequency hyperthermia in a hybrid system. Int J Hyperthermia 2005;21:497–513
- Craciunescu OI, Stauffer PR, Soher BJ, Wyatt CR, Arabe O, Maccarini P, et al. Accuracy of real time noninvasive temperature measurements using magnetic resonance thermal imaging in patients treated for high grade extremity soft tissue sarcomas. Med Phys 2009;36:4848–58
- Hasgall P, Neufeld E, Gosselin M, Klingenbock A, Kuster N. IT’IS database for thermal and electromagnetic parameters of biological tissues. Version 2.4, 30 July 2013. www.itis.ethz.ch/database
- Knudsen M, Heinzl L. Two-point control of temperature profile in tissue. Int J Hyperthermia 1986;2:21–38
- Jain RK, Grantham FH, Gullino PM. Blood flow and heat transfer in Walker 256 mammary carcinoma. J Natl Cancer Inst 1979;62:927–33
- Olesen J, Paulson OB. The effect of intra-arterial papaverine on the regional cerebral blood flow in patients with stroke or intracranial tumor. Stroke 1971;2:148–59
- Sreenivasa G, Gellermann J, Rau B, Nadobny J, Schlag P, Deuflhard P, et al. Clinical use of the hyperthermia treatment planning system HyperPlan to predict effectiveness and toxicity. Int J Radiat Oncol Biol Phys 2003;55:407–19
- Togni P, Rijnen Z, Numan WCM, Verhaart RF, Bakker JF, van Rhoon GC, et al. Electromagnetic redesign of the HYPERcollar applicator: toward improved deep local head-and-neck hyperthermia. Phys Med Biol 2013;58:5997–6009
- Joines W, Zhang Y, Li C, Jirtle R. The measured electrical properties of normal and malignant human tissues from 50 to 900 MHz. Med Phys 1994;21:547–50