
Abstract
Purpose: Hyperthermia is a cancer treatment technique that could be delivered as a stand-alone modality or in conjunction with chemotherapy or radiation therapy. Noninvasive and real-time temperature monitoring of the heated tissue improves the efficacy and safety of the treatment. A temperature-sensitive acoustic parameter is required for ultrasound-based thermometry. In this paper the amplitude and the energy of the acoustic harmonics of the ultrasound backscattered signal are proposed as suitable parameters for noninvasive ultrasound thermometry.
Materials and methods: A commercial high frequency ultrasound imaging system was used to generate and detect acoustic harmonics in tissue-mimicking gel phantoms and ex vivo bovine muscle tissues. The pressure amplitude and the energy content of the backscattered fundamental frequency (p1 and E1), the second (p2 and E2) and the third (p3 and E3) harmonics were detected in pulse-echo mode. Temperature was increased from 26° to 46 °C uniformly through both samples. The amplitude and the energy content of the harmonics and their ratio were measured and analysed as a function of temperature.
Results: The average p1, p2 and p3 increased by 69%, 100% and 283%, respectively as the temperature was elevated from 26° to 46 °C in tissue samples. In the same experiment the average E1, E2 and E3 increased by 163%, 281% and 2257%, respectively. A similar trend was observed in tissue-mimicking gel phantoms.
Conclusions: The findings suggest that the harmonics generated due to nonlinear ultrasound beam propagation are highly sensitive to temperature and could potentially be used for noninvasive ultrasound tissue thermometry.
Introduction
Hyperthermia is a cancer treatment method in which the tissue temperature is increased to 40–45 °C. Heat can destroy cancer cells or sensitize them to radiation and chemotherapeutic drugs [Citation1]. Heat can also be used to cause the release of drugs from thermosensitive liposomes [Citation2,Citation3]. Thermosensitive liposomes are being developed to release the drug within the hyperthermia temperature range of 39–43 °C, while remaining stable in non-tumour bloodstream at physiological temperature (37 °C) [Citation4]. This reduces the exposure of healthy organs to chemotherapy and lowers systemic toxicity [Citation2,Citation4].
The second type of thermal therapy is thermal ablation, which directly kills cells by inducing coagulation necrosis in tissue through elevating the temperature above 55 °C. Hyperthermia and thermal ablation are clinically approved for cancer treatment [Citation1,Citation5,Citation6].
There are a number of heating approaches available for thermal therapy based on ultrasound, microwave, radio frequency and infrared (IR) laser energy deposition. Ultrasound has several advantages compared to other heating modalities due to its increased penetration depth in soft tissues and high degree of beam direction control. Moreover, ultrasound energy can be applied noninvasively to tissue [Citation5,Citation6].
One of the therapeutic ultrasound devices in clinics uses high intensity focused ultrasound (HIFU) which deposits the energy of the beam into a small focal region placed in the region of interest in tissue. In a typical HIFU treatment, the temperature of the focal region can be increased to above 55 °C in a few seconds which leads to rapid and highly localised coagulation necrosis in tissue [Citation5,Citation6].
Tissue heterogeneity and perfusion cause non-uniformities in heating the tumour tissue [Citation1]. The other major limitation of thermal therapies is the lack of an accessible and reliable noninvasive and real-time tissue temperature monitoring technique to control the treatment. Monitoring and controlling the tissue temperature distribution during thermal therapy will help to maintain the target temperature in the region of interest without affecting surrounding tissue, which improves the treatment efficacy and safety.
Magnetic resonance imaging (MRI) is considered the gold standard modality for noninvasive temperature measurements in clinics [Citation7]. Magnetic resonance image-guided focused ultrasound (MRgFUS) is the latest technology that has combined the anatomical details and 3D temperature monitoring abilities of MRI and the therapeutic capability of focused ultrasound (FUS) [Citation8,Citation9]. However, MRI thermometry is an expensive modality and suffers from low temporal resolution. Moreover, the heating applicator assembly must be MR compatible [Citation7,Citation8].
Ultrasound is a non-ionising, inexpensive, real-time and portable modality which might be a superior alternative to other types of thermometry systems. Previously, three major ultrasonic methods have been proposed to measure temperature noninvasively, based on estimations of 1) the backscattered radiofrequency (RF) echo shift [Citation10], 2) the variation in the attenuation coefficient [Citation11], and 3) the change in backscattered signal energy [Citation12]. However, to date, none of these techniques have been adopted for clinical usage due to their lack of accuracy and robustness for in vivo noninvasive thermometry.
The backscattered RF echo shift technique, which has been shown to be the most promising ultrasound-based thermometry method, is based on two physical phenomena: 1) the change in the speed of sound with temperature, and 2) thermal expansion of the medium due to heating [Citation10]. However, there are several challenges that face noninvasive thermometry based on this technique [Citation12,Citation13]. A major challenge for in vivo applications is related to tissue motion which includes respiratory and cardiac motions. Tissue motion produces mechanical shifts which are equivalent to temporal shifts and appear as a significant source of artefact in temperature maps [Citation14].
Amongst all other acoustic parameters, such as the speed of sound and attenuation coefficient, the acoustic nonlinearity parameter (B/A) has also been shown to be temperature dependent [Citation15,Citation16]. Some investigators have proposed B/A as a basis for temperature estimation [Citation17,Citation18]. van Dongen and Verweij studied the temperature dependence of absorption coefficient, B/A, speed of sound, and thermal expansion of water [Citation18]. They showed that the absorption coefficient is the most temperature sensitive ultrasound physical parameter and B/A is the second. The temperature dependence of B/A in water was about four times greater than the temperature dependence of the speed of sound and thermal expansion for the same temperature range.
A relatively high-pressure acoustic wave (also known as finite-amplitude wave) becomes progressively distorted as it propagates, generating higher harmonics which can be detected in the signal frequency spectrum. For a given excitation and propagation distance, the extent of the pressure wave distortion and generation of the harmonics mainly depend on the B/A parameter, attenuation coefficient, and the sound speed of the medium [Citation19]. Since all three are sensitive to temperature changes, the acoustic harmonics are also expected to be temperature dependent [Citation18].
In a numerical simulation study, van Dongen and Verweij showed changes in the amplitudes of the harmonics of a transmitted acoustic wave in glycerol as a function of temperature [Citation18]. They demonstrated that noninvasive thermometry using the ratio of the fundamental over the second harmonic amplitudes is feasible, with an accuracy of ± 2 °C.
In this study, the temperature sensitivity of harmonic amplitudes and their energy content generated by nonlinear ultrasound beam propagation in tissue is examined. Higher harmonics were generated and detected with a commercial high frequency ultrasound system used for small animal imaging. The measurements were performed in pulse echo mode on tissue-mimicking gel phantoms and ex vivo bovine muscle tissue samples. The temperature sensitivity of the harmonics in both samples is presented. In this work we demonstrate that the acoustic harmonics are highly temperature dependent and could potentially be considered as a suitable parameter for noninvasive ultrasound thermometry.
Materials and methods
A high frequency ultrasound imaging scanner (Vevo® 770, Visualsonics, Toronto, Canada) with a 25-MHz centre frequency wide-band (100% fractional bandwidth) single-element transducer (RMV-710B, f-number 2.1, 15 mm focal length) was used to generate and detect acoustic harmonics. Mechanical sector sweep of the single element transducer produced 2D RF frames. Higher harmonics were generated through transmitting a 13-MHz 30-cycle pulse that resulted in a focal peak pressure of approximately 3.9 MPa at the baseline temperature of 26 °C in water, measured by a calibrated hydrophone with 0.2 mm active element diameter (HPM02/1, Precision Acoustics, Dorchester, UK).
The pressure amplitudes of the fundamental frequency (p1), the second (p2) and the third (p3) harmonics were obtained from the frequency spectra of the backscattered RF signals from tissue-mimicking gel phantoms and ex vivo bovine muscle tissues. The backscattered energy of the RF signal (E), the fundamental frequency (E1), the second (E2) and the third (E3) harmonics were also calculated for both media.
The gel phantom was composed of 90.4% (by weight) distilled and degased water, 7.8% w/v gelatin, 1% w/v polyethylene oxide and 0.8% w/y formaldehyde. Freshly excised ex vivo bovine muscle tissues were obtained from a local butcher’s shop. The tissue samples were cut to a size of around 3 cm × 8 cm × 2 cm and immersed in 0.9% degassed saline solution at 5 °C for 12 h prior to each experiment. Before the experiment the muscle specimens were degassed in a desiccator connected to a vacuum pump (model 2581, Welch, Monroe, LA) for 30 min in order to remove large air pockets from the tissue.
Both the sample and the transducer were immersed in a temperature controlled circulating water bath (Haake DC10, Thermo Electron, Newington, NH) with a temperature accuracy of ± 0.1 °C in order to induce a homogeneous heat distribution throughout the sample. A schematic of the experimental set-up is shown in . The experiments on ex vivo tissue samples were performed in a phosphate buffered saline (PBS) solution. The temperature was increased from 26° to 46 °C for both samples. In order to reach the steady state, the sample was kept 30 min at each temperature before making the measurement. The transducer was kept outside the water bath (and at room temperature) in between measurements to minimise the time duration when the transducer is exposed to higher temperatures. The transducer was immersed into the water bath only after the sample had reached its equilibrium temperature.
Figure 1. Schematic of the experimental set-up.
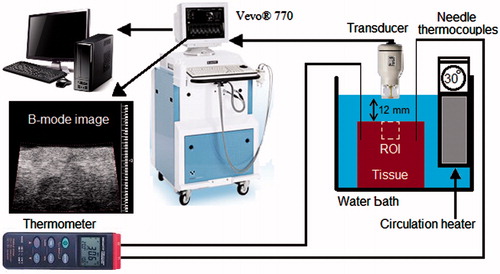
Two home-made calibrated needle thermocouples were inserted into the sample, and the temperature was recorded using a digital thermometer (Omegaette HH306, Omega Engineering, Stamford, CT). Before data collection at each temperature, the water circulator was turned off in order to eliminate vibrations. Care was taken to remove air bubbles from the surface of the sample and the transducer. The experiments on tissue-mimicking gel phantoms and ex vivo tissue samples were repeated in different samples five and six times, respectively.
RF echo data collection was performed when the samples reached the steady-state temperature. At each temperature (from 26 to 46 °C), 50 consecutive backscattered RF frames were captured for averaging, with a frame rate of 1 Hz. Each frame consisted of 100 RF backscattered echo lines covering a region of interest (ROI) of 11 × 16 mm2 within the sample beginning from its surface. The RF signal sampling rate was 420 MSa/s.
A set of experiments on ex vivo bovine muscle tissues were also performed in order to investigate the effect of tissue coagulation and possible bubble formation on the harmonics during the 4-h course of the experiment, particularly during the time when the temperatures were at their highest values. The experiments were performed similar to the ones described above except that the heating process consisted of two steps. First, the temperature of the tissue samples was increased from 26 to 44 °C in 40 min, and second, they were kept at 44 °C for 200 min. RF data collection was performed every 10 min after the tissue was heated to 44 °C (between 40 and 240 min time stamps).
Data analysis
The acquired RF data frames were analysed offline using algorithms developed in MATLAB (MathWorks, Natick, MA). Two methods were used to assess the temperature dependence of the harmonics generated: 1) the peak value of the backscattered pressure harmonics and their ratios (p1, p2, p3, p2/p1 and p3/p1), and 2) the backscattered energy of the RF signal (E), of the harmonics and their ratios (E1, E2, E3, E2/E1 and E3/E1).
For the first technique the harmonics were obtained by calculating the frequency spectrum of the windowed backscatter signal. The window size for taking the Fourier transform was chosen 10 × τ ( ∼ 0.77 μs) to obtain the p1, p2 and p3 of the echo signal, where τ is the period of the fundamental frequency (13 MHz). Gaussian windows were used with step size of 10 × τ with no overlap between two consecutive windows. The frequency spectrum of each windowed signal along the RF data line was first averaged over the 50 frames and then averaged with the windows at the same depth along all the 100 RF lines (spanning a range of 11 mm). The pressure harmonic amplitudes and their ratios (p1, p2, p3, p2/p1 and p3/p1) were calculated and plotted for each window. The maximum values were then recorded and analysed as a function of temperature.
For the second technique, the backscattered energy of the RF signal and the harmonics in the focal region with an area of 5 × 16 mm2 was calculated. The ROI was limited to the focal region in order to improve the signal to noise ratio. The backscattered energies of the harmonics were obtained by first filtering the RF signal using the Filter Design and Analysis Tool (FDATool) in the MATLAB Signal Processing Toolbox. Three band pass equiripple finite impulse response (FIR) filters were designed to pass frequencies between 9 MHz to 16 MHz, 23 MHz to 29 MHz and 36 MHz to 42 MHz in order to separate the fundamental frequency, the second and the third harmonics content of the RF signal, respectively. All three filters had an order of 100. Equiripple FIR filter has equal ripples in both passband and stopband by minimising the maximum approximation error between the desired and designed filter responses. This results in reduction of a large ripple at the edge of the passband at the cost of increasing the transition band [Citation20].
The envelope of the signal was found using the Hilbert transform. Envelope values were squared to calculate the backscattered energy at each data point on the RF signal [Citation21]. The energies were summed over the region of interest for each frame. The energy ratios of E2/E1 and E3/E1 were obtained by dividing the summed energy of the second and the third harmonics over that of the fundamental frequency. Averaged backscattered energy was calculated using 50 frames recorded at each temperature.
Results
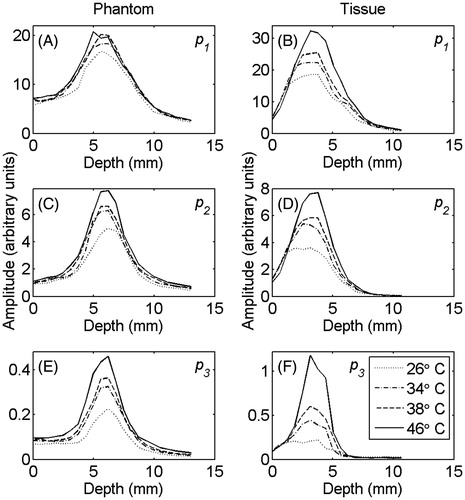
shows the averaged (100 RF lines) peak pressure values of the fundamental frequency (A), the second (B), and third (C) harmonics in the gel phantom and tissue sample at temperatures of 26°, 34°, 38° and 46 °C. The harmonics were primarily generated in the focal region and increased as the temperature was raised.
Figure 2. The averaged (100 RF lines) values of (A) and (B) p1, (C) and (D) p2, (E) and (F) p3 in tissue-mimicking gel phantom (left column) and ex vivo bovine muscle tissue (right column) at temperatures of 26°, 34°, 38° and 46 °C.
Similar graphs were plotted for all data sets obtained from tissue and gel samples. The maximum value of the pressure harmonics at each temperature was chosen. The average and standard deviation of the maxima of the harmonics and their ratios were calculated for each temperature. and show the relative changes of the p1, p2, p3, p2/p1 and p3/p1 as a function of temperature for tissue-mimicking gel phantoms and ex vivo tissue samples, respectively. The percentage increase in the harmonics and their ratios due to the 20 °C temperature rise from 26° to 46 °C is summarised in for both samples.
Figure 3. Changes in (A) p1, (B) p2, (C) p3 and the ratios (D) p2/p1 and (E) p3/p1 as a function of temperature in tissue-mimicking gel phantoms with respect to the initial temperature (26 °C). The error bars represent the standard deviation of five trials.
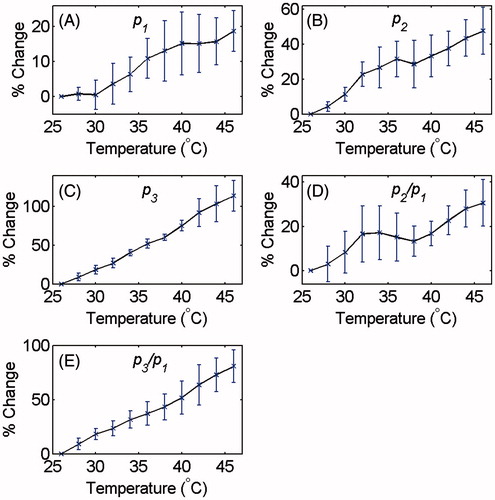
Figure 4. Changes in (A) p1, (B) p2, (C) p3 and the ratios (D) p2/p1 and (e) p3/p1 as a function of temperature in ex vivo bovine muscle tissues with respect to the initial temperature (26 °C). The error bars represent the standard deviation of six trials.
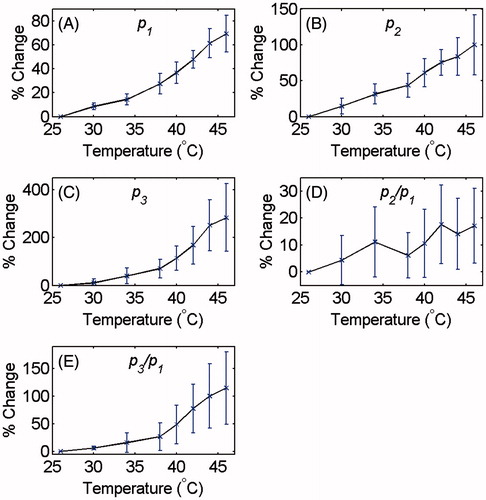
Table 1. Percentage increase in p1, p2, p3 and the ratios p2/p1 and p3/p1 as the temperature was increased from 26° to 46 °C in tissue-mimicking gel phantoms and ex vivo tissue samples.
The average and standard deviation of the backscattered energies of the signal, of the harmonics and their ratios at each temperature were calculated. and show the relative changes of the E, E1, E2, E3, E2/E1 and E3/E1 as a function of temperature for tissue-mimicking gel phantoms and ex vivo tissue samples, respectively. The percentage increase in the backscattered energy of the RF signal, of the harmonics and their ratios due to the 20 °C temperature rise from 26° to 46 °C is summarised in for both samples.
Figure 5. Changes in (A) E, (B) E1, (C) E2, (D) E3 and the ratios (E) E2/E1 and (F) E3/E1 at the focal region as a function of temperature in tissue-mimicking gel phantoms with respect to the initial temperature (26 °C). The error bars represent the standard deviation of five trials.
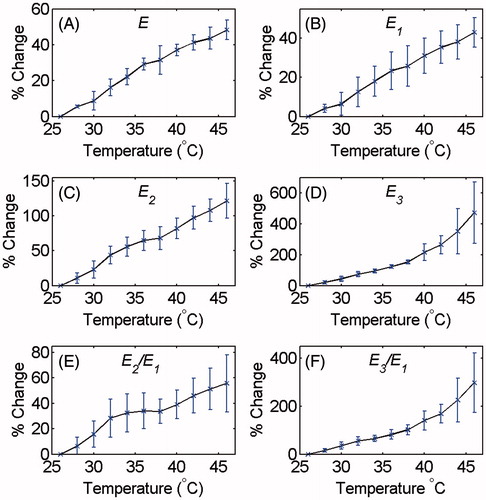
Figure 6. Changes in (A) E, (B) E1, (C) E2, (D) E3 and the ratios (E) E2/E1 and (f) E3/E1 at the focal region as a function of temperature in ex vivo bovine muscle tissues with respect to the initial temperature (26 °C). The error bars represent the standard deviation of six trials.
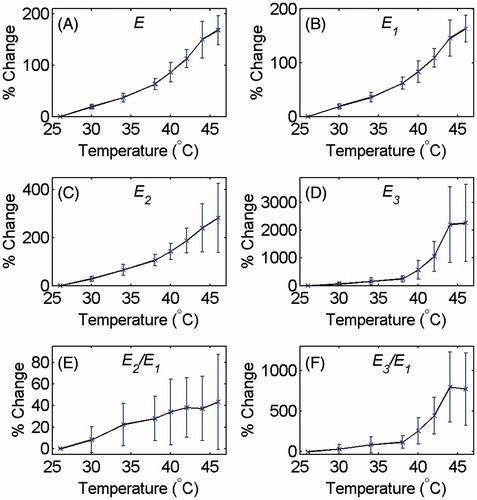
Table 2. Percentage increase in E, E1, E2, E3 and the ratios E2/E1 and E3/E1 as the temperature was increased from 26° to 46 °C in tissue-mimicking gel phantoms and ex vivo tissue samples.
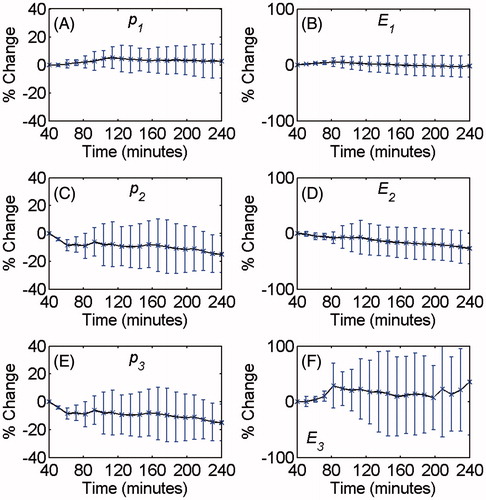
The average and standard deviation of the harmonic amplitudes and energies were calculated as a function of time while the samples were kept at 44 °C for 200 min. shows the relative changes of the p1, p2, p3, E1, E2 and E3 with time.
Figure 7. Changes in (A) p1, (B) E1, (C) p2, (D) E2, (E) p3 and (F) E3 at 44 °C as a function of time in ex vivo bovine muscle tissues with respect to the initial time (40 min). The error bars represent the standard deviation of four trials.
Discussion
As the ultrasound beam propagates in the nonlinear regime, harmonics including the second and the third are generated and backscattered by the scatterers in the medium. shows the growth of harmonics in the focal region of the focused transducer which is due to the cumulative effect of nonlinear beam propagation and rise in acoustic pressure in the focal region. The figure also shows that temperature sensitivity of the nonlinear propagation is more significant for the higher harmonics. The shift in the position of the harmonics peak towards the transducer in the ex vivo bovine muscle tissue (right column of ) is because the tissue samples were placed further away from the transducer. Therefore, the focal region of the transducer (which is the region of creation of harmonics) is closer to the surface of the tissue. This was done in order to increase the signal-to-noise ratio of the harmonics, since the attenuation is significantly higher in tissue samples compared to the gel phantoms.
The amount of wave distortion and the amplitude of the higher harmonics detected using the backscattered signal depend on the attenuation coefficient, the parameter of non-linearity (B/A), the sound speed and the density of the medium.
The Khokhlov–Zabolotskaya–Kuznetsov (KZK) equation is a well-established model for finite-amplitude beam propagation that consists of terms to account for diffraction, absorption and nonlinearity. The nonlinear term in the KZK equation contains β/(), where β is the coefficient of non-linearity defined as β = 1 + B/2A, c0 is the speed of sound and ρ0 is the medium density [Citation19]. All three medium parameters vary with temperature [Citation18].
It has been shown that the attenuation coefficient in most soft tissues decreases with temperature (up to 50 °C) and the slope of this decrease is steeper at higher frequencies [Citation22–25]. Gammell et al. studied the temperature and frequency dependence of the attenuation coefficient in porcine liver, back fat and spleen, and human liver [Citation23]. In all the samples the attenuation coefficient decreased with temperature from 20 °C to 37 °C for the frequency range of 3.5–10 MHz. In the back fat tissue the same trend was observed up to 49 °C. They also demonstrated that the rate of this drop in the attenuation coefficient increased with frequency. Similar results were also reported by Bamber and Hill for a frequency range of 1–7 MHz in freshly excised tissues [Citation22]. Ghoshal et al. showed that the attenuation coefficient decreased by 10–20% with temperature from 37–50 °C in rabbit and beef liver [Citation24].
Several studies have shown the dependence of the non-linear parameter on temperature for biological tissues in in vitro measurements [Citation15–18]. Liu et al. presented the temperature dependence of B/A for porcine fat and porcine liver [Citation17]. They demonstrated that B/A increased about 40% and 55% in porcine fat and liver, respectively, as the temperature was raised from 20–60 °C. Sehgal et al. showed that B/A in excised human liver increased by increasing the temperature from 20–37 °C [Citation15].
The tissue-mimicking gel phantom used in this study was mostly composed of water (90% w/v). In water, the parameter of nonlinearity increases by about 7.3%, and the attenuation coefficient decreases by about −40% with temperature from 26° to 46 °C [Citation18,Citation26,Citation27]. It can therefore be expected that the changes of the acoustic parameters of the gel phantoms with temperature are similar to that in water [Citation28–31].
show an increase of the harmonic amplitudes with temperature, and demonstrate that the higher the harmonic, the higher is its sensitivity to temperature. These could be due to the combined effects of temperature dependence of the attenuation coefficient, the coefficient of nonlinearity, the speed of sound, and the medium density. For a finite-amplitude plane wave propagating in an attenuating medium, the second and the third harmonics pressure amplitudes are proportional to β/() and [β/(
)]2, respectively [Citation19]. Therefore, the temperature dependence of the acoustic parameters manifest themselves more prominently in the higher harmonics causing them to be more sensitive to temperature. The higher temperature dependence of the higher harmonics may also be explained by the frequency and temperature dependence of attenuation.
The results of and show that the increase in the acoustic harmonics with temperature in the tissue samples is about two to three times larger than that in the gel phantoms. The energy of harmonics increased by approximately three to four times more in tissue samples compared to that in the gel phantoms for comparable temperature change (shown in and ). This could be due to the different temperature dependence of the acoustic parameters in each medium. In the temperature range used in this study, the speed of sound increases by approximately 2% in the gel phantom, but in the muscle tissue it increases by approximately 1.4% [Citation28,Citation32]. The nonlinear term in the KZK equation shows that the increase in sound speed results in reduction in harmonics. Therefore, the smaller the increase in sound speed, the larger the increase in the harmonics.
The p2/p1 in and shows a relatively non-monotonic increase as a function of temperature compared to p3/p1. This can be because the relative increase in p2 with temperature is larger than that of p1 but not as significantly as compared to p3.
As shown in and , the standard deviation of the harmonic amplitudes increases as the temperature rises in the ex vivo bovine muscle tissues. This can be due to decomposition and protein denaturation in the tissue since it was kept in the water bath for a long period of time (30 min at each of the temperatures which led to a total experiment time of about four hours for a given tissue sample). The thermal dose (TD), as a widely accepted metric to measure the degree of soft tissue coagulation, was calculated for a point in the centre of the ROI [Citation33]. The calculated TD was equal to 47 min at 43 °C when the temperature was increased from 26° to 44 °C. The TD was equal to 223 min at 43 °C by including the last heating increment. Therefore, if one assumes a thermal dose threshold of 240 min at 43 °C for coagulation necrosis in muscle tissue [Citation34], some necrosis might have occurred mainly at the surface of the tissue sample during the last measurement while the temperature increased from 44° to 46 °C.
shows no significant change in the amplitudes and the energies of the harmonics while the tissue was kept at 44 °C for 200 min. This shows that the increase in the harmonics amplitude and energy was mainly due to temperature changes, and tissue coagulation or possible presence of bubbles has not confounded the measurements.
As mentioned earlier, to minimise the time duration of exposing the transducer to higher temperatures, it was kept outside the water bath in between measurements, and when immersed in water, the RF data collection was done in less than 2 min at each temperature. Moreover, to further investigate the possible effect of temperature variations of the transducer on the measurements, a separate bounce test was performed, in which a quartz plate reflector was placed at the transducer’s focal point, and the echo signal amplitude bounced back from the plate reflector was recorded by the transducer. The bounce test assembly was placed inside the water bath when the water temperature was increased from 26° to 46 °C in increments of 2 °C. It was observed that the measured peak-to-peak pressure amplitude was changed by less than only ± 0.5%, which is insignificant compared to our measurement uncertainties.
Conclusion
In this study the temperature dependence of the acoustic harmonics generated by nonlinear ultrasound beam propagation was investigated in tissue-mimicking gel phantoms and ex vivo tissue samples in pulse echo mode using a commercial high frequency ultrasound imaging scanner. The acoustic harmonics show high sensitivity to temperature compared to other acoustic parameters such as the speed of sound and the attenuation coefficient. The temperature dependence of the harmonic amplitudes and energies increase with frequency and it is most noticeable for the third harmonic. The average p1, p2 and p3 increased by 69%, 100% and 283% when the temperature was increased from 26° to 46 °C in tissue samples, whereas the change in the speed of sound, which is the basis of the ultrasound echo shift thermometry technique, for the same temperature range is about 1.5% in non-fatty soft tissues [Citation13]. The results indicate that the acoustic harmonics generated by nonlinear ultrasound beam propagation could potentially be used for noninvasive temperature monitoring in tissue.
Acknowledgements
The authors wish to acknowledge the technical assistance of Arthur Worthington, Graham Pearson and Luke Yaraskavitch, all from the Department of Physics, Ryerson University, Toronto, Canada.
Declaration of interest
This work was partially supported by the Ontario Research Fund – Research Excellence (ORF-RE) grant and the Natural Sciences and Engineering Research Council of Canada (NSERC Discovery grants) that were awarded to Jahan Tavakkoli and Michael Kolios. Funding to purchase the equipment was provided by the Canada Foundation for Innovation, the Ontario Ministry of Research and Innovation, and the Ryerson University and the Canada Research Chairs Program. The authors alone are responsible for the content and writing of the paper.
References
- Field SB, Hand JW. An Introduction to the Practical Aspects of Clinical Hyperthermia. London: Taylor and Francis, 1990
- Koning GA, Eggermont AMM, Lindner LH, ten Hagen TLM. Hyperthermia and thermosensitive liposomes for improved delivery of chemotherapeutic drugs to solid tumors. Pharm Res 2010;27:1750–4
- Ernsting MJ, Worthington A, May JP, Tagami T, Kolios MC, Li SD. Ultrasound drug targeting to tumors with thermosensitive liposomes. Proc IEEE Int Ultrason Symp 2011;2011:1–4
- May JP, Li SD. Hyperthermia-induced drug targeting. Expert Opin Drug Deliv 2013;10:511–27
- ter Haar GR. Therapeutic applications of ultrasound. Prog Biophys Mol Biol 2007;93:111–29
- Kennedy JE. High intensity focused ultrasound in the treatment of solid tumours. Nat Rev Cancer 2005;5:321–7
- Rieke V, Pauly KB. MR thermometry. J Magn Reson Imaging 2008;27:376–90
- Hesley GK, Gorny KR, Woodrum DA. MR-guided focused ultrasound for the treatment of uterine fibroids. Cardiovasc Intervent Radiol 2013;36:5–13
- Kim YS, Keserci B, Partanen A, Rhim H, Lim HK, Park MJ, et al. Volumetric MR-HIFU ablation of uterine fibroids: Role of treatment cell size in the improvement of energy efficiency. Eur J Radiol 2012;81:3652–9
- Simon C, VanBaren P, Ebbini ES. Two-dimensional temperature estimation using diagnostic ultrasound. IEEE Trans Ultrason Ferroelectr Freq Control 1998;45:1088–99
- Damianou CA, Sanghvi NT, Fry FJ, Maassmoreno R. Dependence of ultrasonic attenuation and absorption in dog soft tissues on temperature and thermal dose. J Acoust Soc Am 1997;102:628–34
- Arthur RM, Straube WL, Trobaugh JW, Moros EG. Noninvasive estimation of hyperthermia temperatures with ultrasound. Int J Hyperthermia 2005;21:589–600
- Miller NR, Bamber JC, Meaney PM. Fundamental limitations of noninvasive temperature imaging by means of ultrasound echo strain estimation. Ultrasound Med Biol 2002;28:1319–33
- Liu D, Jiang J, Bischof J, Ballard J, Ebbini ES. Real-time monitoring of thermal and mechanical response to sub-therapeutic HIFU beams in vivo. Proc IEEE Int Ultrason Symp 2010;2010:2254–7
- Sehgal CM, Brown GM, Bahn RC, Greenleaf JF. Measurement and use of acoustic nonlinearity and sound speed to estimate composition of excised liver. Ultrasound Med Biol 1986;12:865–74
- Sehgal CM, Bahn RC, Greenleaf JF. Measurement of the acoustic nonlinearity parameter B/A in human tissues by a thermodynamic method. J Acoust Soc Am 1984;76:1023–9
- Liu X, Gong X, Yin C, Li J, Zhang D. Noninvasive estimation of temperature elevations in biological tissues using acoustic nonlinearity parameter imaging. Ultrasound Med Biol 2008;34:414–24
- van Dongen KWA, Verweij MD. A feasibility study for noninvasive thermometry using non-linear ultrasound. Int J Hyperthermia 2011;27:612–24
- Hamilton MF, Blackstock DT. Nonlinear Acoustics. San Diego, CA: Academic Press, 1998
- Ingle V, Proakis J. Digital Signal Processing Using MATLAB. Stamford, CA: Cengage Learning, 2011
- Arthur RM, Straube WL, Moros G. In vivo change in ultrasonic backscattered energy with temperature in motion-compensated images. Int J Hyperthermia 2008;24:389–98
- Bamber JC, Hill CR. Ultrasonic attenuation and propagation speed in mammalian tissue as a function of temperature. Ultrasound Med Biol 1979;5:149–57
- Gammell PM, Le Croissette DH, Heyser RC. Temperature and frequency dependence of ultrasonic attenuation in selected tissues. Ultrasound Med Biol 1979;5:269–77
- Ghoshal G, Luchies AC, Blue JP, Oelze ML. Temperature dependent ultrasonic characterization of biological media. J Acoust Soc Am 2011;130:2203–11
- Techavipoo U, Varghese T, Chen Q, Stiles TA, Zagzebski JA, Frank GR. Temperature dependence of ultrasonic propagation speed and attenuation in excised canine liver tissue measured using transmitted and reflected pulses. J Acoust Soc Am. 2004;115:2859–65
- Cobbold RSC. Foundation of Biomedical Ultrasound. New York: Oxford University Press, 2007
- Beyer RT. Parameter of nonlinearity in fluids. J Acoust Soc Am 1960;32:719–21
- Parker NG, Povey MJW. Ultrasonic study of the gelation of gelatin: Phase diagram, hysteresis and kinetics. Food Hydrocolloids 2012;26:99–107
- Cook JR, Bouchard RR, Emelianov SY. Tissue-mimicking phantoms for photoacoustic and ultrasonic imaging. Biomed Opt Express 2011;2:3193–206
- Lafon C, Zderic V, Noble ML, Yuen JC, Kaczkowski PJ, Sapozhnikov OA, et al. Gel phantom for use in high-intensity focused ultrasound dosimetry. Ultrasound Med Biol 2005;31:1383–9
- Madsen EL, Zagzebski JA, Banjavie RA, Jutila RE. Tissue mimicking materials for ultrasound phantoms. Med Phys 1978;5:391–4
- Techavipoo U, Varghese T, Zagzebski JA, Stiles T, Frank G. Tissue temperature dependence of ultrasonic propagation speed and attenuation in canine tissue. Ultrason Imaging 2002;24:246–60
- Liu HL, Lin WL, Chen YY. A fast and conformal heating scheme for producing large thermal lesions using a 2D ultrasound phased array. Int J Hyperthermia 2007;23:69–82
- Dewey WC. Arrhenius relationships from the molecule and cell to the clinic. Int J Hyperthermia 2009;25:3–20