
Abstract
Purpose: Radiofrequency ablation (RFA) is currently restricted to the treatment of target tissues with a small size (<3 cm in diameter). To overcome this problem with RFA, some phenomena need to be understood first. The study presented in this paper investigated the relationship between the area of target tissue necrosis (TTN) and the size of target tissue in pulsed radiofrequency ablation (PRFA). Materials and methods: Liver tumour, one of the common targets of RFA in clinical practice, was used as the target tissue in this study. Two types of pulsed RF power supply methods (half-square and half-sine) and three target tissues with different sizes (25 mm, 30 mm and 35 mm in diameter) were studied using finite element modelling. The finite element model (FEM) was validated by using an in vitro experiment with porcine liver tissue. The first roll-off occurrence or 720 s, whichever occurs first, was chosen as the ablation termination criterion in this study. Results: For each target tissue size, the largest TTN area was obtained using the maximum voltage applied (MVA) without roll-off occurrence. In this study, target tissues with a 25 mm diameter can be ablated cleanly but target tissues with 30-mm and 35-mm failed to be ablated. Conclusions: The half-square PRFA could achieve a larger TTN area than the half-sine PRFA. The MVA decreases with an increase in the target tissue diameter in both the half-square PRFA and the half-sine PRFA. The findings of this study are in agreement with the clinical results that lesions (≥3 cm in diameter) have less favourable results from RFA.
Introduction
Radiofrequency ablation (RFA) is a thermal therapy technique that has been used to eradicate the tumours in the liver and other organs for many years [Citation1,Citation2]. However, this technique has yet to establish good clinical results in the treatment of target tissues ≥3 cm in diameter [Citation3–5]. Zhang et al. [Citation6] evaluated the deficiencies of current commercial RFA systems using an engineering method (axiomatic design theory) and concluded that the incomplete target tissue necrosis (TTN) of RFA for large target tissues is the main reason. Previous studies [Citation7,Citation8] showed that one of the determinant factors causing the incomplete TTN is the tissue charring during the procedure of RFA. The tissue charring occurs when the tissue is heated to a temperature above 100 °C ≥due to water evaporation.
In the RFA technique, alternating electrical currents with high frequency (∼500 kHz) are used to generate heat to kill the target tissues. So this technique is heavily influenced by the impedance of external loads, including the target tissue and healthy surrounding tissue. When tissues get charred the impedance of external loads increases dramatically and this prevents the RF power generator from delivering further energy into the tissue. In the clinical setting, this dramatic increase of impedance, followed by a drop of RF power supply, is called ‘roll-off’. The roll-off is a critical factor during the generation of TTN size in RFA. For more information about the roll-off, the readers may refer to our previous study [Citation9].
To overcome this deficiency with the RFA technique, a better understanding of the change of TTN size prior to the roll-off occurrence is crucial. In our previous study [Citation9], we investigated the relationship between the size of TTN (volume) and the size of target tissue in a constant radiofrequency ablation (CRFA) using a two-compartment finite element modelling approach. We concluded that the largest TTN volume can be achieved at the maximum voltage applied (MVA) without roll-off occurrence and the MVA was different for different sizes of target tissues. Our previous study also confirmed that CRFA was unable to kill liver tumours ≥3 cm in diameter with the mathematical model. Besides constant RF power supply, pulsed RF has also been used as an alternative power supply method in current commercial RFA devices in the pursuit of getting a larger TTN size [Citation10–12]. In the present study we continued our work using a 2D axis symmetric finite element model (FEM) and tried to find a relationship between the size of TTN (area) and the size of the target tissue in the PRFA. Three different sizes of liver tumours with 25, 30 and 35 mm diameter, respectively, were taken as the target tissues. For the pulsed RF power supply method, the half-square and the half-sine methods were used in this study.
The remainder of this paper is as follows. The FEM of PRFA and the TTN area evaluation are discussed next, followed by the presentation of results and discussion. Some conclusions drawn from this study are given in the final section.
Materials and methods
Finite element modelling of PRFA
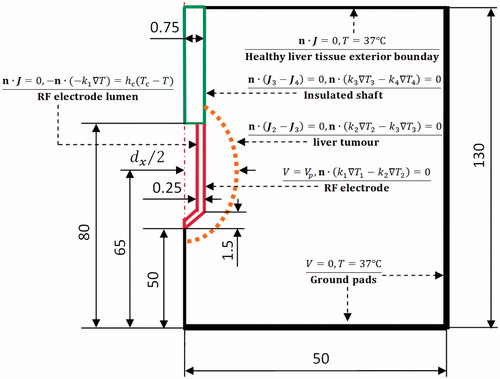
The PRFA process is a coupled thermal-electric problem. The problem was represented as a 2D axis symmetric FEM. The model was created and solved numerically using COMSOL Multiphysics 4.0 software (Burlington, MA). As shown in , a healthy liver tissue was simulated as a cylinder measuring 50 mm in radius and 130 mm in height. An elliptical liver tumour with a 40 mm long axis and a dx (25, 30 and 35 mm) short axis was considered in this FEM. An internally cooled RF applicator (Covidien, Zurich, Switzerland), consisting of a RF electrode and an insulated shaft, was chosen for this liver tumour and created in this 2D axis symmetric PRFA model. The RF applicator with a 1.5 mm diameter and 30 mm exposure length (length of the RF electrode) was inserted into the liver tumour. The centre of the RF electrode was put on the centre of the liver tumour in the pursuit of an optimal RF electrode placement.
Figure 1. 2D axis symmetric RFA model and its boundary conditions used in the present study (out of scale, dimension in mm).
The governing equation for this 2D coupled thermal-electric problem is the Pennes bioheat transfer equation [Citation13] with the heat source generated by the RF electrical current:
(1)
where ρ (kg m−3) is the density, c (J kg−1 K−1) is the specific heat, T (x, t) (°C) is the temperature, x = {r, z} in the 2D axis symmetric coordinate system, Γ denotes the analysed 2D axis symmetric domain, k (W m−1 K−1) is the thermal conductivity, ρb (kg m−3) is the blood density, cb (J kg−1 K−1) is the blood specific heat, ωb (s−1) is the blood perfusion rate, Tb is the temperature of the blood entering the tissue, Qm (x, t) (W m−3) is the volumetric heat power generated by metabolism, which was neglected due to its small magnitude compared with the other terms in Equation (Equation1
(1) ) in this study and Qhs (x, t) (W m−3) is the spatial heat power generated by the RF electrical current.
In RFA, Qhs (x, t) can be calculated by . J (A m−2), E (V m−1) and V (V) are the current density, the electrical field intensity and the applied voltage, respectively. By using the quasi-static approach, the value of applied voltage can be evaluated by
. The properties of all the elements in the RFA model were found from the literature [Citation14–20] and tabulated in .
Table 1. Thermal and electrical properties of the modelling elements used in the present study.
We considered the temperature dependence of the thermal conductivity and the electrical conductivity for both liver tumour and healthy liver tissue. Below 100 °C the thermal conductivity and the electrical conductivity were approximated by Equations (Equation2(2) ) and (Equation3
(3) ), respectively.
(2)
(3)
The thermal conductivity was considered as a constant when the temperature was higher than 100 °C. Between 100 °C and 105 °C, the electrical conductivity decreased rapidly by two orders of magnitude due to water vaporisation and desiccation [Citation21]. Over 105 °C it was considered as a constant, as shown in . The blood perfusion rates in healthy liver tissue and liver tumour were also considered temperature dependent. They are described by Equation (Equation4(4) ) [Citation22].
(4)
Figure 2. Thermal and electrical conductivities of healthy liver tissue and liver tumour used in the present study.
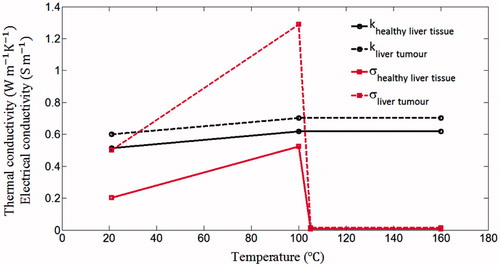
Table 2. Comparisons of TTN areas from the FEM and in vitro experiment.
The initial temperature of the whole FEM was set to 37 °C, which is close to the internal temperature of the human body. A pulsed voltage (Vp) and 0 V were applied on the surface of the RF electrode and ground pads, respectively. The inner side of the RF electrode lumen and the healthy liver tissue exterior boundary were set as electrical insulation. All other interfaces inside the liver tissue were taken as continuity boundary condition, as shown in . The cooling effect of the RF electrode was approximated by using Newton’s law of cooling using the thermal convection coefficient (hc) and the cooling temperature (Tc). The hc = 3366 (W m−2 K−1) was calculated by considering the 30-mm RF electrode and an half of the cross section area of the RF electrode lumen [Citation23]. The flow rate of the cooling water was considered as 45 mL min−1. Note that a previous study [Citation24] suggested that the cooling temperature has no significant effect on the TTN size. However, we still set the cooling temperature to be 10 °C (because it is used in many clinical settings and computational models [Citation14,Citation23,Citation25]).
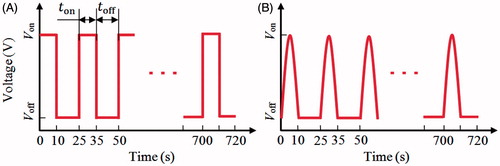
In the present study, two types of the pulsed voltages (half-square and half-sine) were taken as the RF power supply methods, as shown in . Note that the half-square pulsed voltage is used in the current commercial RFA systems [Citation11]; the half-sine pulsed voltage was investigated by some researchers [Citation12] and they concluded that the half-sine pulsed voltage method had achieved a relatively large TTN size compared with the half-square method in animal tissue experiments [Citation12]. For the pulsed RF power supply method, four parameters such as Von, Voff, ton and toff need to be determined. Von is the applied voltage which is used to generate the heat; Voff is the cooling voltage, which should be small enough so that only negligible heat can be generated; ton is the heating period during which the Von applied; toff is the cooling period. To get close to the real clinical setting in the computer simulation, 10 and 15 s in a pulse circle were used for ton and toff, respectively [Citation10,Citation11].
Figure 3. Two pulsed RF power supply methods: (A) half-square waveform and (B) half-sine waveform.
A sensitive study was performed to determine the value of Voff. We evaluated the maximum temperature at 720 s using a fixed Von (30 V) and a decreasing Voff. When the difference of the maximum temperature between the two Voff s was less than 0.1 °C, the previous value of Voff was chosen. In this study, the value of Voff was found as 4 V. In order to avoid the boundary effects, the same sensitive analysis was also done for the dimension of healthy liver tissue. Three pairs of dimensions, such as (50 mm, 130 mm), (60 mm, 180 mm) and (80 mm, 200 mm), were examined. The differences of the maximum temperatures between these three dimensions were all less than 0.1 °C, so the smallest size of healthy liver tissue was used in this study for saving computational cost.
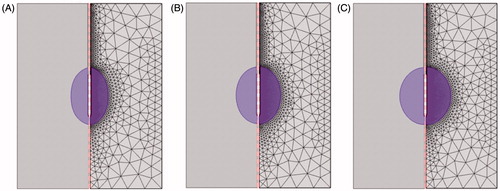
The convergence tests of the meshing were done using the Von = 30 V, Voff = 4 V and 0.1 °C temperature difference. The whole research domain was divided into triangular elements, as shown in . A fine mesh was set in the region of interest to include the RF electrode domain and the liver tumour domain, where higher temperature gradients were expected. until the convergence test was satisfied. For the target tissue with 25 mm, 30 mm and 35 mm in diameter, there were 3878 4164 and 4477 triangular elements in the FEM, respectively.
Figure 4. Finite element models and their mesh modes used in the present study for three sizes of target tissues: (A) 25 mm, (B) 30 mm and (C) 35 mm.
TTN area evaluation
There were several methods used to evaluate the TTN in the previous literature, such as the temperature threshold, the Arrhenius model and the cumulative equivalent minutes at 43 °C. The Arrhenius model was used to evaluate the TTN size in this study, which can be given as follows:
(5)
where Ω (t) is the degree of tissue death, A(s−1) is the frequency factor, ΔE (J mol−1) is the activation energy for the irreversible damage reaction, R (J mol−1 K−1) is the universal gas constant and T (τ) (K) is the absolute temperature. In this study, A = 7.390 × 1039 (s−1) and ΔE = 2.577 × 10⁵ (J mol−1) were found from the literature [Citation26] for healthy liver tissue. For the liver tumour, A = 3.247 × 1043 (s−1) and ΔE = 2.814 × 10⁵ (J mol−1) were found from the literature [Citation27]. The tissue was considered dead, if the value of Ω (t) = 1, which corresponds to 63% probability of tissue cell death [Citation28].
As discussed before in the introduction, this study focused on the change of the TTN area prior to the first roll-off occurrence or at 720 s, whichever occurred first. Trujillo et al. [Citation23] concluded that the roll-off usually happens at the moment when the RF electrode is encircled by charred tissue (tissue above 100 °C). In this study we stopped the ablation procedure using the first roll-off occurrence as a criterion. The TTN area was evaluated by summation of the areas of all triangular elements in the liver tumour domain and healthy liver tissue domain that had Ω (t) = 1 on all nodes.
The in vitro experiment for validation of the FEM
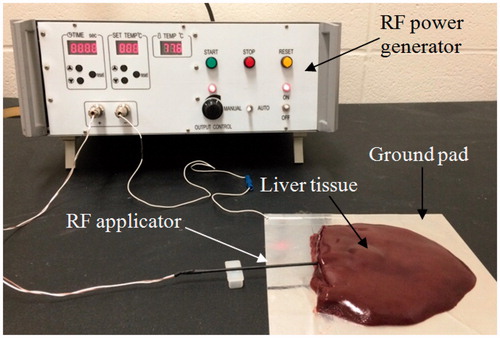
To validate the accuracy of the FEM used in the present study, an in vitro experiment with porcine liver tissue was performed. The in vitro experiment followed the regulation of the Biosafety Permit Protocol of the University of Saskatchewan for handling tissues. A custom-made RFA system with 50-W maximum power (450 kHz) and a non-cooling RF electrode with 1.98 mm diameter and 30 mm of exposure length were used in the experiment. The porcine liver tissues were acquired from a local grocery store. Before the experiment, all the porcine liver tissues were heated to an ambient temperature of 21 °C (room temperature). shows the experimental set up. The liver tissue was put on aluminium foil (190 × 210 mm) acting as the ground pad. The electrode was inserted into the liver tissue with an insertion depth of about 50 mm. The distance between the ground pad and the RF electrode was set to about 20 mm to avoid the situation where the TTN grows towards the ground pad. Two ablation operations with durations of 360 s and 720 s, respectively, and with 30 V (CRFA) of applied voltage were performed on the tissue. We used a total of 10 pieces of porcine liver tissues (n = 5 for each ablation time) and the size of each tissue was kept at least 80 × 60 × 40 mm. The initial temperature and blood perfusion rate in the FEM were set to be 21 °C and 0, respectively, for consistency with the in vitro experiment.
Figure 5. In vitro experimental set-up for the validation of the FEM.
Results
Experimental results for validation of the FEM
shows the computational and experimental results at 360 s and 720 s, respectively. The size of TTN in the in vitro experiment was determined by visual examination. As shown in , an elliptical TTN area (‘pale zone’) can be found. The size of TTN in the FEM was determined by the Arrhenius model (Ω (t) = 1), discussed in the section on evaluation of the TTN area.
Figure 6. Computational and experimental results for two ablation operations: (A) 360 s, (B) 720 s.
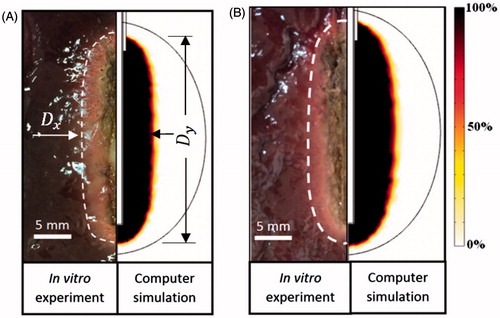
As shown in , good agreement on TTN area between the FEM and the in vitro experiment can be found, regardless of the ablation duration. The results of Dx and Dy, obtained from FEM, show that they are all located in the corresponding error bars of the results, obtained from the in vitro experiments. There are only acceptable discrepancies on TTN areas between the in vitro experiment and FEM at both 360 s and 720 s ablation durations (9.3% and 8.0%, respectively). These discrepancies may come from two reasons: 1) not all the sliced liver tissues were the same size, and 2) underestimation of TTN size in the in vitro experiment using the pale zone method. A narrow zone (sub-lethal damage zone or haemorrhagic rim) around the central pale zone, where the tissue cells are dead but the proteins are not denatured completely to become whitish, can be revealed by the triphenyl tetrazolium chloride (TTC) staining technique. The comparison shows that the FEM has enough accuracy to be used as a test-bed.
Computational results for analysis of the pulsed RFA
Two types of pulsed RF power supply methods (half-square and half-sine) and three different sizes of target tissues (dx = 25, 30 and 35 mm) were then examined on the FEM in this study. Twenty-four PRFA protocols were simulated with the FEM. All the TTN areas were evaluated at the time when the first roll-off occurred or at 720 s, whichever occurred first. For instance, a RFA protocol like 47.2 V–720 s for the 25-mm target tissue meant that the applied voltage (Von) was 47.2 V and the TTN area was found at 720 s, because in this PRFA protocol there was no roll-off occurring, as shown in .
Figure 7. 100 °C isotherm and temperature distribution of the scenario of 47.2 V-720 s at 50 s (A), 442 s (B) and 720 s (C) and the change of the impedance (D).
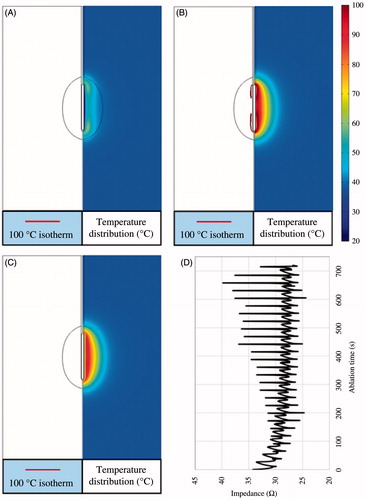
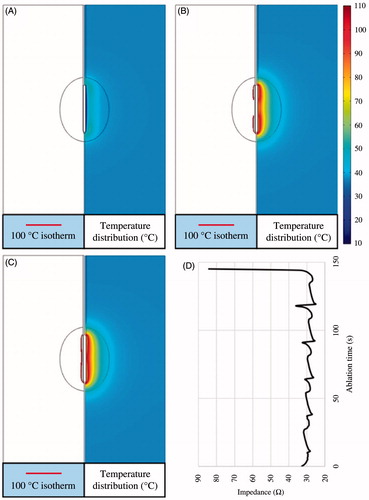
shows the change of the 100 °C isotherm and the temperature distributions. The impedance between the RF electrode and the ground pads during the whole ablation process was less than a critical value (roll-off occurred at this value), as shown in . In the present study, the critical impedance value was about 45 Ω (not shown in this paper) according to our initial work for this study. shows another PRFA protocol (48 V–145 s) in which the Von was 48 V and the first roll-off occurred at 145 s. The RF electrode was encircled completely by 100 °C isotherm at 145 s when the impedance dramatically increased to about 85 Ω, as shown in .
Figure 8. 100 °C isotherm and temperature distribution of the scenario of 48 V-145 s at 25 s (A), 118 s (B) and 145 s (C) and the change of the impedance (D).
shows the 24 computational results for three different sizes of target tissues using the half-square and the half-sine PRFA. In this study, two dimensional parameters (Dx and Dy) and TTN area () were used to evaluate the PRFA protocols. Dx and Dy mean the longest length of the short and the long axis of TTN area, respectively, as shown in . Similar to the results of our previous study [Citation9], the largest TTN area was found at a particular voltage for each size of target tissue in both the half-square and the half-sine PRFA, as shown in . This voltage was the MVA without the roll-off occurrence. The MVA was found using the trial and error method and the accuracy was about 0.1 V, which was used in our previous study [Citation9].
Figure 9. Computational results of TTN areas for target tissues with different sizes: (A) dx = 25 mm, (B) dx = 30 mm and (C) dx = 35 mm.
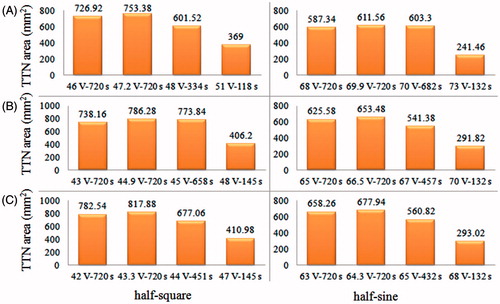
Table 3. The computational results of TTN area for all PRFA protocols in the present study.
We also found that the MVA for the half-square PRFA was lower than that for the half-sine PRFA for all three sizes of target tissues. The reason for this phenomenon can be explained in the following. In the situation of using the same Von, the half-square PRFA has more energy than the half-sine PRFA in a pulse period (ton + toff) due to the different waveforms. Thus, for the half-sine PRFA, a higher Von was needed to generate the same amount of TTN area with the half-square PRFA. Another salient finding in the present study is that the half-square PRFA achieved a higher TTN area than the half-sine PRFA. It is worth mentioning that this result contradicts the results found in the work of Lim et al. [Citation12]. In their work, the half-sine PRFA had a slightly better performance on the TTN size than the half-square PRFA for Dx (8.2 versus 8.0 mm), while for Dy the two PRFAs had the same results. The different results between the literature [Citation12] and the present study may be due to the following reasons: 1) they did not consider the liver tumour tissue in their model, and 2) their results were achieved using the same root mean square value (25 V) of the half-square and the half-sine waveforms rather than the first roll-off occurrence. We believe that the two treatments in their work appear inadequate, and as such, our PRFA model was closer to the real clinical setting.
Discussion
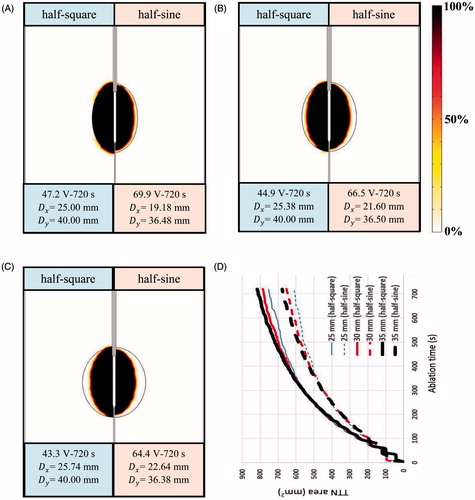
shows the computational results of tissue death using D63 criteria [Citation28] for the 25-mm, 30-mm and 35-mm target tissues. Tissue death was evaluated using MVA, at which the largest TTN area was able to be achieved for each size of target tissue. As shown in , only a 25-mm target tissue can be killed cleanly using the half-square PRFA. shows the differences in the TTN area for three sizes of target tissues using the half-square PRFA and the half-sine PRFA. It is interesting to note that the differences in the TTN area were almost the same for the three sizes of target tissues before about 360 s. After that time, the larger the target tissue is, the larger the TTN area. This phenomenon was found in both the half-square PRFA and the half-sine PRFA methods. We speculated the reason for this phenomenon as follows. The target tissue is more sensitive to the thermal therapy due to its higher electrical conductivity and lower blood perfusion rate. The larger the target tissue is, the higher the sensitivity. After the critical time (about 360 s in the study), the differences in the sensitivities of the target tissues were getting larger and larger due to the higher temperature. So the larger TTN area can be obtained in the target tissue with the larger size. Further work is necessary to study this phenomenon.
Figure 10. Target tissue death rate (%) (D63) at its own MVA: (A) dx = 25 mm, (B) dx = 30 mm and (C) dx = 35 mm and the changes of the TTN areas (D).
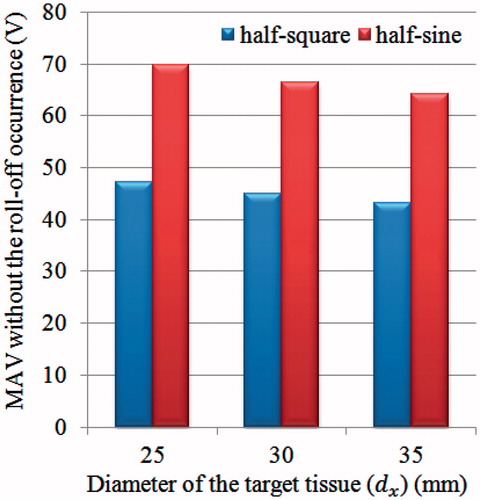
MVA without the roll-off occurrence decreased with an increase in the target tissue size for the half-square PRFA and the half-sine PRFA, as shown in . For a whole research domain (healthy liver tissue and liver tumour), the impedance (R) was the equivalent value of the impedance of healthy liver tissue (Rhlt) and the impedance of liver tumour (Rlt) in series, namely, R = Rhlt + Rlt. As such, the larger the liver tumour, the smaller the impedance (R), as the liver tumour has a higher electrical conductivity than healthy liver tissue [Citation15,Citation29]. According to P = U2/R, when the R is small, the voltage (U) we need is also small because the power (P) needed for getting TTN is a constant.
Figure 11. MVA without the roll-off occurrence for each size of target tissue in the present study.
In the current commercial PRFA device, the algorithm of RF power is related to the change of impedance. Another algorithm for power supply can be such that a constant RF power is usually used until the first roll-off occurs. Then, the algorithm is changed to the pulsed RF power because the PRFA is able to deliver more power to the target tissue even after the roll-off occurrence. The reason behind this is that PRFA has a cooling period (toff) for heat dissipation from the area in the proximity of the RF electrode, which can relieve the roll-off. Although a relatively large TTN size can be obtained using PRFA compared with the CRFA, the TTN size is still small and PRFA is not efficient enough on the large target tissues. It is worth noting that unlike other studies [Citation10,Citation30], a relatively large TTN area was not achieved using the PRFA in this study because of the different ablation termination criteria. We mainly focused on the ablation duration before the first roll-off occurrence for different sizes of target tissues as discussed above. The reason for choosing this ablation termination is that we believe that the growth of TTN before the first roll-off is worth investigating such that an optimal PRFA algorithm in a roll-off for the large TTN area can be achieved. Using the optimal algorithm within several roll-offs, a further large TTN area is expected to be achieved.
There are some limitations in the present study. One of them is the approximation of the blood perfusion model. There were some debates on how to model the blood perfusion of the liver tissue in the computational work. Most studies have considered blood perfusion as a constant [Citation6,Citation31,Citation32] or a piecewise function [Citation9,Citation22,Citation33,Citation34]. Some researchers [Citation35] obtained a good agreement with the in vivo animal experiments when using the foregoing constant method. However, It is worth mentioning that Schutt and Haemmerich [Citation36] had concluded that there were significant effects on TTN size using different blood perfusion models. They used the piecewise model, a linear decreasing model, and a non-linear decreasing model. In the non-linear decreasing model they considered an increase of blood perfusion with an increase of degree of vascular stasis at the ablation zone boundary due to the hyperaemia. Similarly, a dynamic model of blood perfusion rate with the temperature and damaged tissue was used in the work of Bourantas et al. [Citation37]. In their model, blood perfusion was taken as a product of constitutive perfusion rate and a dimensionless function that accounts for vessel dilation at slightly elevated temperatures [Citation38]. In the present study a piecewise function model of vascular coagulation was used. In particular, the perfusion rate was considered as a constant before the biological tissue reached a temperature of 60 °C; at temperatures higher than 60 °C, the blood perfusion rate was set to 0, because coagulation eliminated microvascular perfusion [Citation22].
Although the computer model was used to achieve the data for various PRFA protocols, to make the findings of the present study more reliable, experiments with liver tumour or tumour tissue phantom are necessary in future studies. Furthermore, we also acknowledge that large adjacent blood vessels ≥3 mm in diameter around the target tissue can be another reason for the small size of TTN, namely the ‘heat-sink effect’. We did not consider this heat-sink effect in our model, because we wanted to avoid the impacts of other factors in the present study. Certainly, a more sophisticated model considering the heat-sink effect is needed for future study.
Conclusions
Two types of pulsed RF power supply methods and three target tissues of different sizes were studied using finite element modelling to find the relationship between the size of target tissue and the area of TTN in the PRFA. Four conclusions can be drawn from this study:
The largest TTN area can be achieved using the MVA without the roll-off occurrence. For 25 mm, 30 mm and 35 mm target tissues, the largest TTN areas are 753.38 mm2, 786.28 mm2 and 817.88 mm2, respectively, using half-square PRFA, and 611.56 mm2, 653.48 mm2 and 677.94 mm2, respectively, while using half-sine PRFA.
Target tissues (liver tumours) 30 mm and 35 mm in diameter cannot be ablated cleanly if using the first roll-off occurrence as the ablation termination criteria.
The half-square PRFA achieves a greater TTN area than the half-sine PRFA.
The MVA decreases with an increase in the target tissue diameter in both the half-square PRFA and the half-sine PRFA methods.
Acknowledgements
This article was supported by the Saskatchewan Health Research Foundation (SHRF) through the ‘BioNEMS Phase I’ grant (grant no. 2539) and the National Natural Science of China (grant no. 51175179). The first author (Bing Zhang) also received financial support from the China Scholarship Council (CSC).
Declaration of interest
The authors report no conflicts of interest. The authors alone are responsible for the content and writing of the article.
References
- Zhang B, Moser M, Zhang E, Zhang W. Radiofrequency ablation technique in the treatment of liver tumours: Review and future issues. J Med Eng Technol 2013;37:150–9
- Nishikawa H, Kimura T, Kita R, Osaki Y. Radiofrequency ablation for hepatocellular carcinoma. Int J Hyperthermia 2013;29:558–68
- Xu H-X, Lu M-D, Xie X-Y, Yin XY, Kuang M, Chen JW, et al. Prognostic factors for long-term outcome after percutaneous thermal ablation for hepatocellular carcinoma: A survival analysis of 137 consecutive patients. Clin Radiol 2005;60:1018–25
- Shiina S, Tateishi R, Arano T, Uchino K, Enooku K, Nakagawa H, et al. Radiofrequency ablation for hepatocellular carcinoma: 10-year outcome and prognostic factors. Am J Gastroenterol 2011;107:569–77
- Llovet JM, Bruix J. Novel advancements in the management of hepatocellular carcinoma in 2008. J Hepatol 2008;48:S20–37
- Zhang B, Moser MA, Luo Y, Zhang EM, Zhang W. Evaluation of the current radiofrequency ablation systems using axiomatic design theory. Proc Inst Mech Eng H 2014;228:397–408
- Brace CL. Radiofrequency and microwave ablation of the liver, lung, kidney, and bone: What are the differences? Curr Probl Diagn Radiol 2009;38:135–43
- Ahmed M, Brace CL, Lee FT, Goldberg SN. Principles of and advances in percutaneous ablation. Radiology 2011;258:351–69
- Zhang B, Moser MA, Zhang EM, Luo Y, Zhang H, Zhang W. Study of the relationship between the target tissue necrosis volume and the target tissue size in liver tumours using two-compartment finite element RFA modelling. Int J Hyperthermia 2014;30:593–602
- Goldberg SN, Stein MC, Gazelle GS, Sheiman RG, Kruskal JB, Clouse ME. Percutaneous radiofrequency tissue ablation: Optimization of pulsed-radiofrequency technique to increase coagulation necrosis. J Vasc Interv Radiol 1999;10:907–16
- Solazzo SA, Ahmed M, Liu Z, Hines-Peralta AU, Goldberg SN. High-power generator for radiofrequency ablation: Larger electrodes and pulsing algorithms in bovine ex vivo and porcine in vivo settings. Radiology 2007;242:743–50
- Lim D, Namgung B, Woo DG, Choi JS, Kim HS, Tack GR. Effect of input waveform pattern and large blood vessel existence on destruction of liver tumor using radiofrequency ablation: Finite element analysis. J Biomech Eng 2010;132:061003
- Pennes HH. Analysis of tissue and arterial blood temperatures in the resting human forearm. J Appl Physiol 1948;1:93–122
- Haemmerich D, Schutt DJ. RF ablation at low frequencies for targeted tumor heating: In vitro and computational modeling results. IEEE Trans Biomed Eng 2011;58:404–10
- Haemmerich D, Schutt DJ, Wright AW, Webster JG, Mahvi DM. Electrical conductivity measurement of excised human metastatic liver tumours before and after thermal ablation. Physiol Meas 2009;30:459–66
- Tungjitkusolmun S, Staelin ST, Haemmerich D, Tsai JZ, Webster JG, Lee FT, et al. Three-dimensional finite-element analyses for radio-frequency hepatic tumor ablation. IEEE Trans Biomed Eng 2002;49:3–9
- González-Suárez A, Trujillo M, Burdío F, Andaluz A, Berjano E. Feasibility study of an internally cooled bipolar applicator for RF coagulation of hepatic tissue: Experimental and computational study. Int J Hyperthermia 2012;28:663–73
- Van Beers BE, Leconte I, Materne R, Smith AM, Jamart J, Horsmans Y. Hepatic perfusion parameters in chronic liver disease: Dynamic CT measurements correlated with disease severity. Am J Roentgenol 2001;176:667–73
- Zorbas G, Samaras T. Parametric study of radiofrequency ablation in the clinical practice with the use of two-compartment numerical models. Electromagn Biol Med 2013;32:236–43
- Sahani DV, Holalkere N-S, Mueller PR, Zhu AX. Advanced hepatocellular carcinoma: CT perfusion of liver and tumor tissue – initial experience. Radiology 2007;243:736–43
- Jo B, Aksan A. Prediction of the extent of thermal damage in the cornea during conductive keratoplasty. J Therm Biol 2010;35:167–74
- Liu Z, Ahmed M, Sabir A, Humphries S, Goldberg SN. Computer modeling of the effect of perfusion on heating patterns in radiofrequency tumor ablation. Int J Hyperthermia 2007;23:49–58
- Trujillo M, Alba J, Berjano E. Relationship between roll-off occurrence and spatial distribution of dehydrated tissue during RF ablation with cooled electrodes. Int J Hyperthermia 2012;28:62–8
- Haemmerich D, Chachati L, Wright AW, Mahvi DM, Lee Jr FT, Webster JG. Hepatic radiofrequency ablation with internally cooled probes: Effect of coolant temperature on lesion size. IEEE Trans Biomed Eng 2003;50:493–500
- Ahmed M, Liu Z, Humphries S, Nahum Goldberg S. Computer modeling of the combined effects of perfusion, electrical conductivity, and thermal conductivity on tissue heating patterns in radiofrequency tumor ablation. Int J Hyperthermia 2008;24:577–88
- Kim B-M, Jacques SL, Rastegar S, Thomsen S, Motamedi M. Nonlinear finite-element analysis of the role of dynamic changes in blood perfusion and optical properties in laser coagulation of tissue. IEEE J Select Topics Quantum Electron 1996;2:922–33
- Reddy G, Dreher MR, Rossmann C, Wood BJ, Haemmerich D. Cytotoxicity of hepatocellular carcinoma cells to hyperthermic and ablative temperature exposures: in vitro studies and mathematical modelling. Int J Hyperthermia 2013;29:318–23
- Chang IA, Nguyen UD. Thermal modeling of lesion growth with radiofrequency ablation devices. Biomed Eng Online 2004;3:27
- Laufer S, Ivorra A, Reuter VE, Rubinsky B, Solomon SB. Electrical impedance characterization of normal and cancerous human hepatic tissue. Physiol Meas 2010;31:995–1009
- Solbiati L, Livraghi T, Goldberg SN, Ierace T, Melone F, Dellanoce M, et al. Percutaneous radio-frequency ablation of hepatic metastases from colorectal cancer: Long-term results in 117 patients. Radiology 2001;221:159–66
- Arena CB, Mahajan RL, Rylander MN, Davalos RV. Towards the development of latent heat storage electrodes for electroporation-based therapies. Appl Phys Lett 2012;101:083902
- Karampatzakis A, Kühn S, Tsanidis G, Neufeld E, Samaras T, Kuster N. Antenna design and tissue parameters considerations for an improved modelling of microwave ablation in the liver. Phys Med Biol 2013;58:3191–206
- Zhu Q, Shen Y, Zhang A, Xu LX. Numerical study of the influence of water evaporation on radiofrequency ablation. Biomed Eng Online 2013;12:127
- Chen X, Saidel GM. Mathematical modeling of thermal ablation in tissue surrounding a large vessel. J Biomech Eng 2009;131:011001
- González-Suárez A, Trujillo M, Burdío F, Andaluz A, Berjano E. Could the heat sink effect of blood flow inside large vessels protect the vessel wall from thermal damage during RF-assisted surgical resection? Med Phys 2014;41:083301
- Schutt DJ, Haemmerich D. Effects of variation in perfusion rates and of perfusion models in computational models of radio frequency tumor ablation. Med Phys 2008;35:3462–70
- Bourantas GC, Ghommem M, Kagadis GC, Katsanos K, Loukopoulos VC, Burganos VN, Nikiforidis GC. Real-time ablation simulation based on the dynamic mode decomposition method. Med Phys 2014;41:053301
- London RA, Glinsky ME, Zimmerman GB, Bailey DS, Eder DC, Jacques SL. Laser-tissue interaction modeling with LATIS. Appl Opt 1997;36:9068–74