
Abstract
In hyperthermia, focusing heat generation on tumour tissues and precisely monitoring the temperature around the tumour region is important. To focus heat generation in radiofrequency (RF) capacitive heating, magnetic nanoparticles suspended in sodium carboxymethyl cellulose (CMC) solution were used, based on the hypothesis that the nanoparticle suspension would elevate electrical conductivity and RF current density at the nanoparticle-populated region. A tissue-mimicking phantom with compartments with and without nanoparticles was made for RF capacitive heating experiments. An FDTD model of the phantom was developed to simulate temperature increases at the phantom. To monitor temperature inside the phantom, MR thermometry was performed intermittently during RF heating inside a 3Tesla MRI magnet bore. FDTD simulation on the phantom model was performed in two steps: electromagnetic simulation to compute specific absorption rate and thermal simulation to compute temperature changes. Experimental temperature maps were similar to simulated temperature maps, demonstrating that nanoparticle-populated regions drew more heat than background regions. Nanoparticle-mediated RF heating could mitigate concerns about normal tissue death during RF capacitive hyperthermia.
Introduction
Although heat can have lethal effects on some types of cancer cells, hyperthermia has not been widely adopted by mainstream medicine as a cancer therapy [Citation1]. The main reasons hyperthermia is not adopted for cancer therapy are inaccurate localisation of heat transfer to cancer tissues, which potentially causes death of surrounding normal tissues, and difficulty in monitoring tissue temperature during the hyperthermia procedure. However, reports on the efficacy of hyperthermia combined with radiation therapy or chemotherapy for cancer treatment supports the need to develop hyperthermia for wider clinical application while fulfilling strict requirements [Citation2–6].
There are many types of hyperthermia that use different energy sources such as radiofrequency (RF) waves, microwaves, and ultrasound waves. RF capacitive hyperthermia uses two external electrodes positioned at opposite sides of the tumour region to send RF current to the tumour for Joule heating [Citation1]. RF capacitive hyperthermia is based on the finding that some tumour tissues are more prone to death by Joule heating than normal background tissues because of slow blood supply to tumour tissues [Citation6,Citation7]. The RF frequency is typically 13.56 MHz, which is freely available for general applications. Localising a heated region within the tumour during RF capacitive hyperthermia is difficult, particularly when the tumour is deeply seated. Therefore, excessive heating of surrounding normal tissues to over 43 °C in RF capacitive hyperthermia is a concern.
To improve the spatial localisation of RF capacitive heating, magnetic nanoparticles have been administered to the tumour region under the hypothesis that the nanoparticle-populated region will receive more heat than the surrounding region [Citation8–12]. Two popular types of nanoparticles, gold and iron oxide, have been used for the RF capacitive hyperthermia [Citation13–18]. The mechanisms of nanoparticle heating by RF irradiation are not fully understood [Citation19–22]. However, the mechanisms of inductive heating of magnetic nanoparticle suspensions, often called magnetic fluid hyperthermia (MFH), are well understood [Citation23]. MFH produces significant heat by applying a high-intensity alternating magnetic field to magnetic nanoparticles with a frequency of a few tens or hundreds of kHz, far lower than the frequency of RF capacitive hyperthermia [Citation24,Citation25]. MFH is now in clinical use in Germany for a brain tumour treatment after completing a clinical test [Citation26], and some preclinical tests of MFH have been performed for treatment of other types of cancers [Citation27,Citation28]. However, to induce sufficient heat in deep-seated tumours using MFH, a high-concentration magnetic nanoparticle suspension must be injected into the tumour region, which makes MRI for temperature monitoring impossible. MFH with low-concentration magnetic nanoparticle suspension may cause inductive heating of normal skin tissues and requires enormous power consumption.
If the poor localisation of heat transfer could be improved, RF capacitive hyperthermia could use MRI to monitor tissue temperature and become a potential cancer therapy modality. Since RF capacitive hyperthermia delivers heat to tumour tissues based on their higher conductivity than background normal tissues, delivering low-concentration magnetic nanoparticle suspension to tumour tissues to elevate electrical conductivity is feasible. Low-concentration magnetic nanoparticle suspension is used in MRI as contrast agents or biomarkers since magnetic nanoparticles generate strong local inhomogeneities of static magnetic fields, modulating image intensities at nanoparticle-populated regions. The mechanisms of conductivity elevation by magnetic nanoparticles are not yet understood. On the other hand, there have been a few reports on heating enhancement by gold nanoparticles in RF capacitive heating [Citation13–15], but no solid conclusions have been drawn about the effects of gold nanoparticles.
In this study, elevation of electrical conductivity by magnetic nanoparticles was experimentally observed, and conductivity elevation was used to improve the spatial localisation of heat transfer in RF capacitive heating. A tissue-mimicking phantom was electromagnetically and thermally modelled to simulate heat generation in RF capacitive hyperthermia. Simulated temperature maps were compared with experimental temperature maps. To experimentally measure temperature increases in the phantom, magnetic resonance (MR) thermometry was performed intermittently during RF capacitive heating.
Materials and methods
The tissue-mimicking phantom
A tissue-mimicking phantom with two compartments mimicking normal background tissue and tumour tissue was made. The base material of the phantom was agarose gel, and a magnetic nanoparticle suspension mixed with salts was added to the tumour-tissue-mimicking compartment. The normal-tissue-mimicking compartment was made of 2.5% agarose gel (Yakuri Pure Chemicals, Kyoto, Japan) and 0.125% CuSO4 solution. The CuSO4 solution was used to control electrical conductivity of the gel. A suspension of agar in CuSO4 was heated until the foam vanished, then cooled slowly. The tumour-tissue-mimicking compartment was made of 2.5% agarose gel, 0.125% CuSO4 solution and Fe3O4 nanoparticle suspension (Magnetite, RND Korea, Korea) with an Fe concentration of 0.4 mmol/L and 4% sodium carboxymethyl cellulose (CMC, Sigma Aldrich, St Louis, MO, USA). The average nanoparticle diameter was 17.5 nm. The mixed agarose gel was heated to 60 °C and stirred for 40 minutes at 60 °C to evenly distribute the nanoparticles and sodium CMC [Citation10], then cooled slowly.
Electrical conductivities of the agarose compartments were measured with an impedance analyser (Solartron 1260, Solartron Analytical, Farnborough, UK) at 1 MHz. Agarose gel has an almost flat conductivity and permittivity at 5–40 MHz [Citation29]. To measure electrical conductivity, samples were taken from the two types of agarose gel and put into acryl cylinders of diameter 18 mm and height 6.5 mm. The top and bottom of the cylinders had copper electrodes for measuring electrical conductivity.
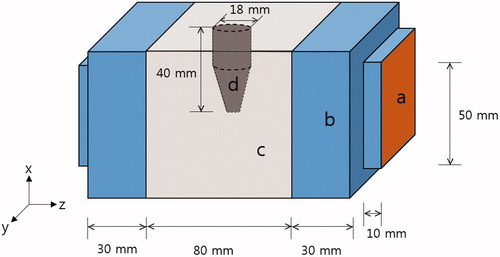
A schematic of the phantom is shown in . The outer acryl frame is excluded for better visualisation. The 10-mm thick outer acryl frame shrouded the phantom body. The main body (c in ) is a cube with 80-mm sides, filled with normal-tissue-mimicking agarose gel. In the mid-plane of the main body, an insert (d in ) of tumour-tissue-mimicking agarose gel was placed as shown in . The insert directly contacted the background gel. On both sides of the main body, 30-mm layers of distilled water (b in ) were placed between the copper electrode (a in ) and the main body. Commercial RF capacitive hyperthermia systems also place a soft insulating layer between the electrode and the skin to secure uniform electric contact and to cool the skin. To keep the distilled water from permeating the main body of the phantom, 0.2-mm PVC films were placed between the distilled water layers and the main body.
Figure 1. Schematic diagram of the phantom. (a) Two copper electrodes, (b) two distilled water layers, (c) normal-tissue-mimicking main body, and (d) tumour-tissue-mimicking insert.
The RF system for phantom heating
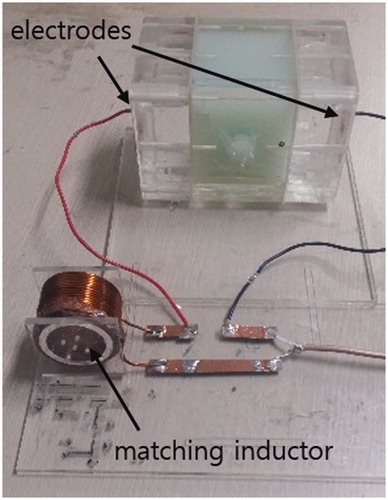
At the RF band, the RF circuit must be matched to the characteristic impedance of 50 Ω for efficient power delivery from the RF power amplifier to the RF circuit. The phantom can be electrically modelled as a parallel circuit of a capacitor and a resistor at the RF band. The resistor represents RF power consumption at the main body and the insert and the capacitor represents RF power storage between the electrodes. For impedance matching of the phantom circuit to 50 Ω, an external inductor was connected in series with the phantom (). For fine impedance matching at specific frequencies, two reactive elements, either inductors or capacitors, are necessary. In this study, a single inductor was used to accommodate the phantom circuit in the birdcage MRI coil, 28 cm in diameter. The frequency was chosen to give the closest match to 50 Ω at an RF band from 10 to 50 MHz. This allowed the phantom to be accommodated in the RF coil with the matching inductor placed at a distance, preventing the matching inductor from magnetically coupling with the RF coil and compromising MR thermometry performance. For fine impedance matching, the external inductance value was adjusted by trial-and-error using a network analyser (Protek A333, GSI, Incheon, Korea). A matching frequency of 36 MHz was used for RF heating experiments inside the 3 Tesla MRI magnet bore. The phantom circuit was driven by a RF power amplifier (AMT 3445, Herley Medical Products, Lancaster, PA, USA) operated in pulsed mode with 15% duty cycle at 200 Hz pulse frequency. The output power of the RF amplifier was 75 W.
Figure 2. Photograph of the tissue-mimicking phantom with a serially connected matching inductor. The inductor was not in the RF coil during RF capacitive heating to avoid interference.
MR thermometry
MR thermometry is based on proton resonance frequency shift (PRFS) in water molecules [Citation30,Citation31], and PRFS has high linearity with and sensitivity to temperature change [Citation32–34].To obtain temperature maps over the phantom during RF capacitive heating, the phantom was placed in the RF coil. The RF coil was a high-pass birdcage coil with an inner diameter of 28 cm and was used for both RF power transmission and MRI signal reception at 3 Tesla. The phantom was placed so the axis of the two electrodes was the z-axis, the direction of the main MRI magnetic field. This minimised shading artefacts from the copper electrodes in the magnetic resonance images.
In MR thermometry based on PRFS, temperature change is computed by:
(1)
where α is the thermal coefficient of proton resonance frequency shift (−0.01 ppm/°C for protons in water molecule), γ is the gyromagnetic ratio of hydrogen (42.58 MHz/T), B0 is the main magnetic field strength, TE is the echo time, and Δφ is the phase shift caused by temperature change. Phase changes in MR images do not solely depend on temperature change. For human imaging, phase changes can be largely decomposed into three parts [Citation35]:
(2)
in which Δφtotal is the total phase difference, ΔφT is the phase difference caused by temperature change,
is the phase error caused by main magnetic field drift, and ΔφS is the phase error caused by susceptibility effects. Susceptibility effects can be introduced by lung volume changes during breathing. This phantom study had no susceptibility effects. Hence, only the B0 drift effect was considered. To correct B0 drift effect, an oil tube of diameter 22 mm was placed near the phantom. The thermal coefficient of the proton resonance frequency of oil molecules is much less than water molecules, so the phase change in the oil segment in MR images solely depended on B0 drift:
(3)
The temperature change after correction for B0 drift was
(4)
The phantom was placed in the MRI shield room 12 h before experiments to equalise to the room temperature of 19 °C. MR thermometry was performed every 10 min during RF heating of the phantom. For MR thermometry, a gradient echo imaging sequence was used with TR/TE 120 ms/10 ms, flip angle 60° and image matrix size 128 × 128 over field of view 220 mm × 220 mm. Scan times for each round of MR thermometry were about 15 s, which was negligible compared to the RF heating time of 60 min. During MR thermometry, RF heating was stopped temporarily to prevent interference between MRI and RF heating. For a temperature reference, a fibre-optic temperature sensor (Opsens, Quebec, Canada) was positioned near the insert in the phantom. Temperatures measured by the fibre-optic sensor and MR thermometry were compared. Experiments were repeated three times to check reproducibility.
Electromagnetic and thermal simulation
Finite-difference-time-domain (FDTD) simulations were performed with an electromagnetic and thermal model of the phantom. The FDTD model () was drawn taking the physical dimensions of the phantom into consideration, including the outer acryl frame. FDTD simulations used a commercial FDTD electromagnetic and thermal solver (SEMCAD X, Speag, Zurich, Switzerland). In electromagnetic simulations, Maxwell equations were solved with an RF voltage source of 36 MHz connected to the electrodes with Yee grid 1 mm. The phantom was placed in the free space and uniaxial perfectly matched layers absorbing boundary conditions (UPML-ABC) were applied to the outer boundary of the free space. Electric field, current density and specific absorption rate (SAR) were computed inside the phantom with the physical and electrical parameters shown in . Temperature dependence of electrical conductivity and permittivity was ignored in the relevant range of temperature increases lower than 10 °C.
Figure 3. FDTD model of the phantom for electromagnetic and thermal simulation. (a) Electrode, (b) distilled water layer, (c) normal-tissue-mimicking background, (d) tumour-tissue-mimicking insert, and (e) outer acryl frame.
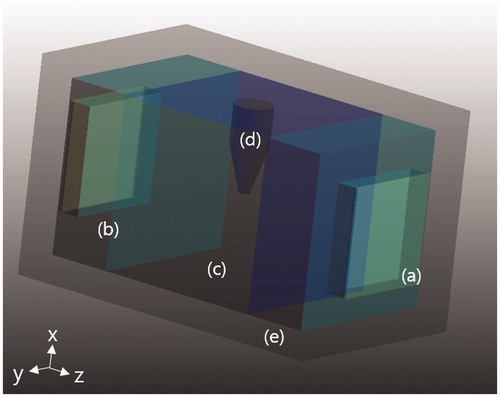
Table 1. Physical parameters for electromagnetic and thermal simulations.
SAR distribution over the phantom was sent to the thermal solver to compute temperature increases using the Pennes bioheat equation [Citation34]. Dirichlet boundary conditions were applied between the phantom body and the distilled water layers to consider the cooling effect of the water layers. Dirichlet boundary conditions were also applied between the outer acryl frame and the free space. The effects of inaccuracy in boundary conditions settings were assumed to be small considering the distance to the region of interest.
shows the electromagnetic and thermal parameters at the two compartments of the phantom model used for electromagnetic and thermal simulations. Except for electrical conductivity, all parameters were set to the same value for the two compartments since both were mainly made of agarose gel of the same composition. Measured values were used for electrical conductivities and other physical quantities were taken from the literature [Citation36,Citation37].
Results
shows the electrical conductivities of agarose gels at 1 MHz and 25 °C by CMC concentration with or without presence of magnetic nanoparticles. Electrical conductivity mostly depended on CMC concentration regardless of presence of magnetic nanoparticles, and magnetic nanoparticles had little effect on conductivity. This implies that CMC in agarose gel plays a major role in elevating electrical conductivity when mixed with magnetic nanoparticle suspension. At the phantom, electrical conductivity was 0.51 S/m for the normal-tissue-mimicking gel and 1.38 S/m for the tumour-tissue-mimicking gel as denoted in . We used these conductivity values for the FDTD phantom model. Temperature sensitivities of the normal-tissue-mimicking agarose and tumour-tissue-mimicking agarose were 0.5%/°C and 1.8%/°C, respectively. Temperature dependency was ignored for temperature increases less than 10 °C.
Table 2. Conductivity of tissue-mimicking agarose at 1 MHz and 25 °C.
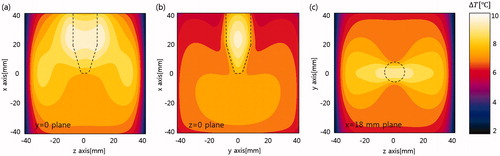
shows simulation results of RF current density and SAR on the y = 0 plane (left) and the z = 0 plane (right). In the simulation, 28 W power was delivered to the phantom from the RF voltage source. In RF current density maps, a higher RF current density was observed at the insert because of its higher conductivity. High current density was also observed in the vicinity of the insert on the y = 0 plane because most currents were normal to the insert surface and followed the law of continuity at the interface. However, lower current density was observed in the vicinity of the insert on the z = 0 plane since most currents were tangential to the insert surface. On the SAR map y = 0 plane, higher SAR was observed in the vicinity of the insert compared to inside the insert because of higher insert conductivity. However, a lower SAR was observed in the vicinity of the insert on the z = 0 plane because of lower current density in the region. Higher conductivity produces less Joule heat per current density. is a map of temperature increases at 30 min of heating on the three orthogonal planes passing through the insert. show lateral-view temperature increases for y = 0 and z = 0 planes; shows an axial-view temperature increase map for the x = 18 mm plane. High temperature increases around and in the insert were observed in the direction of RF current flow. Differences in SAR and temperature rise distributions were due to thermal conduction between the insert and the background substance.
Figure 4. (a, b) Computed RF current density and (c, d) SAR. Left images are on the y = 0 plane and right images are on the z = 0 plane.
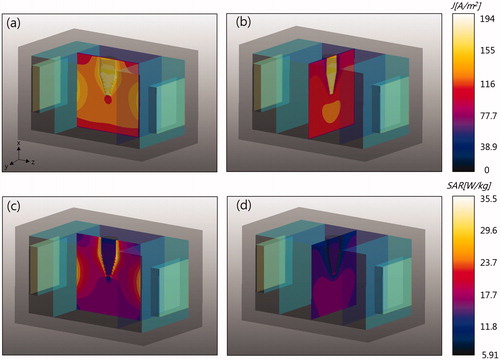
Figure 5. Temperature rise on three orthogonal planes passing through the insert. The dashed lines indicate the insert boundaries. (a) y = 0 plane, (b) z = 0 plane, and (c) x = 18 mm plane.
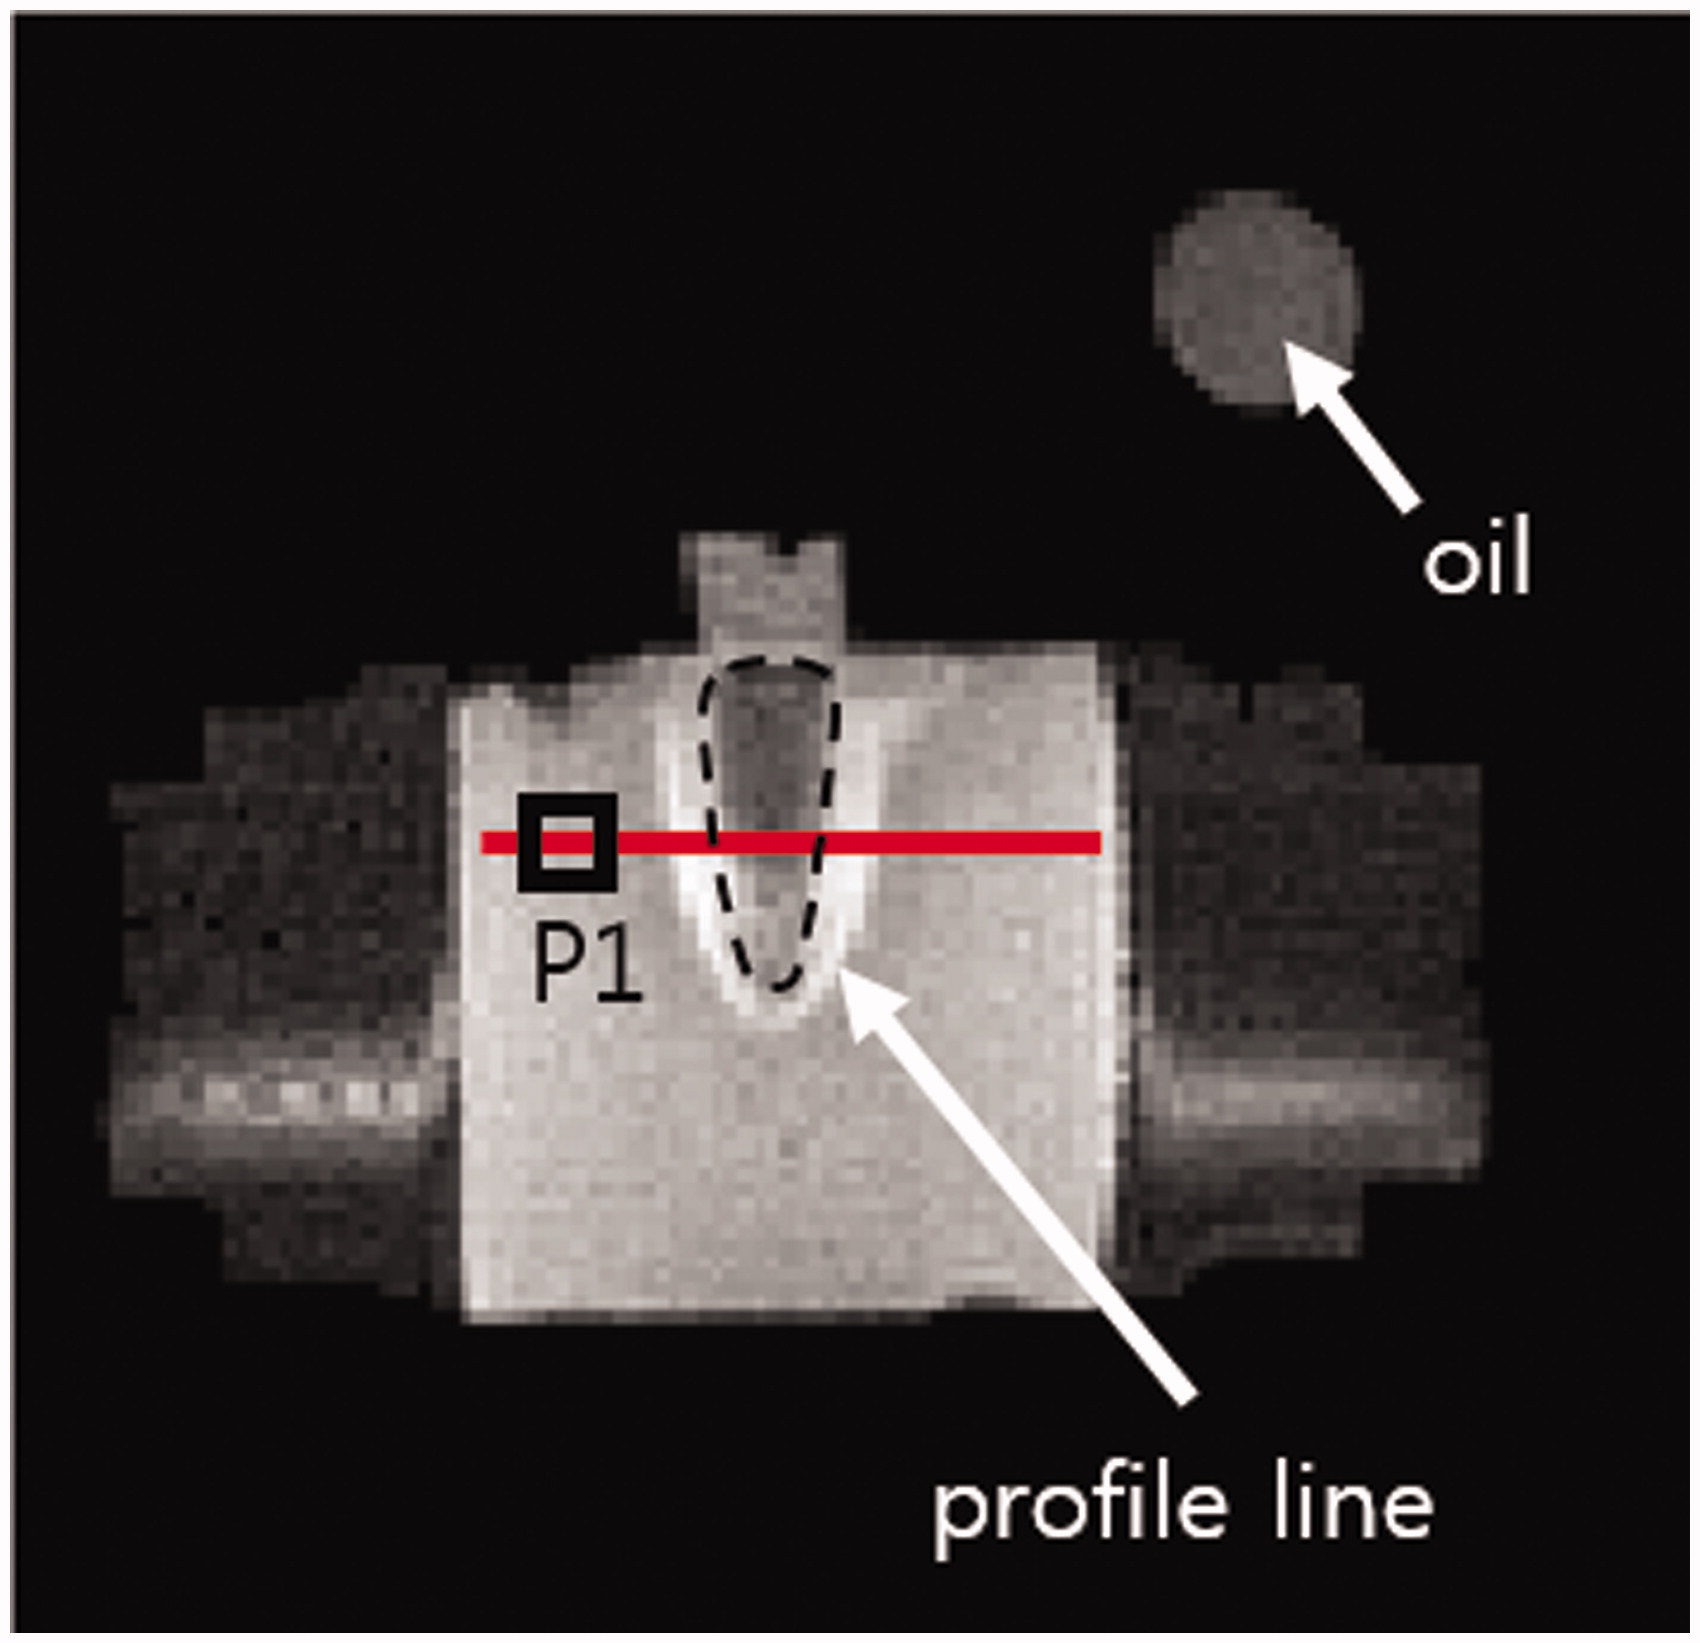
shows an MR image of the mid-plane (y = 0 plane) of the phantom. An oil tube on top of the phantom was placed to correct B0 drift effects in temperature mapping. The square P1 indicates the fibre-optic temperature probe. RF shielding effects, appearing as signal voids near the copper electrodes, were observed in the distilled water region. However, no noticeable RF shielding effects were observed at the phantom main body because of the distance between the electrodes and main body.
Figure 6. MR image of the phantom and oil tube on the mid-plane. Dashed line, tumour-mimicking compartment; red solid line, temperature profile; square P1, location of the fibre-optic temperature probe.
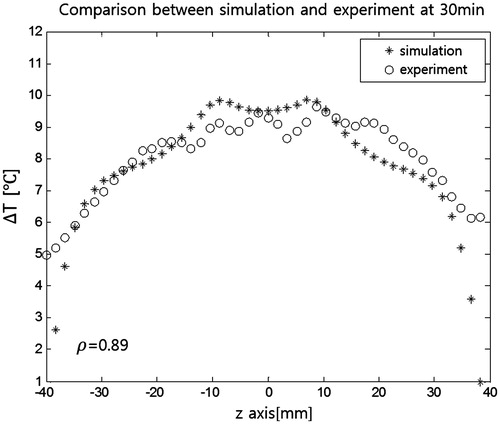
shows temperature maps taken every 10 min during RF heating superimposed on the MR intensity images. The temperature maps indicate increases from the initial ambient temperature of 19 °C. The 30-min RF heating resulted in temperature increases as large as 10 °C. Greater temperature increases were seen in the tumour-mimicking insert and its surrounding region. compares the temperature maps from experiments and FDTD simulations at 30 min of RF heating. Similar patterns were seen in the two maps. shows simulation and experimental temperature profiles from . Correlation between simulated and experimental temperature profiles was 0.89.
Figure 7. MRI temperature maps on the mid-plane of the phantom taken every 10 min during RF heating. RF heating was stopped during each 15-s round of MR thermometry.
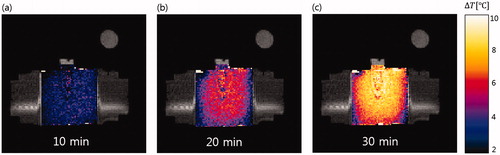
Figure 8. Comparison of temperature maps. (a) Simulation and (b) experiments of RF capacitive heating. Maps are taken at 30 min of heating.
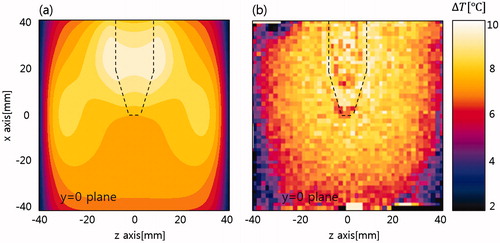
Figure 9. Temperature profiles after 30 min of RF capacitive heating. Data are from the red line in . Correlation between simulation and experiment was 0.89.
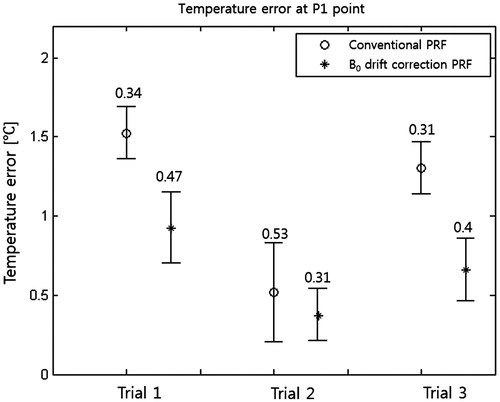
The difference between temperatures measured by the fibre-optic sensor and temperatures measured by MR thermometry was regarded as the temperature error of MR thermometry. The 60-min RF capacitive heating experiments were repeated three times after equalising the phantom temperature to room temperature. shows temperature errors at three trials of MR thermometry with and without B0 drift correction. B0 drift correction decreased the mean and deviation of temperature errors.
Figure 10. Temperature difference between MR thermometry and the fibre-optic sensing. Data are from the fibre-optic probe in over three trials of RF heating. Circle, temperatures before B0 drift correction; cross, temperatures after correction.
Discussion
RF capacitive heating experiments were performed on a tissue-mimicking phantom with intermittent MR thermometry to monitor the temperature of regions of interest. Electrical impedance measurements showed that a nanoparticle suspension elevated electrical conductivity at the nanoparticle-populated region. Ions in the nanoparticle suspension and not the nanoparticle cores increased electrical conductivity since the volume ratio of nanoparticles to tissue-mimicking agarose gel was too small to change electrical conductivity in nanoparticle-agarose gel mixture. According to Maxwell’s theory on the electrical conductivity of spherical particle suspensions in electrolytic solutions, the electrical conductivity of a suspension is largely dependent on the volume fraction of spherical particles [Citation38]. In our experiments, the nanoparticle suspension increased the electrical conductivity of the agarose gel almost three times. This increase was attributed to sodium CMC in the nanoparticle suspension. The elevated electrical conductivity of the insert was maintained in the phantom even though the insert directly contacted the background substance without separating structures. Injecting an ionic solution into the agarose gel might increase conductivity, but rapid diffusion of ions around the phantom would be expected. In our experiments, the conductivity of nanoparticle-populated gel embedded in a low-conductivity background gel decreased by 8.3% in two days. However, the conductivity of a NaCl-populated gel decreased by 33%.
Our results suggested that increased electrical conductivity could be used to better focus heat transfer to targeted regions in RF capacitive heating. Increasing electrical conductivity at a nanoparticle-populated region could increase RF current density. However, higher conductivity would not necessarily produce higher SAR at the nanoparticle-populated region since higher conductivity tends to decrease electric field intensity E and SAR is proportional to . In our experiments, the vicinity of the nanoparticle-populated insert showed an increase in temperature similar to the tissue-mimicking phantom. This increase could be detrimental in clinical practice because of possible cell death in surrounding tissues. However, if the increased temperature in the surrounding region was not excessive and it could be accurately monitored by MR thermometry, nanoparticle-mediated RF capacitive hyperthermia could find clinical applications. Spatial distribution of SAR in a human will be much more complicated to measure because of complex organ structures with different electrical conductivity and permittivity. Therefore, temperature rise estimations using electromagnetic and thermal simulations with a human model should be performed in future studies.
Measuring the actual power delivered to the phantom during RF heating experiments was difficult. A substantial fraction of the RF power output of the RF power amplifier was presumably consumed by the matching inductor, considering the large temperature increase at the inductor. Therefore, matching the power consumed by the phantom in experiments and FDTD simulations was difficult. Therefore, simulated temperature maps were scaled to have the same peak temperature rises. However, RF power readings at electrodes must be used in practice. Considering our scaling, the actual power delivered to the phantom was about 28 W, even though the output power reading was about 75 W at the power amplifier.
Use of low-concentration magnetic nanoparticle suspension allowed the use of MR thermometry without introducing artefacts. MR thermometry is a good tool for monitoring temperature during RF heating although it is inconvenient to accommodate an RF heating device in a long, narrow magnet bore. In our experiments, the RF heating device introduced no noticeable interference with the MRI instrument because of a large gap in operating frequencies between the two modalities. Placing external oil tubes near the patient to correct B0 drift effects would be another inconvenience in MR thermometry. A B0 drift correction method based on phase measured at nearby fatty tissues could be a solution [Citation35].
Conclusions
In RF capacitive hyperthermia, a magnetic nanoparticle suspension mixed with salts elevated the electrical conductivity of a targeted region, increasing heat transfer to the targeted region. Use of low-concentration magnetic nanoparticle suspension allowed intermittent MR thermometry of a phantom during RF capacitive heating. Nanoparticles and MR thermometry are expected to facilitate more clinical use of RF capacitive hyperthermia.
Declaration of interest
This work was supported by the National Research Foundation (NRF) of Korea funded by the Korean government (No: NRF-2013-R1A2A2A03006812). The authors alone are responsible for the content and writing of this paper.
References
- Baronzio G, Parmar G, Ballerini M, Szasz A, Baronzio M, Cassutti V. A brief overview of hyperthermia in cancer treatment. J Integr Oncol 2014;3:115
- Valdagni R, Amichetti M, Pani G. Radical radiation alone versus radical radiation plus microwave hyperthermia for N3 (TNM-UICC) neck nodes: a prospective randomized clinical trial. Int J Radiat Oncol Biol Phys 1988;15:13–24
- Valdagni R, Amichetti M. Report of long-term follow-up in a randomized trial comparing radiation therapy and radiation therapy plus hyperthermia to metastatic lymph nodes in stage IV head and neck patients. Int J Radiat Oncol Biol Phys 1993;28:163–9
- Huilgol NG, Gupta D, Dixit R. Chemoradiation with hyperthermia in the treatment of head and neck cancer. Int J Hyperthermia 2010;26:21–5
- Hua Y, Ma S, Fu Z, Hu Q, Wang LEI, Piao Y. Intracavity hyperthermia in a nasopharyngeal cancer: a phase III clinical study. Int J Hyperthermia 2011;27:180–6
- LeVeen HH, Wapnick S, Piccone V, Falk G, Ahmed N. Tumor eradication by radiofrequency therapy. Responses in 21 patients. JAMA 1976;235:2198–200
- LeVeen HH, Ahmed N, Piccone VA, Shugaar S, Falk G. Radiofrequency therapy: clinical experience. Ann NY Acad Sci 1980;335:362–71
- Kawai N, Futakuchi M, Yoshida T, Ito A, Sato S, Naiki T, et al. Effect of heat therapy using magnetic nanoparticles conjugated with cationic liposomes on prostate tumor in bone. Prostate 2008;68:784–92
- Kawai N, Kobayashi D, Yasui T, Umemoto Y, Mizuno K, Okada A, et al. Evaluation of side effects of radiofrequency capacitive hyperthermia with magnetite on the blood vessel walls of tumor metastatic lesion surrounding the abdominal large vessels: an agar phantom study. Vasc Cell 2014;6:15
- Shinkai M, Ueda K, Ohtsu S, Honda H, Kohri K, Kobayashi T. Effect of functional magnetic particles on radiofrequency capacitive heating. Jpn J Cancer Res 1999;90:699–704
- Shinkai M, Ueda K, Ohtsu S, Honda H, Kohri K, Kobayashi T. Effect of functional magnetic particles on radiofrequency capacitive heating: an in vivo study. Jpn J Cancer Res 2002;93:103–8
- Huang HS, Hainfeld JF. Intravenous magnetic nanoparticle cancer hyperthermia. Int J Nanomed 2013;8:2521–32
- Gannon CJ, Patra CR, Bhattacharya R, Mukherjee P, Curley SA. Intracellular gold nanoparticles enhance non-invasive radiofrequency thermal destruction of human gastrointestinal cancer cells. J Nanobiotech 2008;6:1–9
- Glazer ES, Massey KL, Zhu C, Curley SA. Pancreatic carcinoma cells are susceptible to noninvasive radio frequency fields after treatment with targeted gold nanoparticles. Surgery 2010;148:319–24
- Kruse DE, Stephens DN, Lindfors HA, Ingham ES, Paoli EE, Ferrara KW. A radio-frequency coupling network for heating of citrate-coated gold nanoparticles for cancer therapy: design and analysis. IEEE Trans Biomed Eng 2011;58:2002–12
- Xu Y, Mahmood M, Fejleh A, Li Z, Watanabe F, Trigwell S, et al. Carbon-covered magnetic nanomaterials and their application for the thermolysis of cancer cells. Int J Nanomed 2010;5:167–76
- Karmakar A, Xu Y, Mahmood M, Zhang Y, Saeed LM, Mustafa T, et al. Radio-frequency induced in vitro thermal ablation of cancer cells by EGF functionalized carbon-coated magnetic nanoparticles. J Mater Chem 2011;21:12761–9
- Burford CD, Bhattacharyya KD, Boriraksantikul N, Whiteside PJD, Robertson BP, Peth SM, et al. Nanoparticle mediated thermal ablation of breast cancer cells using a nanosecond pulsed electric field. IEEE Trans Nanobioscience 2013;12:112–18
- Hanson GW, Monreal RC, Apell SP. Electromagnetic absorption mechanism in metal nanospheres: bulk and surface effects in radiofrequency-terahertz heating of nanoparticles. J Appl Phys 2011;109:124306
- Li D, Jung YS, Tan S, Kim HK, Chory E, Geller DA. Negligible absorption radiofrequency radiation by colloidal gold nanoparticles. J Colloid Interface Sci 2011;358:47–53
- McCoy RS, Choi S, Collins G, Ackerson BJ, Ackerson CJ. Superatom paramagnetism enables gold nanocluster heating in applied radiofrequency fields. ACS Nano 2013;7:2610–16
- Moran CH, Wainerdi SM, Cherukuri TK, Kittrell C, Wiley BJ, Nicholas NW, et al. Size-dependent joule heating of gold nanoparticles using capacitively coupled radiofrequency fields. Nano Res 2009;2:400–5
- Dennis CL, Ivkov R. Physics of heat generation using magnetic nanoparticles for hyperthermia. Int J Hyperthermia 2013;29:715–29
- Kozissnik B, Bohorques AC, Dobson J, Rinaldi C. Magnetic fluid hyperthermia: Advances, challenges, and opportunity. Int J Hyperthermia 2013;29:706–14
- Gruttner C, Muller K, Teller J, Westphal F. Synthesis and functionalization of magnetic nanoparticles for hyperthermia applications. Int J Hyperthermia 2013;29:777–89
- Maier-Hauff K, Ulrich F, Nestler D, Niehoff H, Wust P, Thiesen B, et al. Efficacy and safety of intratumoral thermotherapy using magnetic iron-oxide nanoparticles combined with external beam radiotherapy on patients with recurrent glioblastoma multiforme. J Neurooncol 2011;103:317–24
- Oliveira T, Stauffer PR, Lee CT, Landon CD, Etienne W, Ashcraft KA, et al. Magnetic fluid hyperthermia for bladder cancer: a preclinical dosimetry study. Int J Hyperthermia 2013;29:835–44
- Johannsen M, Thiesen B, Wust P, Jordan A. Magnetic nanoparticle hyperthermia for prostate cancer. Int J Hyperthermia 2010;26:790–5
- Kato H, Ishida T. Development of an agar phantom adaptable for simulation of various tissues in the range 5–40 MHz, (hyperthermia treatment of cancer). Phys Med Biol 1987;32:221–6
- Ishihara Y, Calderon A, Watanabe H, Okamoto K, Suzuki Y, Kuroda K, et al. A precise and fast temperature mapping using water proton chemical shift. Magn Reson Med 1995;34:814–23
- Rieke V, Pauly KB. MR thermometry. J Magn Reson Imag 2008;27:376–90
- Quesson B, de Zwart JA, Moonen CTW. Magnetic resonance temperature imaging for guidance of thermotherapy. J Magn Res Imag 2000;12:525–33
- Ludemann L, Wlodarczyk W, Nadobny J, Weihrauch M, Gellermann J, Wust P. Non-invasive magnetic resonance thermography during regional hyperthermia. Int J Hyperthermia 2010;26:273–82
- Numan WCM, Hofstetter LW, Kotek G, Bakker JF, Fiveland EW, Houston GC, et al. Exploration of MR-guided head and neck hyperthermia by phantom testing of a modified prototype applicator for use with proton resonance frequency shift thermometry. Int J Hyperthermia 2014;30:184–91
- Hofstetter LW, Yeo D, Dixon WT, Kempf JG, Davis CE, Foo TK. Fat-referenced MR thermometry in the breast and prostate using IDEAL. J Magn Reson Imag 2012;36:722–32
- Zhang M, Che Z, Chen J, Zhao H, Yang L,Zhong Z, et al. Experimental determination of thermal conductivity of water–agar gel at different concentrations and temperatures. J Chem Eng Data 2011;56:859–64
- Foster KR, Schwan HP. Dielectric properties of tissue. CRC Crit Rev Biomed Eng 1989;17:25–104
- Grimnes S, Martinsen OG. Bioimpedance and Bioelectricity Basics. London: Academic Press, 2000, pp 74–9