Abstract
Purpose. Recently, Elekta has supplied volumetric modulated arc therapy (VMAT) in which multi-leaf collimator (MLC) shape, jaw position, collimator angle, and gantry speed vary continuously during gantry rotation. A quality assurance procedure for VMAT delivery is described. Methods and materials. A single-arc VMAT plan with 73 control points (CPs) and 5-degree gantry angle spacing for a prostate cancer patient has been created by ERGO + + treatment planning system (TPS), where MLC shapes are given by anatomic relationship between a target and organs at risk and the monitor unit for each CP is optimized based on given dose prescriptions. Actual leaf and jaw positions, gantry angles and dose rates during prostate VMAT delivery were recorded in every 0.25 seconds, and the errors between planned and actual values were evaluated. The dose re-calculation using these recorded data has been performed and compared with the original TPS plan using the gamma index. Results. Typical peak errors of gantry angles, leaf positions, and jaw positions were 3 degrees, 0.6 mm, and 1 mm, respectively. The dose distribution obtained by the TPS plan and the recalculated one agreed well under 2%-2 mm gamma index criteria. Conclusions. Quality assurance for prostate VMAT delivery has been performed with a satisfied result.
The concept of volumetric modulated arc therapy (VMAT) originated from the conformal avoidance radiation therapy Citation[1] with a dynamical movement of MLC while rotating the gantry. By modulating beam intensity during the gantry rotation, intensity modulated arc therapy (IMAT) was proposed and further investigated Citation[2–6]. VMAT is one of the techniques to realize IMAT by varying gantry speed and dose rate with dynamical movement of MLC and jaw Citation[7]. Recently, this has been clinically available Citation[8–10] and a combination of Elekta Synergy with the latest linac control software and ERGO + + treatment planning system (TPS) is one example.
The purpose of this paper is to investigate how much error is caused in dose distribution due to the fluctuation in the dynamical parameters. The linac controller in Elekta Synergy (Elekta, Crawley, UK), RT Desktop 7.0.1, serves to record measured data of dose rates, gantry angles, MLC and jaw positions with 0.25 s interval during VMAT treatment. We can evaluate the influence of these errors by recalculating the dose distribution with these actual dynamical parameters. Since this is an independent simulation analysis and therefore we may be able to specify the cause when VMAT film verification failed.
Methods and materials
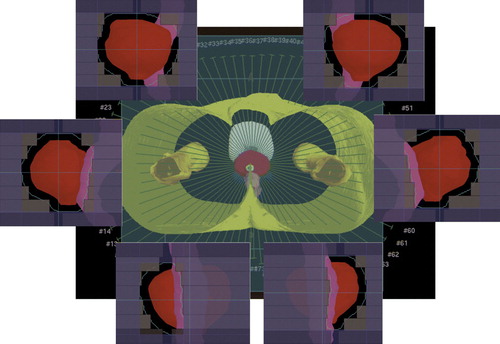
A single-arc VMAT plan for prostate cancer was created by ERGO + + v1.71 TPS (Elekta/3DLine, Milano) with D95 prescription (dose to 95% of target volume) of 76 Gy in 38 fractions. A single arc was discretized into 73 static beams or CPs placed at 5-degree gantry angle intervals between −175 and +175 degrees and the first and last CPs were positioned at −179 and + 179 degrees (). The field shape for each control point was determined by either conformal or conformal avoidance strategy with a 6 mm leaf margin to Planning Target Volume (PTV). In other words, the rectum was partially shielded by MLC when it was in front of the target in beam's eye view, while the whole target was irradiated when it was in front of the rectum.
Figure 1. A single-arc VMAT plan with 73 CPs and 5-degree gantry angle spacing for a prostate cancer patient has been created by ERGO + + treatment planning system, where MLC shapes are given by anatomies of target and organs at risk and monitor units for each CP is optimized by simulated annealing algorithm based on given dose prescriptions. The red and pink regions are PTV and rectum, respectively.
In the present study, the collimator angle was fixed at 180 degrees. Beam weights for all CPs were optimized by inverse planning based on the simulated annealing algorithm. Dose grid resolution was 2 mm x 2 mm x 2 mm for 3D calculation. After inverse planning, the CPs were grouped into a single arc with the VMAT sequencer in ERGO + + TPS, where a monitor unit (MU) to be delivered between two adjacent CPs was calculated by adding MUs at the two adjacent CPs and then multiplied by 0.5. The created plan was sent to MOSAIQ v1.6 (Elekta IMPAC, USA), and then delivered by the RT desktop controller.
For dose verification, VMAT plan was transferred to two phantom studies. One was a cylindrical water phantom with 0.015 cc pin-point ionization chamber (Type 31014, PTW, Germany) placed at the isocentre. The other was a pelvic water phantom including a GafChromic film (International Specialty Products, NJ, USA) to measure the dose distribution on axial, coronal, and sagittal planes including the isocentre. The GafChromic film was scanned using a flatbed scanner (EPSON GT-X770, Japan) and the gamma index with 3% of a dose at the measurement point and 3 mm has been evaluated by using DD-system v9.0 (R-tech, Japan).
The linac controller in service mode was capable of recording the actual gantry angle, MLC and jaw positions, and dose rate as a function of time. The MLC and jaw positions in each CP computed by ERGO + + were compared with the corresponding measured values. The cumulative MU error is practically negligible because Elekta VMAT delivery is based on MU-based servo control. Instead, the gantry angle error is discussed, which is defined as the difference between the gantry angle for each CP and the gantry angle where a cumulative MU reaches a specified value. A gantry speed dependence of these errors with the same VMAT plan was also examined by employing two times slower gantry speed than a commonly used clinical speed.
Using the actual data of gantry angle, MLC and jaw positions, and the cumulative MUs, dose distribution was re-calculated using Pinnacle v7.4i TPS (Philips, USA), and the dose in the original plan transferred into Pinnacle was compared with the re-calculated dose distribution.
Results
The beam-on time was typically 100 s for a single-arc prostate VMAT delivery. The isocentre dose discrepancy between plans and measurements for 17 patients was −0.5±0.8% (s.d.). The averages of the pass rate with a gamma criteria of 3 mm and 3% of a dose at the measurement point were 97.3%, 91.8%, and 92.2% on axial, sagittal, and coronal planes for a region having a dose greater than 30% of the isocentre dose, respectively.
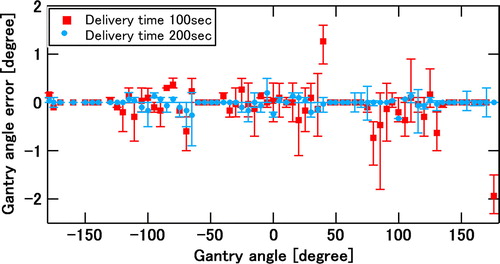
demonstrates measured errors between planned and actual gantry angles during VMAT delivery for three consecutive runs. The red data points show the position errors for a normal delivery time of 100 s, whereas the blue data points show those for a delivery time of 200 s. The bar shows the error range for the three runs. The gantry angle ranges of zero gantry angle error were due to move-only control points with no dose delivery.
Figure 2. Measured errors between planned and actual gantry angles for three consecutive runs of the same VMAT plan. The red data points show the position errors for a normal delivery time of 100 s, whereas the blue data points show those for a delivery time of 200 s. The bar shows the error range for the three runs.
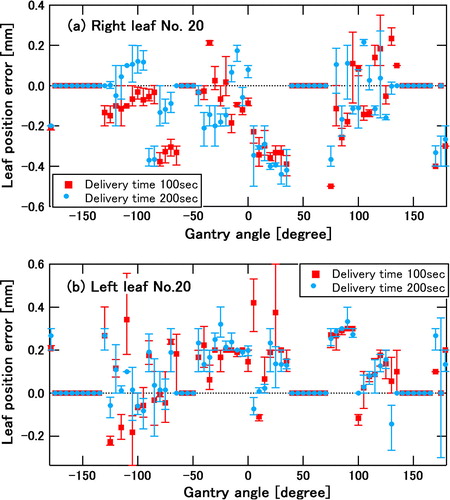
a and b show measured errors between planned and actual leaf positions during VMAT delivery for three consecutive runs of the same VMAT plan as in . a depicts a position error of right leaf number 20, which is one of the centre leaves, whereas b depicts a position error of left leaf number 20. Again the red data points show the position errors for a normal delivery time of 100 s, whereas the blue data points show those for a delivery time of 200 s. The bar shows the error range for the three runs. The gantry angle ranges of zero leaf error were due to move-only control points with no dose delivery.
Figure 3. Measured errors between planned and actual leaf positions of the two centre leaves for three consecutive runs of the same VMAT plan: (a) position error of right leaf number 20, (b) position error of left leaf number 20. Again the red data points show the position errors for a normal delivery time of 100 s, whereas the blue data points show those for a delivery time of 200 s. The bar shows the error range for the three runs. The gantry angle ranges of zero leaf error were due to move-only control points with no dose delivery.
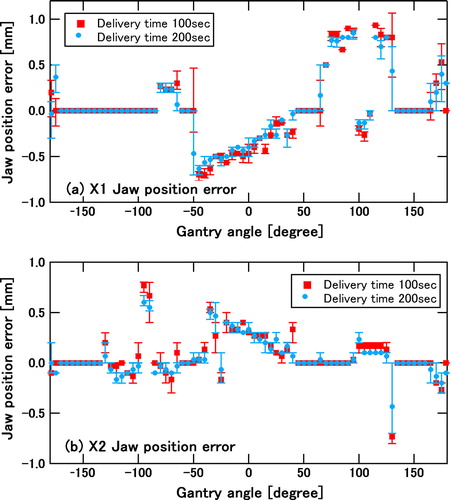
a and b depicts measured errors between planned and actual X1 and X2 back-up jaw positions, respectively, during VMAT delivery for three consecutive runs of the same VMAT plan. Once again, the red data points show the position errors for a normal delivery time of 100 s, whereas the blue data points show those for a delivery time of 200 s. The bar shows the error range for the three runs. The gantry angle ranges of zero back-up jaw error were due to move-only control points with no dose delivery.
Figure 4. Measured errors between planned and actual back-up jaw positions for three consecutive runs of the same VMAT plan: (a) position error of X1 jaw, (b) position error of X2 jaw. Once again the red data points show the position errors for a normal delivery time of 100 s, whereas the blue data points show those for a delivery time of 200 s. The bar shows the error range for the three runs. The gantry angle ranges of zero back-up jaw error were due to move-only control points with no dose delivery.
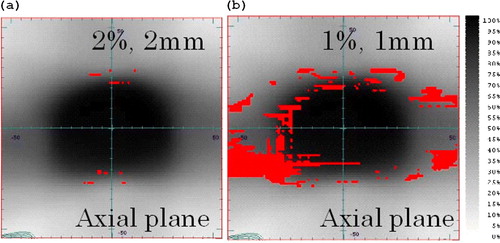
a and b show gamma-index comparisons between an ERGO + + plan and re-calculated dose using actual data of MLC and jaw positions, gantry angles, and MUs with an interval of every 1 s. The red areas indicate gamma indices of larger than one under criteria of (a) 2% of a dose at the calculated point and 2 mm and (b) 1% of a dose at the calculated point and 1 mm.
Figure 5. Gamma comparison between an ERGO + + plan and re-calculated dose using actual data of MLC and jaw positions, gantry angles, and MUs with an interval of every 1 s. The red areas indicate gamma indices of larger than one under criteria of (a) 2% of a dose at the calculated point and 2 mm and (b) 1% of a dose at the calculated point and 1 mm.
Discussion
We have shown highly accurate prostate VMAT delivery using Elekta Synergy and ERGO + + TPS. While the dose agreement in the isocentre shows that total MU is correctly delivered, the agreement of dose distribution on axial, sagittal, and coronal planes assures accurate VMAT delivery. In the Synergy control system, the MLC, jaw, and gantry speed are servo-controlled based on cumulative MUs in each CP. Hence the errors in such dynamical parameters are quickly compensated by real-time feedback control. For instance, it was found that the gantry angle error was immediately corrected as seen in . In addition to the mechanical control, it is very important to mention that ERGO + + creates the MLC shape based on the anatomy relationship between the target and organs at risk from the beams eye view. Since it is a smooth function of gantry angle, no major changes are observed in MLC and jaw positions between adjacent control points thereby leading to more accurate dose calculation in TPS.
In the present work, the errors in gantry angles, MLC and jaw positions during VMAT delivery were analyzed. As seen in , these errors were reproduced among three consecutive runs of the same VMAT plan, and were considered to be caused by accelerations of gantry, leaves, and jaws, which were required in almost the same gantry angles. In fact, it was clearly observed that the gantry angle error decreased when the gantry speed was slower as shown in . In principle, smaller leaf and jaw position errors can be anticipated when the gantry speed is slower due to lower leaf and jaw speeds. In the present prostate plan which has no large leaf and jaw movements during gantry rotation, the leaf and back-up jaw position errors were comparable between two different delivery times. Instead, error tolerances of leaf and jaw positions given in the radiation control system may be a major cause of the observed errors.
As shown in , the influence of these dynamical errors was negligible under criteria of 2% of a dose at the calculated point and 2 mm. Even under 1% of a dose at the calculated point and 1 mm criteria, the result was good except for low dose region. In other words, the errors in the dynamical parameters with the observed orders in prostate VMAT delivery do not affect the resulting dose distribution significantly.
Conclusion
VMAT dose measurement for prostate cancer agreed well with the plan created by ERGO + +. The observed errors of the dynamical parameter did not affect the dose distribution significantly. Quality assurance for prostate VMAT plans has been performed with a satisfied result. Declaration of interest: Dr. Nakagawa receives research funding from Elekta KK.
Related Research Data
References
- Takahashi S. Conformation radiotherapy: Rotation techniques as applied to radiography and radiotherapy of cancer. Acta Radiol Suppl 1965; 242: 1–142
- Yu CX. Intensity-modulated arc therapy with dynamic multileaf collimation: An alternative to tomotherapy. Phys Mod Biol 1995; 40: 1435–49
- Yu CX, Li XA, Ma I, et al. Clinical implementation of intensity modulated arc therapy. Int J Radiat Oncol Biol Phys 2002; 53: 453–6
- Earl MA, Shepard DM, Maqvi SA, et al. Intensity modulated arc therapy simplified. Int J Radiat Oncol Biol Phys 2002; 53: 222–35
- Earl MA, Shepard DM, Maqvi SA, et al. Inverse planning for intensity modulated arc therapy using direct aperture optimization. Phys Med Biol 2003; 48: 1075–89
- Shepard DM, Cao D, Afghan MKN, Earl MA. An arc-sequencing algorithm for intensity modulated arc therapy. Med Phys 2007; 34: 464–70
- Otto K. Volumetric modulated arc therapy: IMRT in a single gantry arc. Med Phys 2008; 35: 310–7
- Bedford JL, Nordmark HV, MacNair HA, Aitken AH, Brock JE, et al. Treatment of lung cancer using volumetric modulated arc therapy and image guidance: A case study. Acta Oncol 2008; 47: 1438–43
- Bedford JL, Warrington AP. Commissioning of volumetric modulated arc therapy (VMAT). Int J Radiat Oncol Biol Phys 2009; 73: 537–45
- Korrenman S, Medin J, Kristoffersen FK. Dosimetric verification of RapidArc treatment delivery. Acta Oncol 2009; 48: 185–91