Abstract
Comparable data on cancer incidence and mortality in Denmark, Finland, Iceland, Norway, and Sweden are available for analysis through a collaboration of the national Cancer Registries via the NORDCAN website (http://ancr.nu). In the continued spirit of Nordic collaborative research, a number of studies examining trends in cancer survival are published in this journal. Material and methods. The data were divided into eight 5-year periods by sex in five Nordic countries. Age-standardised 5-year relative survival ratios and excess mortality rates in the short-term (first month and 1–3 months following diagnosis), and the long-term (2–5 years after diagnosis) were calculated, as were age-specific 5-year relative survival using cohort-survival methods. A hybrid method combining the cohort and period methods was used for the period 1999–2003 as not all patients were followed for five years. Age-standardisation used the International Cancer Survival Standard, and calculation of expected deaths used country-specific population mortality rates. Results. The data series constitutes 3 360 397 tumours among 3 160 802 patients followed up for death through 2006 for 39 different cancer sites diagnosed in the years 1964–2003. The paper describes the data, exclusions and imputations, design and analysis, age structure and standardisation procedures, follow-up, and case-mix adjustment methods. Conclusion. The strengths of this study include the overall comparability and quality of the data, the national coverage, and the length of the time series. Collecting and analysing data from the five Nordic countries for 39 different cancer sites over 40 years in a systematised and comparable way is a major undertaking. A thorough description of the analyses, definitions and exclusions in the survival study, supplemented with corresponding information on cancer incidence and mortality is needed for appropriate interpretation and comparison between countries, and between and within cancer sites. This information must be made available to provide appropriate interpretation of the site-specific results.
In a previous Nordic collaborative project examining future cancer mortality, it was reported that Danish cancer patients had a poorer prognosis than patients in the other Nordic countries for a number of common cancers [Citation1]. A subsequent paper compared 5-year relative survival between the Nordic countries over the period 1958–1992 [Citation2], observing an increase in cancer survival with calendar time for most of the cancer forms under study, but with the increase less rapid in Denmark than in the other Nordic countries. The EUROCARE-1 and 2 reports for the years 1978–1984 and 1985–1989 portrayed a relatively good prognosis for cancer patients in the Nordic countries compared to other European countries, but confirmed a poorer survival in Denmark [Citation3,Citation4]. These results in combination were important factors behind the initiation of the first Danish Cancer Plan in 2000 [Citation5].
The purpose of this study is to update the previous Nordic studies with years of diagnosis up to and including 2003 and follow-up of vital status through to the end of 2006, and to re-evaluate the variations in Nordic survival, increasing the specificity of detail to the study of 39 cancers, the so-called “entities” currently available in NORDCAN [Citation6]. The paper presents the data sources, methods, and presentation of the results. A series of accompanying papers present and interpret the results for each of the main groups of cancer [Citation7–18].
Material and methods
Data
The NORDCAN database was used for this cancer survival study, with data obtained from each of the Nordic Cancer Registries (in Denmark, Finland, Iceland, Norway, and Sweden), comprising of anonymous individual records for all tumours in cancer patients diagnosed 1964–2003. Tabular and graphical descriptions of cancer incidence, mortality and prevalence can be found as tabulated data in the web-based NORDCAN program (www.ancr.nu). A description of cancer registration in the Nordic countries and the conversions of data made to ensure comparability between countries and over years in the NORDCAN project can be found in a separate paper [Citation19]. In short, NORDCAN is a collaborative project involving the Nordic cancer registries (and the Faroe Islands), where registrations of cancer incidence and cancer mortality are included in a common dataset based on conversions of the original national datasets according to international rules. Data are included from the inception of the registries as and when they are considered complete right up until the most recently available years. Registrations of incident cancer cases have been compulsory for most of the time span of recording in each country. NORDCAN is updated with new data about twice a year, and cancer incidence, mortality and prevalence can be found on the website (www.ancr.nu). A description of cancer registration in the Nordic countries and the conversions of data made to ensure comparability between countries and over time can be found in a separate paper [Citation19].
The NORDCAN data have been supplemented with individual records of follow-up for death (for all causes) through to the end of 2006, via a linkage to the national population registers. Except in the earliest years, the national unique personal identification number issued to all persons in a country at birth or immigration has been used. Personal identification numbers were introduced in Sweden in 1947, in Iceland 1953, Norway 1964, Finland 1967, and in Denmark in 1968.
Each of the cancer sites presented in NORDCAN (except the non-melanoma of the skin category) were included in this study, amounting to 39 sites plus an aggregated group covering all cancer sites but non- melanoma skin. Non-melanoma cancers of the skin were not included due to the combination of a very low case-fatality and concerns with respect to potential differences in the completeness of ascertainment between countries. Results for Uterus, other are not shown due to an inconsistent use of this diagnosis between countries. Given the potential artefactual influence varying over time and between countries, of screening for breast cancer and PSA testing for prostate cancer, an additional summary site entitled all cancer sites but non-melanoma skin, prostate, and breast cancer, was defined to facilitate comparison. There were no restrictions on age. The year of diagnosis was categorised according to eight 5-year periods (1964–1968, 1969–1973, …, 1999–2003). The ICD-10 codes that define each site are given in and .
Table I. Cancer cases included in the Nordic cancer survival study 1964-2003 by site and country. Men
Table II. Cancer cases included in the Nordic cancer survival study 1964-2003 by site and country. Women
shows by country and year of diagnosis two numerical indices of validity, the percentage of cases morphologically verified and the percentage for which no other information other than a death certificate mentioning cancer was obtained (death certificate only percentage – DCO%) [Citation20], and a marker of comparability, the proportion of cancers found on the basis of incidental autopsy, i.e. without any suspicion of malignancy before death [Citation20].
Table III. Proportion of microscopically-verified tumors, tumors registered by DCO (Death Certificate Only) and by incidental autopsy for cancer of all sites but non-melanoma skin in the Nordic cancer survival study 1964-2003, by country and year of diagnosis.
Exclusions and imputations
DCO registrations and tumours registered as incidental findings at autopsy were excluded from the survival analyses. The Swedish Cancer Registry did not link to information from death certificates in the study period, and trace-back procedures via death certificate-initiated (DCI) cancers were not undertaken as they were in the other countries, which may have lead to a degree of underreporting of fatal cases with short survival. If the date of diagnosis was registered as the month following death or later, the tumour registrations (0.01% of the total) were excluded due to suspected coding errors.
Only month and year were available for the date of diagnosis and death. For the few tumours with a missing month of diagnosis (0.1%) month was imputed. If diagnosis and death were in the same year, the month of diagnosis was imputed as the month equidistant to the beginning of the year and the month of death. If year of death was later than the year of diagnosis, the month of diagnosis was set to July.
Concepts of mortality and survival
A common aim when studying cancer patient survival is to estimate the net probability of survival, a measure of patient survival following primary cancer in the absence of other causes of death. Net survival can be estimated in two ways. For cause-specific survival, only deaths for which the cancer of interest is certified as the primary cause of death are considered as events in the survival analysis, while survival times terminated by deaths from other causes are censored, together with persons lost to follow-up (e.g. through emigration out of the study area) or the end of study is attained. The alternative approach, relative survival, R(t), which we used in this study, is estimated as the ratio of the observed survival of cancer patients, So(t), (where all causes of deaths are considered events) relative to the survival that would have been expected, Se(t), if the cancer patients had been subject to the background mortality of the general population, given the same distribution of key demographic factors (sex, calendar time, year of birth, and country) and assumed to be, in practical terms, free of the cancer under study. At each time t since diagnosis, the relative survival following the cancer, R(t), is defined as
R(t)=So(t)/ Se(t).
The expected survival Se(t) is estimated from national population life tables stratified by age, sex, and calendar time. Although these tables include the effect of deaths due to the cancer being studied, this does not, in practice, affect the estimated survival proportions [Citation21,Citation22]. Mortality for a specific cancer generally constitutes only a small fraction of total mortality, and correcting for this mortality has a negligible effect on expected survival. This is unlikely however to be the case were one to consider “all cancer” survival - the aggregation of individual sites to a group constituting all cancers combined.
The complement of survival, mortality, measured as the hazard of death, is often used in further analysis. Since the hazards are assumed constant in intervals following the cancer diagnoses, they can be described as rates. The observed mortality rate λo(t) for a group of cancer patients of a specific age and sex, within a given interval since diagnosis and in a specified calendar period, is modeled as the sum of the background population mortality rate λe(t) and the excess mortality rate due to the diagnosis of cancer v(t):
λo(t)= λe(t)+ v(t)
It is common to use relative survival as a means of estimating net survival in population-based cancer survival studies. The advantages of such a measure is that information on cause of death is not required and that it provides a measure of the excess mortality hazard experienced by patients diagnosed with cancer, irrespective of whether the excess mortality is directly or indirectly attributable to the cancer.
Design of survival analyses, cohort and hybrid approaches
We used the cohort survival method where the vital status of each patient diagnosed in a calendar period was followed up for five years. The observed survival was estimated using the actuarial method and the expected survival by the Ederer II method [Citation23]. The SAS-macros supplied by Dickman were used in the estimation [Citation24]. The method according to Hakulinen could have been used to avoid bias due to patient heterogeneity in patient withdrawal, but for 5- or 10-year relative survival both methods will give roughly unbiased results [Citation23].
For the latest 5-year period, 1999–2003, not all cancer cases could be followed-up for five years after diagnosis since follow-up ended 31 December 2006, and hence, so-called hybrid methods were applied. Hybrid analysis is a combination of period and cohort survival [Citation25]. When calculating the cumulative 5-year relative survival, cohort survival estimates for the first three and four years of follow-up (through until the end of 2006) for patients diagnosed in 2003 or 2002, respectively, were calculated and combined with follow-up interval-specific relative survival estimates for the fourth and fifth years of follow-up for patients diagnosed in previous years. Calculation of the hybrid estimates used the program strel in Stata [Citation26]. For breast and prostate cancer, 10-year relative survival estimates were also calculated.
National life tables
The country-specific population mortality rates used for calculating the expected survival were based on data from The Human Mortality Database [Citation27] (www.mortality.org). This contains, for the Nordic countries, the probabilities of death derived from the central statistical offices in each country. Based on these data, population death rates by sex were calculated for each country, by single year of age and calendar period, with rates smoothed using 5-year moving averages over time. shows the differences in age-specific population mortality rates ages 40 and above in 2003 by country for men and women. To illustrate the variations over time, shows the trends in life expectancy at birth by country and sex.
Figure 1. Age-specific population mortality rates for ages 40 and above in the Nordic countries in 2003 by sex and country. Death rates are smoothed using a 5-year moving average over the years 2001–2005 [Citation27].
![Figure 1. Age-specific population mortality rates for ages 40 and above in the Nordic countries in 2003 by sex and country. Death rates are smoothed using a 5-year moving average over the years 2001–2005 [Citation27].](/cms/asset/1db5a4b4-88b6-4096-8669-8e8a33070e7c/ionc_a_474454_f0001_b.jpg)
Figure 2. Trends in life expectancy at birth in the Nordic countries by sex and country [Citation27].
![Figure 2. Trends in life expectancy at birth in the Nordic countries by sex and country [Citation27].](/cms/asset/d2df492a-3b20-4fa6-af5a-560fddffb575/ionc_a_474454_f0002_b.jpg)
Age-standardisation
The population age distributions vary over calendar time and between the Nordic countries, with Iceland and Finland having the youngest populations and Sweden, the oldest. The vast majority of cancers are epithelial, for which the risk of the disease tends to increase as a power of age, so to be able to compare incidence and mortality between countries and over time, age-standardised rates using the world standard population [Citation28,Citation29] were calculated.
The age distributions of cancer cases also vary between countries and over time, and the relative survival usually decreases with age. In earlier studies, age-standardisation of relative survival was usually based on an internal standardisation, i.e., using the age distribution of the patients included directly. In this study we used the three age-standard weight distributions developed as part of the EUROCARE-2 analyses [Citation30], the so-called International Cancer Survival Standard (ICSS). Weights were supplied by 5-year intervals up to 85+. We made minor changes to the weights in the last two age groups to match the age intervals used in this study (ages 0–49, 50–59, 60–69, 70–79, 80–89, and 90+ years). The three age-standards are the following: i) cancers affecting mainly young adults (testis, Hodgkin's disease, acute lymphatic leukaemia); ii) cancers where diagnoses are not uncommon at young and middle ages (cervix, melanoma, brain, thyroid, bone, soft tissues); iii) cancers that mainly affect the elderly (all other cancer forms). For acute leukaemia, the ICSS standard for cancers of mainly young adults has been used as acute lymphatic leukaemia is not used as a separate entity in the NORDCAN database. Weights for the age groups that we used, and the proportion of tumours where each standard weight distribution was applied, can be seen in . For the summary groups all cancer sites but non-melanoma skin and all cancer sites but non-melanoma skin, prostate, and cancer breast cancer, we used the age standard for cancers that mainly affect the elderly.
Table IV. International Cancer Survival Standards (ICSS). Three standard weight functions for age-standardisation of relative survival as used in Nordic cancer survival study 1964-2003.
Applying the ICSS standards permits more direct comparison with other studies where these are used, for instance the EUROCARE-4 [Citation31] and the CONCORD studies [Citation32]. The age distribution implicated by the standard weights differs from that of the included patients. This may imply a substantial difference between age-standardised relative survival using ICSS or using an internal standard based on the age-distribution of the patients included. We observed the biggest differences for cancers of the ovary, with differences as high as five percentage points.
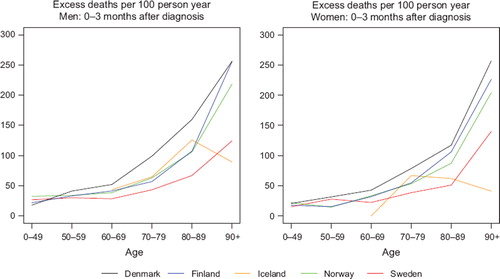
We used 10-year intervals for ages at diagnosis above 50 to obtain a finer division of age for those strata where cancer is more frequent. Since life expectancy of the general population has increased with calendar time, and an increasing proportion of the elderly patients do not suffer from serious co-morbidity and are thereby healthy enough to endure cancer treatment, we examined the age groups 80–89 and 90+ separately to evaluate the possible effects of improvement of diagnostics and treatment. We observed that excess mortality in the first three months following diagnosis increased with age, and that the variation between countries was especially high for the oldest age group. illustrates this for both sexes for all cancers except non-melanoma skin in the last period of diagnosis 1999–2003. The variations between countries for the 90+ age group in the first three follow-up months can be even higher for specific cancer diagnoses, as illustrated by colon cancer in .
Figure 3. Trends in age-specific excess deaths per 100 person years in the first three months after diagnosis for cancer patients of all cancer sites but non-melanoma skin patients diagnosed 1999–2003 by sex and country. Nordic cancer survival study 1964–2003.
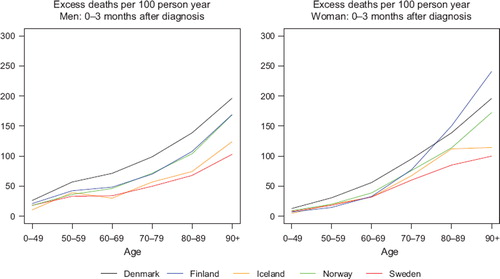
Figure 4. Trends in age-specific excess deaths per 100 person years in the first three months after diagnosis for colon cancer patients diagnosed 1999–2003 by sex and country. Nordic cancer survival study 1964–2003.
In the age-standardisation of survival however, patients aged 90 or over at diagnosis were allocated zero weighting. We believe that diagnostics and treatment of patients in this age group may be quite different from that of younger patients, making the relative survival calculations for the oldest old age group unreliable, and hence they were excluded. This had little effect on the 5-year age-standardised relative survival, given the minor proportion of patients diagnosed with cancer at such high ages. This is illustrated in with estimates including and excluding this age group for prostate cancer among Swedish men and for female breast cancer in Denmark.
Figure 5. Effect on 5-year relative survival of excluding patients 90 years or older at diagnosis over calendar time among Danish female breast cancer patients and Swedish prostate cancer patients. Nordic cancer survival study 1964–2003.
Follow-up intervals
Each patient was followed-up for their vital status five years after diagnosis, with censoring at emigration or at the end of follow-up (31 December 2006). The proportion of patients censored due to emigration was 0.3%. The follow-up time since diagnosis was divided into smaller intervals where the excess mortality hazard was assumed to be constant in each interval. It has been suggested to use using shorter intervals (e.g. of length three or six months) early in the follow-up where most deaths occur and the excess hazard changes most rapidly [Citation24]. In a previous study of colorectal cancer survival in the Nordic countries and the UK, we also found that the excess mortality was highest in the first three months following diagnosis, especially for diagnoses at higher ages [Citation33]. shows the age-specific variations in excess mortality during the first three follow-up months for colon cancer, and demonstrates the rather large variations between countries at higher ages.
Taking inspiration from this previous study, the primary aim of this survival analysis was to examine short follow-up intervals soon after diagnosis. Specifically, we examined the first month, 1–3 months, 3–12 months, and then yearly intervals. Since we only had month and year of diagnosis and death, calculation of the number of deaths and time under risk of death in units of days within each follow-up interval was not possible. An approximation was made using the following methodology. Deaths in the first follow-up interval, the first month, included patients with diagnoses and deaths in the same month, plus half of the deaths among the patients dying the month following diagnosis (those patients with a diagnosis in months with less than 31 days, i.e. every other month). The contributed risk-time was zero for patients dying in the month of diagnosis and 30 days for all other patients. Calculations for deaths in the next follow-up interval, 1–3 months, were based on the remainder of patients dying in the month after the month of diagnosis plus those dying in the following month, and half of those dying within the third month after the month of diagnosis. Risk time contributions were 30, 60, and 90 days respectively. The method was evaluated by comparing results using data where specific dates were available. The excess mortality rate was underestimated in the first month and slightly overestimated in the next follow-up interval, the second and third months, and the bias was larger for cancer sites associated with a high case-fatality. Given the same method was used for all countries and calendar years, any biases resulting from a lack of precision should be of a similar direction and magnitude in each population, and hence we believe it will not materially affect survival comparisons, nor their interpretation.
Inclusion criteria
We decided to include all primary tumours, rather than restrict the analysis to first primary tumours only, as is commonly practiced in, for example, the EUROCARE studies [Citation31]. The inclusion of multiple tumours has been shown to decrease the relative survival estimates, since patients with multiple cancers tend, on average, to have poorer survival [Citation34]. For international comparisons it has been advised to include all primary tumours as this reduces possible biases due to the widely-varying inception years of Cancer Registries and thereby different proportions of multiple primaries, part-dependant on the age of the cancer registry. In relative survival analysis, risk time for patients diagnosed with previous cancers, are generally included when estimating expected survival (the denominator of relative survival estimates) through the population mortality rates, and it has been shown that when estimating observed survival (the numerator of relative survival), excluding subsequent cancers may bias the estimates [Citation35,Citation36].
Combining age and period strata
For less common cancers, some of the cells defined by age group, period, sex, and country contained either few or no incident cases, making calculation of the corresponding relative survival estimates inappropriate. This was particularly the case for Iceland, where the population number was at least 10 times smaller than in its Nordic counterparts.
For cells with fewer than five incident cases for a given cancer, or where more than 10% of the cells had 5–9 incident cases, cells were combined with neighbouring cells (ages, periods) in order to make estimation of the relative survival possible. No more than two 5-year period cells and neighbouring cells for the age groups below 70 years were combined. Exceptions were cervical and corpus uteri cancer and non-Hodgkin lymphoma, where the age groups 70–79 and 80–89 were combined. If combined cells still contained less than five incident cases, the relative survival was not reported in tables with age-specific 5-year relative survival, as indicated by an asterisk. Results based on either combined 5-year periods or combined age groups are shown in italics.
Case-mix analyses
Evidently there will be a varying distribution of individual cancer sites between countries and over time. For example, rectal cancer incidence has been historically low in Iceland while rates have been uniformly increasing in Norway in recent decades to a relatively high rate. Prostate cancer incidence has increased dramatically within the latest 10–15 years due to an increased use of prostate specific antigen (PSA) test and subsequent biopsy, but to a lesser and later extent in Denmark than in the other Nordic countries [Citation37]. When comparing all-cancer survival between countries on aggregating individual sites, a common weighting scheme of sites, accounting for case-mix, should be employed. We used as weights the 15 most frequent cancers and the residual group of all other cancers diagnosed 1999–2003 by sex. Two sex-specific sets of weights for the two summary groups all cancer sites but non-melanoma skin and all cancer sites but non-melanoma skin, prostate and breast cancer were constructed and can be seen in Storm et al. [Citation18].
Results
The number of patients included were more than 3.1 million, 1 577 100 men and 1 583 702 women, and more than 3.3 million tumours. An overview of the number of cancers among patients included according to country and site is given for men in and for women in .
The proportions of tumours excluded due to being DCO cases or as a result of incidental findings at autopsy by time period and country are shown in . The DCO proportion in Denmark decreased from 5.4 to 0.3% during the study period, while the Finnish and Norwegian DCO percentage did not change materially, with levels slightly higher than 2% and 1%, respectively. In Sweden – where no linkage with death certificates is made – the percentage of incidental autopsies was considerably higher than in the other countries, probably through the ascertainment of cases that would have been death certificate initiated if linkage with death certificates had been in place [Citation38]. Iceland had few DCOs, but the excluded proportion was more than 10% in the period 1964–1968 and was nearly as high as Sweden thereafter.
Differences between countries in age-specific population mortality rates among men in 2003 were mostly seen in the age interval 50 to 84 where the Danish men had the highest mortality, followed by Finnish men. Danish women also had a higher mortality in the age interval 50 to 84, with no material differences between the other countries. For women ages 85 and over, Finnish women had the highest mortality and Icelandic women the lowest ().
Danish life expectancy from birth exhibited a lower increasing trend from the mid-1970s than in the other Nordic countries, with the exception of Finnish men in the last decade. The Finnish life expectancy has been historically lower than in the other Nordic countries, but rapid increases in the 1960s and 1970s have meant that by the year 2000, life expectancy at birth in Finland was at the same level as Iceland, Norway and Sweden among women, and at the Danish level among men ().
Presentation of results
For each cancer site, the results are described by two sets of default figures ( and ) and tables ( and ). For the purpose of illustration, results for the summary group all cancer sites but non-melanoma skin are presented here, unadjusted for case-mix. A more thorough discussion of results of this group with case-mix can be found elsewhere [Citation18]. describes concomitant trends in age-standardised incidence, mortality and 5-year relative survival over time in each Nordic country, by sex. Given the synergistic aspects of these indicators [Citation39], comparisons of survival trends alongside cancer incidence and mortality are vital to interpretation.
Figure 6. Trends in age-standardised (World) incidence and mortality rates per 100 000 and age-standardised (ICSS) 5-year relative survival for patients of all cancer sites but non-melanoma skin, unadjusted for case-mix by sex and country. Nordic cancer survival study 1964–2003.
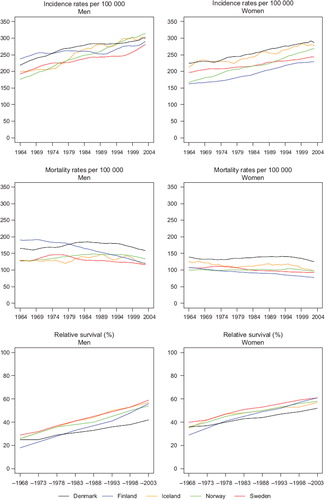
Figure 7. Trends in age-standardised (ICSS) excess deaths per 100 person years for patients of all cancer sites but non-melanoma skin, unadjusted for case-mix by sex and country. Nordic cancer survival study 1964–2003.
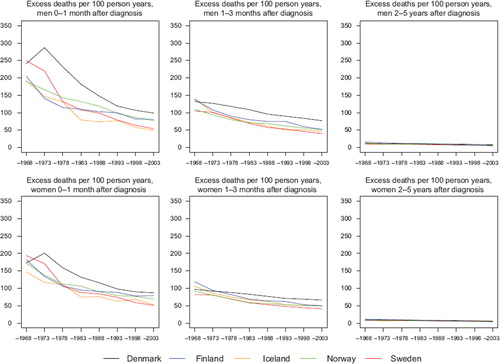
Table V. Trends in survival for cancer of all sites but non-melanoma skin (no case-mix adjustment) by sex and country. Number of tumours (N) included and the 5-year age-standardised (ICSS) relative survival in percent with 95% confidence intervals (RS (CI)). Nordic cancer survival study 1964–2003.
Table VI. Trends in 5-year age-specific relative survival in percent after cancer of all sites but non-melanoma skin (no case-mix adjustment) by sex and country. Nordic Cancer survival study 1964–2003.
presents the number of patients and 5-year relative survival over calendar periods of diagnosis by sex and country. The 5-year relative survival ratios (expressed as percentages) are supplemented with corresponding 95% confidence intervals. describes the trends in age-standardised excess deaths per 100 person years over time in three follow-up intervals after diagnosis: the first month, 1–3 months, and 2–5 years, by sex and country. The excess mortality rates were highest in the first month after diagnosis with a large decrease over calendar time, excess mortality rates 1–3 months after diagnosis were at a lower level and decreased with time, while the excess mortality curves were fairly flat, with only minor differences between countries, 2–5 years after diagnosis. Already from the 1990s the levels of the excess mortality rates in the first month and in the follow-up interval 1–3 months were rather similar within each of the combinations of country and sex, while in the first three months after diagnosis, Denmark had the highest excess mortality rates and the decrease over calendar time was not as large as was observed in the other countries.
presents 5-year age-specific relative survival in 5-year calendar periods by sex and country for age-groups 0–49, 50–59, 60–69, 70–79, 80–89, and 90+ years.
Comments - Discussion
Collecting and analysing data from five countries and 39 different sites over 40 years in a systematised and comparable way is a major undertaking. A thorough description of the analysis, definitions and exclusions in the survival analysis, supplemented with corresponding information on cancer incidence and mortality is needed for appropriate interpretation and comparison between countries, and between and within cancer sites. This information must be taken into account in interpreting the site-specific results. The NORDCAN database was utilised as the primary data source, a compendium of long-term and comparable data in each of the five Nordic countries, and we sought to compare cancer survival with incidence and mortality over a 40-year period.
The strengths of this study include the overall comparability and quality of the Nordic data, the national coverage, and the length of the time series. The Nordic countries have for many years provided cancer incidence registration through national cancer registries with compulsory notification and very high completeness as can be seen in successive volumes of Cancer Incidence in Five Continents [Citation40,Citation41]. Follow-up for death or emigration is considered reliable through the existence of national personal identification numbers and population registers.
In a series of cancer group-specific papers, we present 5-year relative survival for 40 cancer forms including two summary groups of all cancer sites but non-melanoma skin and all cancer sites but non-melanoma skin, prostate, and breast cancer. Differences by country and over time in the use of PSA testing and subsequent biopsy of prostate cancer and the varying start-up and coverage of population screening for breast cancer make exclusion of these cancers appropriate in summary comparisons of all cancers combined.
In 2003, the largest variation in population mortality between countries were observed in the age groups 60–84, irrespective of sex; the same ages where cancer is most frequent, with the highest mortality seen in Denmark. Mortality differences at the population level are adjusted for in the calculation of relative survival and excess mortality, but the differences between countries may additionally reflect variations in co-morbidity, that are predominantly induced by lifestyle factors including tobacco smoking and high levels of alcohol consumption. The levels in percentage of daily tobacco smokers and alcohol consumption have been highest in Denmark throughout the period with minor exceptions for Finnish men and early tobacco smoking among Icelandic women. A more thorough description can be seen in Storm et al. [Citation7]. Although not the only contributors, the patterns of tobacco and alcohol consumption by country are in accordance with trends in life expectancy, as well as the observed patterns of incidence and survival, and probably play an independent role in explaining some of the survival variations observed between countries.
We observed that 5- year relative survival increased over calendar time, with the most rapid increases seen in Finland and the least rapid in Denmark, with Danish survival lower than in the other countries during the last period of diagnosis studied. The improvement in prognosis over time and the survival differences between countries were most prominent within the first three months of diagnosis. The excess mortality in the first three months following diagnosis increased with age, and the variations between countries were especially high among the oldest age groups. While the country-specific differences between excess mortality rates in the first month and 1–3 months following diagnoses were large until the 1990s, the differences tended to diminish over time, implicating that in future studies of Nordic survival it will be sufficient to use the first three months after diagnosis as the first follow-up interval.
To facilitate comparison with other [Citation32,Citation42] and future studies, ICSS standard weights were used for age-standardisation [Citation30]. We modified the age intervals, however, to those we considered more adequate for the cancer population, i.e. 10-year age intervals for ages above 50, where most cancers are most frequent, and where the largest variations in excess mortality by age can be observed within the first year of diagnosis. Further, we used a weight of zero for ages 90 and above at diagnosis, corresponding to their exclusion, as diagnostics and treatment are likely to be used less frequently in this age group. We provided age-specific 5-year survival for the defined age intervals (including ages 90 and over) to facilitate studies of the age-specific trends. The EUROCARE-4 study included ages 15 to 99 with wider age intervals in the older ages (e.g. 15–44, 45–54, 55–64, 65–74, and 75–99 for most of the sites).
We included all primary tumours, rather than restrict the analysis to first primary tumours only, as practiced thus far in the EUROCARE studies [Citation31]. EUROCARE also used the tumour rank number recorded by the cancer registry for an individual patient. The effect of which for Finland was that patients with a previous basal cell carcinoma, or a pre-malignant lesion of the cervix, were excluded.
Comparing results for colon cancer in EUROCARE-4 with our data, restricted to the period 1995–99 and ages 15–99 for the five Nordic countries, showed relative survival between 0.5 and 1.6 percentage points lower than in EUROCARE-4, with the largest differences seen for Finland. To evaluate which part of methodology gave this effect we compared our method of age stratification and multiple primary tumour inclusion with that of EUROCARE-4, for tumours diagnosed 1999–2003. The use of either EUROCARE age-intervals or only first primary cancers induced an increase in 5-year relative survival of 1–2 percentage point compared with our methods; but using both gave the same increase (results not shown), and we may conclude that we need more systematic comparisons for other cancer sites as well. Another difference is the method of calculating expected deaths; EUROCARE-4 used the Hakulinen method while our study used Ederer II. For estimating and comparing short-term survival (e.g. up to 5 and 10-year survival) this should be of no material consequence [Citation23].
The lower excess mortality often seen in the first month following diagnosis in Sweden compared to the other Nordic countries could partly result from a lack of trace-back procedures initiated from death certificates [Citation43]. Since the Swedish Cancer Registry does not link death certificate information, this might bias the Swedish survival estimates upwards compared to the other Nordic countries.
The shortcomings of this study are that stratification of 5-year relative survival by stage, morphology, risk factors, or treatment was not included in the analyses presented. Stage is a very important prognostic factor in patient survival. In a recent Nordic study of rectal cancer, cancer registry information was supplemented with stage from clinical registries in Norway, Sweden and Denmark. A relative risk of 35 was reported for excess (cancer-related) death during a 5-year follow-up for stage IV patients compared to stage I [Citation44]. While some information on stage is available in the Danish, Finnish and Norwegian cancer registries, stage was not included as the classification systems are unlikely to be consistent between countries and over time. Stage migration with time may also have taken place as a result of more sophisticated diagnostic methods. Some patients who previously would have been classified in a “good” stage could with new methods be assigned to a “bad” stage. Because the prognosis of those who changed stage, although worse than that for other members of the good-stage group, was better than that for other members of the bad-stage group, survival rates rose in each group without any change in individual outcomes [Citation45]. Stage-migration has been seen in Norway in a previous study of colorectal cancer survival [Citation46].
Information about risk factors is generally not included in Cancer Registries, and only a few indicators of treatment modality are recorded. Even if treatment information could be included from hospital records or clinical registers, our experience is that comparable information remains difficult to attain in cross-national studies [Citation44].
This study has provided an account of the sources used and methods implemented in a survival analysis of the five Nordic countries 1964–2003 followed up until the end of 2006. It has included details of the inclusion and exclusion criteria, the concepts of mortality and survival and the use of cohort-hybrid approaches, age-standardisation, follow-up intervals, and adjustment for case-mix. It is important that the concepts are documented at this level of detail, as is the case here. The methodological choices directly impact on the country- and time-specific estimates, and thus on the interpretation of the site-specific results.
Acknowledgements
The Nordic Cancer Union (NCU) has financially supported the development of the NORDCAN database and program, as well as the survival analyses in this project.
Declaration of interest: The authors report no conflict of interest. The authors alone are responsible for the content and writing of the paper.
Related Research Data
References
- Engeland A, Haldorsen T, Tretli S, Hakulinen T, Hörte LG, Luostarinen T, . Prediction of cancer mortality in the Nordic countries up to the years 2000 and 2010, on the basis of relative survival analysis. A collaborative study of the five Nordic Cancer Registries. APMIS 1995;103(Suppl 49):1–161.
- Engeland A, Haldorsen T, Dickman PW, Hakulinen T, Möller TR, Storm HH, . Relative survival of cancer patients -- a comparison between Denmark and the other Nordic countries. Acta Oncol 1998;37:49–59.
- Berrino F, Sant M, Verdecchia V, Capocaccia R, Hakulinen T, Estève J. Survival of cancer patients in Europe: The EUROCARE Study. IARC Scientific Publication No.132. Lyon: IARC; 1995.
- Berrino F, Capocaccia R, Estève J, Gatta G, Hakulinen T, Micheli A, . Survival of cancer patients in Europe: The EUROCARE-2 Study. IARC Scientific Publication No.151. Lyon: IARC; 1999.
- Sundhedsstyrelsen. National kræftplan. Status og forslag til initiativer i relation til kræftbehandlingen. København: Sundhedsstyrelsen; 2000. 1–161.
- Engholm G, Ferlay J, Christensen N, Bray F, Ólafsdóttir E, Pukkala E, . NORDCAN: Cancer incidence, mortality and prevalence in the Nordic countries, Version 3.2. Association of Nordic Cancer Registries. Danish Cancer Society. 2008. http://www.ancr.nu.
- Storm HH, Engholm G, Hakulinen T, Tryggvadóttir L, , Klint ÅGislum M, . Survival of patients diagnosed with cancer in the Nordic countries up to 1999–2003 followed up to the end of 2006. A critical overview of the results. Acta Oncol 2010;49:532–44.
- Hakulinen T, Tryggvadóttir L, Gislum M, Storm HH, Bray F, , Klint Å. Trends in the survival of patients diagnosed with cancers of the lip, oral cavity, and pharynx in the Nordic countries 1964–2003 followed up to the end of 2006. Acta Oncol 2010;49:561–77.
- , Klint ÅEngholm G, Storm HH, Tryggvadóttir L, Gislum M, Hakulinen T, . Trends in survival of patients diagnosed with cancer of the digestive organs of the Nordic countries 1964–2003 followed up to the end of 2006. Acta Oncol 2010;49:578–607.
- Hakulinen T, Engholm G, Gislum M, Storm HH, , Klint ÅTryggvadóttir L, . Trends in the survival of patients diagnosed with cancer in the respiratory system in the Nordic countries 1964–2003 followed up to the end of 2006. Acta Oncol 2010;49:608–23.
- Tryggvadóttir L, Gislum M, Bray F, , Klint ÅHakulinen T, Storm HH, . Trends in the survival of patients diagnosed with breast cancer in the Nordic countries 1964–2003 followed up to the end of 2006. Acta Oncol 2010;49:624–31.
- , Klint ÅTryggvadóttir L, Bray F, Gislum M, Hakulinen T, Storm HH, . Trends in the survival of patients diagnosed with cancer in female genital organs in the Nordic countries 1964–2003 followed up to the end of 2006. Acta Oncol 2010;49:632–43.
- Bray F, , Klint ÅGislum M, Hakulinen T, Engholm G, Tryggvadóttir L, . Trends in survival of patients diagnosed with male genital cancers in the Nordic countries 1964–2003 followed up until the end of 2006. Acta Oncol 2010;49:644–54.
- Engholm G, Hakulinen T, Gislum M, Tryggvadóttir L, , Klint ÅBray F, . Trends in the survival of patients diagnosed with kidney or urinary bladder cancer in the Nordic countries 1964–2003 followed up to the end of 2006. Acta Oncol 2010;49:655–64.
- Tryggvadóttir L, Gislum M, Hakulinen T, , Klint ÅEngholm G, Storm HH, . Trends in the survival of patients diagnosed with malignant melanoma of the skin in the Nordic countries 1964–2003 followed up to the end of 2006. Acta Oncol 2010;49:665–72.
- Bray F, Engholm G, Hakulinen T, Gislum M, Tryggvadóttir L, Storm HH, . Trends in survival of patients diagnosed with cancers in the brain and nervous system, thyroid, eye, bone, and soft tissues in the Nordic countries 1964–2003 followed up until the end of 2006. Acta Oncol 2010;49:673–93.
- Storm HH, , Klint ÅTryggvadóttir L, Gislum M, Engholm G, Bray F, . Trends in the survival of patients diagnosed with malignant neoplasms of lymphoid, haematopoietic, and related tissue in the Nordic countries 1964–2003 followed up to the end of 2006. Acta Oncol 2010;49:694–712.
- Storm HH, Kejs AMT, Engholm G, Tryggvadóttir L, Klint Å, Bray F, . Trends in the overall survival of cancer patients diagnosed 1964–2003 in the Nordic countries followed up to the end of 2006: The importance of case-mix. Acta Oncol 2010;49:713–24.
- Engholm G, Ferlay J, Christensen N, Bray F, Gjerstorff ML, Klint Å, . NORDCAN – a Nordic tool for cancer information, planning, quality control and research. Acta Oncol 2010;49:725–36.
- Bray F, Parkin DM. Evaluation of data quality in the cancer registry: Principles and methods. Part I: Comparability, validity and timeliness. Eur J Cancer 2009;45:747–55.
- Ederer F, Axtell LM, Cutler SJ. The relative survival rate: A statistical methodology. Natl Cancer Inst Monograph 1961;6: 101–21.
- Estève J, Benhamou E, Raymond L. Statistical methods in cancer research Volume IV: Descriptive epidemiology. IARC Scientific Publications No. 128. International Agency for Research on Cancer: Lyon; 1994. 235–6.
- Hakulinen T. Cancer survival corrected for heterogeneity in patient withdrawal. Biometrics 1982;38:933–42.
- Dickman PW, Sloggett A, Hills M, Hakulinen T. Regression models for relative survival. Stat Med 2004;23:51–64.
- Brenner H, Rachet B. Hybrid analysis for up-to-date long-term survival rates in cancer registries with delayed recording of incident cases. Eur J Cancer 2004;40:2494–501.
- Cancer Survival Group. strel Computer program Version 5.8 for Cancer Survival Analysis. London School of Hygiene and Tropical Medicine. 2006. Available from: www.lshtm.ac.uk/ncdeu/cancersurvival/tools.htm
- Human Mortality Database. University of California, Berkeley (USA), and Max Planck Institute for Demographic Research (Germany). [cited 2009 June 10]. Available from: www.mortality.org or www.humanmortality.de
- Segi M, Kurihara M. Cancer mortality for selected sites in 24 countries (1950–1957). Sendai: Tohoku University of Medicine; 1960.
- Doll R, Cook P. Summarizing indices for comparison of cancer incidence data. Int J Cancer 1967;2:269–79.
- Corazziari I, Quinn M, Capocaccia R. Standard cancer patient population for age standardising survival ratios. Eur J Cancer 2004;40:2307–16.
- De Angelis R, Francisci S, Baili P, Marchesi F, Roazzi P, Belot A, . The EUROCARE-4 database on cancer survival in Europe: Data standardisation, quality control and methods of statistical analysis. Eur J Cancer 2009;45: 909–30.
- Coleman MP, Quaresma M, Berrino F, Lutz JM, De Angelis R, Capocaccia R, . Cancer survival in five continents: A worldwide population-based study (CONCORD). Lancet Oncol 2008;9:730–56.
- Engholm G, Kejs AM, Brewster DH, Gaard M, Holmberg L, Hartley R, . Colorectal cancer survival in the Nordic countries and the United Kingdom: Excess mortality risk analysis of 5 year relative period survival in the period 1999 to 2000. Int J Cancer 2007;121:1115–22.
- Heinävaara S, Sankila R, Storm H, Langmark F, Hakulinen T. Relative survival of patients with prostate cancer as a first or subsequent tumor – a Nordic collaborative study. Cancer Causes Control 2002;13:797–806.
- Brenner H, Hakulinen T. Patients with previous cancer should not be excluded in international comparative cancer survival studies. Int J Cancer 2007;121;2274–8.
- Rosso S, De Angelis R, Ciccolallo L, Carrani E, Soerjomataram I, Grande E, . Multiple tumours in survival estimates. Eur J Cancer 2009;45:1080–94.
- Kvåle R, Auvinen A, Adami HO, Klint A, Hernes E, Møller B, . Interpreting trends in prostate cancer incidence and mortality in the five Nordic countries. J Natl Cancer Inst 2007;99:1881–7.
- Mattsson B, Wallgren A. Completeness of the Swedish cancer register – Non-notified cancer cases recorded on death certificates in 1978. Acta Radiol Oncol 1984;23:305–13.
- Boyle P. Relative value of incidence and mortality data in cancer research. Recent Results Cancer Res 1989;114: 41–63.
- Parkin DM, Whelan SL, Ferlay J, Storm HH. Cancer incidence in five continents, Vol. I to VIII. IARC Cancer Base No. 7. IARC: Lyon; 2005.
- Curado MP, Edwards B, Shin HR, Storm HH, Ferlay J, Heanue M, . Cancer incidence in five continents, Vol. IX. IARC Scientific Publications No. 160. IARC: Lyon; 2007.
- Sant M, Allemani C, Santaquilani M, Knijn A, Marchesi F, Capocaccia R, . EUROCARE-4. Survival of cancer patients diagnosed in 1995–1999. Results and commentary. Eur J Cancer 2009;45:931–91.
- Robinson D, Sankila R, Hakulinen T, Møller H. Interpreting international comparisons of cancer survival: The effects of incomplete registration and the presence of death certificate only cases on survival estimates. Eur J Cancer 2007;43: 909–13.
- Folkesson J, Engholm G, Ehrnrooth E, Kejs AM, Påhlman L, Harling H, . Rectal cancer survival in the Nordic countries and Scotland. Int J Cancer 2009;125:2406–12
- Feinstein AR, Sosin DM, Wells CK. The Will Rogers phenomenon. Stage migration and new diagnostic techniques as a source of misleading statistics for survival in cancer. N Engl J Med 1985;312:1604–8.
- Angell-Andersen E, Tretli S, Coleman MP, Langmark F, Grotmol T. Colorectal cancer survival trends in Norway 1958–1997. Eur J Cancer 2004;40:734–42.