Abstract
The NORDCAN database and program (www.ancr.nu) include detailed information and results on cancer incidence, mortality and prevalence in each of the Nordic countries over five decades and has lately been supplemented with predictions of cancer incidence and mortality; future extensions include the incorporation of cancer survival estimates. Material and methods. The data originates from the national cancer registries and causes of death registries in Denmark, Finland, Iceland, Norway, Sweden, and Faroe Islands and is regularly updated. Presently 41 cancer entities are included in the common dataset, and conversions of the original national data according to international rules ensure comparability. Results. With 25 million inhabitants in the Nordic countries, 130 000 incident cancers are reported yearly, alongside nearly 60 000 cancer deaths, with almost a million persons living with a cancer diagnosis. This web-based application is available in English and in each of the five Nordic national languages. It includes comprehensive and easy-to-use descriptive epidemiology tools that provide tabulations and graphs, with further user-specified options available. Discussion. The NORDCAN database aims to provide comparable and timely data to serve the varying needs of policy makers, cancer societies, the public, and journalists, as well as the clinical and research community.
The wealth of high quality information available from the Nordic cancer registries is well established. A series of projects supported by the Nordic Cancer Union (NCU) since the 1970s have addressed topics such as time trends in incidence [Citation1,Citation2], the geographic distribution of cancer (cancer atlases) [Citation3,Citation4], future predictions of cancer incidence and mortality burden [Citation5–8], cancer survival [Citation7,Citation9], avoidable cancers [Citation10] and the effectiveness of screening [Citation11]. Information about cancer incidence, mortality, prevalence, and survival combined with studies on risk factors and the quality of treatment and cancer care are a sound basis for comprehensive cancer control plans, as a means of providing situation analyses, and an assessment of the need for specific actions and the impact of subsequent interventions.
The need for an easily accessible and comprehensive graphical and statistical tool providing descriptive epidemiological analyses of the data is obvious and the idea to develop NORDCAN was conceived from this principle with a pilot version in 2002 [Citation12] and a full version in 2003 [Citation13]. The ambition was to provide a cancer database available for research, complete with comparable and timely data from each of the Nordic countries in a way that was user-friendly and satisfied most of the needs of policy makers, cancer societies, medical professionals, journalists, and the general public. The project has from the onset been a joint activity of the Association of Nordic Cancer Registries (ANCR) and the International Agency for Research on Cancer (IARC), with financial support from the Nordic Cancer Union (NCU). Data for NORDCAN are delivered from the national cancer registries and the database and program have been developed in collaboration with the Cancer Information Section at IARC. The NORDCAN project group comprises of representatives from each of these organisations and they are the authors of this report. The group meets regularly to discuss further improvements in the quality of the Registry data and the functionality of the software. In this paper, the NORDCAN database version 3.5 [Citation14] and the facilities of the NORDCAN program are described. NORDCAN can be accessed at http://www.ancr.nu.
Material and methods
Data sources
Cancer registration in the Nordic countries. Each of the Nordic countries has nationwide population-based cancer registration. The Danish Cancer Registry is the oldest, founded in 1942. The Norwegian, Finnish, and Icelandic Cancer Registries were founded 1952–1954, and the Swedish Cancer Registry in 1958. The registry from the Faroe Islands had been functional during some periods since the 1960s and was re-established in 1994 [Citation15].
Notification of cancer has become mandatory in all of the Nordic countries and a high degree of comparability and validity has been documented in a special survey comparing the practices of the registries [Citation16]. Close to 100% coverage of incident cases has been reported in each of the registries in peer-reviewed journals [Citation2,Citation17–21].
Cancer is reported in the Nordic countries from multiple sources, including physicians, hospitals, institutions with hospital beds, pathological and cytological laboratories, and by linkage with and between administrative health/disease registers (pathology registers, inpatient hospital registers). Registration methods have been fairly similar between countries [Citation22]. Notification of cancers is centrally handled in all countries other than Sweden where six regional registries provide data to the central cancer registry.
In each country the registration of causes of death is mandatory in the national causes of death registries. The national central population registries issue a unique personal identification number to all persons at birth or immigration which is used as a reliable means to link information on individuals across registers, including follow-up for death or emigration. Personal identification numbers were introduced in Sweden in 1947, in Iceland 1953, Norway 1964, Finland 1967, and in Denmark in 1968. Before then the key identifiers for a person were name and date of birth.
Since 2004, the Danish Cancer Registry has been based on linkage of the national patient register, the national register for pathology, and the national cause of death registry, supplemented with notifications from general practice [Citation23]. In all countries except Sweden, additional incident cases are found through linkage with the national causes of death registers. Each of the five Nordic registries has been included in Cancer Incidence in Five Continents (CI5) – a compendium of cancer incidence data from registries evaluated to have high quality data – from Volume I, covering the years 1958–1962 [Citation24], through to Volume IX, covering the years 1998–2002 [Citation25].
Data conversion to ensure comparability
The Nordic cancer registries have been in close contact over the years and co-operation between registries has ensured a high degree of comparability in practices of registration. To be able to compare cancer incidence temporally between countries however, requires a uniform coding system applicable to data from each Registry. For many years the seventh revision of the International Classification of Diseases (ICD-7) [Citation26] was used, and even after adapting versions of ICD-O for coding incidence in the Registries, conversion to ICD-7 was made to ensure comparability in coding over time and this was the basis for joint analyses between countries. The paradigm has therefore been that the data were reasonably comparable between registries and free from artefact. Some unexpected results in a study comparing relative survival of cancer patients in the Nordic countries [Citation9], though, led to the initiation of the survey of the Nordic cancer registries to describe in detail the differences and similarities in practices between countries [Citation16].
shows the consecutive ICD volumes used in each country. To overcome the differences in registration between countries and over time, a conversion to an international standard using the same rules was developed. The national incidence data were, in cooperation with each of the registries, first recoded to ICD-O-3 [Citation27] and then to ICD-10 [Citation28] using the international rules in IARCcrgTools [Citation29]. To further facilitate comparisons between countries and over time the IARC/IACR multiple primary rules [Citation30] in IARCcrgTools were applied to each of the datasets. Consequently, the number of cancers presented in NORDCAN may differ slightly from those published by the national cancer registries. At present, each of the registries uses ICD-O-3 [Citation27] in coding tumours and except for Sweden their data have retrospectively been converted to ICD-O-3. In Denmark this procedure was applied back to 1978 and in the other countries to the initial year of complete registration. Basal cell skin cancers are excluded from the NORDCAN database as recording is considered heterogeneous and known to be incomplete [Citation31].
Table I. ICD versions used for incidence coding in the Nordic cancer registries over time.
The cancer dictionary – the format for which the original data are presented as specific entities in NORDCAN – is based on ICD-10 [Citation28]. Since the original incidence data were coded according to earlier versions of the classification, it was necessary to combine some site codes in ICD-10 to ensure comparable data over the years and some of these deviate somewhat from the categories used in international publications such as CI5 [Citation25]. As with CI5, non-melanoma skin cancers are excluded from the “all cancers combined” category. In the codes defining the entities can be seen according to ICD-10 as well as the previously used ICD-7 [Citation26].
Table II. Cancer dictionary in NORDCAN based on ICD-10 with corresponding ICD-7 codes.
While this recoding ensures a high degree of comparability between the Nordic countries, inherent differences in coding procedure and sources in each Registry ensure that some dissimilarities remain. The differences can mainly be found for cancers of the bladder, brain and central nervous system, as well as non-melanoma skin. For bladder tumours, coding practice varies over time and country concerning the inclusion of non-invasive tumours, for brain and central nervous system tumours variation might occur with the inclusion of benign or unspecified tumours, and non-melanoma skin cancer in Denmark included basal cell carcinoma in the period 1943–1977 [Citation16].
Mortality statistics are derived from the registration of primary (underlying) cause of death in the national Causes of Death Registries, except for Finland where the cancer mortality data are based on the cancer register record indicating whether the patient died from the registered cancer. As for incidence, classifications for mortality differ between countries and change over the years as can be seen in ; a similar conversion procedure as for incidence has been implemented in NORDCAN.
Table III. ICD versions used for mortality coding in the Nordic causes of death registers over time.
Rapid changes in incidence and mortality rates of specific cancers suggest internal changes in the ICD classification and coding within a Registry. Trends may have some comparability problems between countries (e.g. bladder cancer) and the generally higher specificity with each ICD version can lead to conversion problems over time when the new entities span over more sites than defined by the previous ICD-version (e.g. liver cancer) [Citation32]. More specific details about historical coding practices in each country can be obtained from the survey of the Nordic cancer registries [Citation16].
Statistical methods
Cancer incidence, mortality and prevalence: Definitions. Incidence is the number of new cases arising in a given period in a specified population. For cancer, the result is usually expressed as an annual rate per 100 000 person-years. In NORDCAN, five-year age categories are used (with highest age group, 85 and over). The age-specific rate provides an approximation of the average risk of developing a cancer in that age-group.
Mortality is the number of deaths occurring in a given period in a specified population and the mortality rate approximates the average risk of dying from the cancer.
Prevalence of a specific cancer can be defined as the number of persons in a defined population who have been diagnosed with that type of cancer, and who are still alive at the end of a given year. In the Nordic countries, prevalence can be counted by the end of each year due to the reliable follow-up for death or emigration routinely obtained by linkage to the national population registers. Different counts of partial prevalence can be made. One-year prevalence is the number of persons diagnosed with a specific cancer in a year and still alive at the end of that year. Other lengths of time since diagnosis available in NORDCAN are three, five, and 10 years. For a number of cancer types, these partial prevalence measures are of particular relevance to different stages of cancer therapy, namely, initial treatment (one year), clinical follow-up (three years), and cure (five years). To count total prevalence, extended time series are necessary, and as a result, the total prevalence in NORDCAN is reported from 20 years after the specific registry's initiation. Prevalence in the Faroe Islands is not available since date of death is missing for a few cancer patients.
Presentation in NORDCAN
NORDCAN shows sex-specific incidence and mortality numbers and rates, as well as prevalence numbers and proportions.
The data can be presented in NORDCAN as:
1. tables that can be exported to a text file for further use in other programs or saved as a pdf file.
2. graphic files that can be saved with a right click on the image, and by selecting the ‘Save Image as...’ option. The selected figures can be saved as png files, be printed, or copied directly to other packages.
Statistical facilities in NORDCAN
Incidence and mortality. Since age distributions vary over time and between populations, crude rates are usually not considered to be good measures for comparison because age has such strong influence on the risk of cancer. To overcome this, rates are commonly age-standardised, and an age-standardised rate (ASR) is a measure of the rate that a population would have, were it to have a standard age structure. The ASR is a weighted mean of the age-specific rates (usually in 5-year groups); the weights are derived from a population distribution known as the standard population. The most frequently used of these is the World Standard Population, as first used in the first Volume of CI5 [Citation24], adapted by Doll [Citation33] from earlier work by Segi [Citation34]. The resulting age-standardised incidence or mortality rate, ASR(W), is expressed per 100 000. The European standard ASR(E) is also often used and resembles the age distribution of the Scandinavian population in the 1950s [Citation24]. A third option in NORDCAN is the Nordic standard ASR(N) based on the age-distribution in the Nordic population in 2000.
Another useful measure for comparison between countries and over time with a more intuitive interpretation is the cumulative risk in a chosen age range [Citation35]. It can be interpreted as the risk of cancer diagnosis within the selected age range in the absence of competing causes of death.
Prevalence. Besides the number of prevalent cancer patients, NORDCAN provides a measure of cancer prevalence as the proportion in a population with a previous cancer diagnosis at a specified point in time, presented as the number of persons per 100 000 persons alive. For comparisons between countries and over time, the population proportions can also be age-standardised using one of the three standard populations available for the age-standardisation of incidence and mortality.
Time trends in NORDCAN. The inherent random variation in the number of cancer cases, mortality, or prevalence over time can make the evaluation of trends difficult. As part of the graphical facilities, it is therefore possible to smooth numbers, rates, or proportions by three or five years by calculating the average over three or five years. A measure that quantifies a selected incidence or mortality time trend is also available as an estimated annual percentage change (EAPC). It is calculated by fitting a simple regression model to the log of the statistic of interest (rates or numbers).
Cancer rates may differ over calendar time (so-called period effects) and between different generations (birth cohort effects). Cohort effects may relate to birth in itself, or may approximate factors related to birth by exerting influences that are shared in the same group as they age together. An examination of rates by birth cohort may provide valuable insight into the nature and intensity of disease-correlated exposures that vary across successive generations. In contrast, period effects are characterised by an immediate or fixed-delayed change in the incidence rates for all age groups [Citation36], and thus may act as surrogate measures of events that quickly change rates with the same order of magnitude across all affected age groups under study. Often they transpire from changes in classification criteria or the availability of new diagnostic tests, although the introduction of a powerful carcinogen or a screening intervention (affecting all study age groups) may also show up as a period effect. A facility for graphically portraying trends by birth cohort and calendar period by age group is available within NORDCAN.
Predictions. A module for the prediction of incidence and mortality has been implemented in NORDCAN. Predictions of incidence for breast and prostate cancer (and thus all cancers) are not available due to the specific impact of screening-related activities on the recent incidence rates. Short-term predictions up to five years ahead are available using simple log-linear models [Citation37–39], while longer-term predictions up to 20 years ahead (and in 5-year periods) are available using the age-period-cohort methods available in NORDPRED [Citation40,Citation41]. For a user-selected combination of data type, country, cancer, and sex and a specification of the latest year of observation to be included in the prediction base, results are presented by age groups and for all ages combined. Prediction intervals are available for the specified prediction year using the short-term methods. Graphical representation of the results is also provided. The change in the number of predicted cancer cases or deaths compared to the chosen latest year (short-term) or period (long-term) of observation, is, for each predicted year or period, further partitioned into that due to change in risk (e.g. changes in rates) and that due to changes in demographics (e.g. changes in population growth and ageing).
Results
The six countries comprising the Nordic countries represent a total population of nearly 25 million in 2007. Sweden is the largest with a population slightly greater than 9 million. Denmark, Finland, and Norway all have populations around 5 million, while Iceland has about 300 000 inhabitants and the Faroe Islands almost 50 000. More than 130 000 incident cancers are diagnosed in the Nordic countries each year, nearly 60 000 cancer deaths are reported, and almost a million residents alive at the end of 2007 had at least one diagnosis of cancer.
A guide to using NORDCAN with examples
The NORDCAN database and program describes the cancer incidence, mortality, and prevalence in the Nordic populations from the first year of complete cancer registration through to the most recently-published year, by sex, calendar year, and age of diagnosis, and for temporal comparisons, by birth cohort. Forty one groups of cancer diagnoses are available as entities in the NORDCAN dictionary and the database is updated twice a year. The NORDCAN program is based on aggregated counts and not individual records.
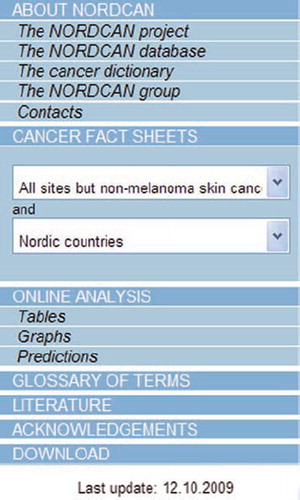
The web version of the NORDCAN program can be found at www.ancr.nu. On selecting the online version, a map of the Nordic countries is shown together with a choice of languages (English, Danish, Finnish, Icelandic, Norwegian, and Swedish are available) by clicking on the respective flag. The menu provides links to further information on NORDCAN, Cancer Fact Sheets, Online analysis, and a Glossary of terms. Requests for cancer fact sheets or online analyses are carried out via the IARC server which hosts NORDCAN. The main menu is illustrated in .
Figure 1. The main menu in NORDCAN.
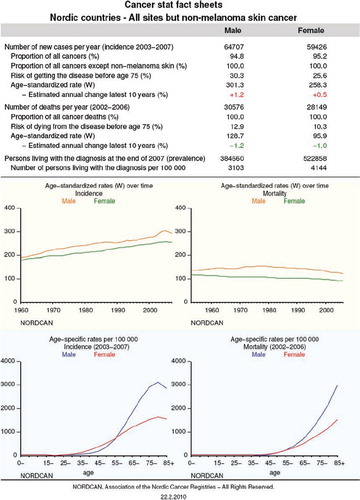
Cancer fact sheets are available for each combination of population and diagnosis group and provide an overview of the key statistics in terms of incidence and mortality for the latest 5-year period and prevalence by the end of the incidence period, with graphics displaying time trends and age-specific rates, and a fact sheet can be saved as a pdf file. shows the current fact sheet for the Nordic countries for all sites but non-melanoma skin cancer.
Figure 2. Cancer fact sheet for all cancer sites but non-melanoma skin in the Nordic countries from NORDCAN.
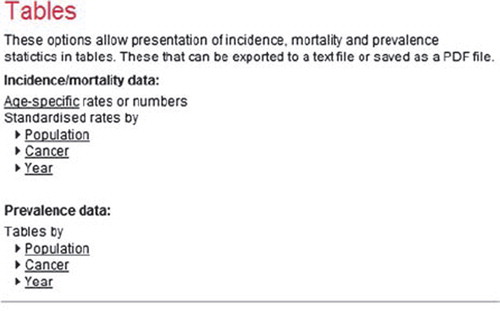
Online analyses are available as tables and graphs and include a prediction module, as described above. The types of tables available are shown in .
Figure 3. The available types of online tables in NORDCAN.
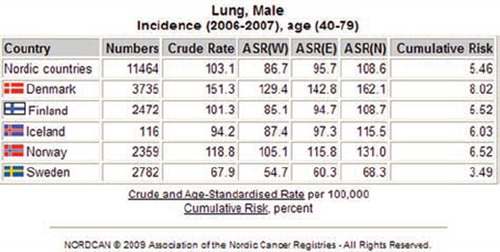
On choosing either tabular or graphical features, a sub-menu will emerge where the user can select the cancer type or population, years, sex, data type, and age range with further options specifying the look of output. shows the sub-menu for standardised rates by cancer and presents the output on selecting lung cancer incidence in men diagnosed at the ages 40 to 79 for the years 2006–2007, sorted by country. Tables can be saved as text and pdf files.
Figure 4. Submenu for tables of standardised rates by cancer in NORDCAN, and the selection of lung cancer incidence among men age 40–79 in years 2006–2007 by country.
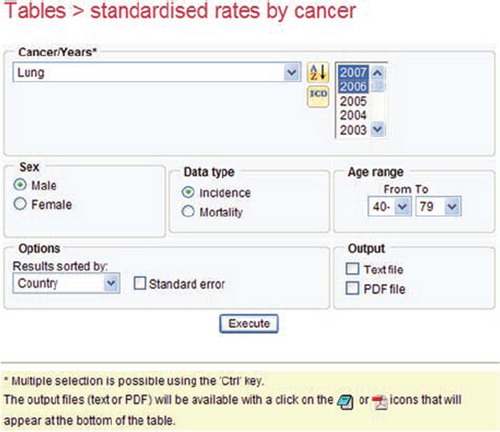
Figure 5. Age-standardised (World) incidence rates for lung cancer among men age 40–79 in 2006–2007 by country in NORDCAN.
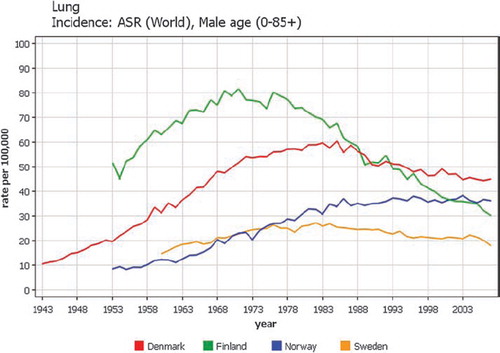
The types of online graphs available in NORDCAN can be seen in . The sub-menu for time trends is shown in , and the results of displaying lung cancer among men, for trends from the first to last available years, using the World standard for all age groups in .
Figure 6. The available types of online graphs in NORDCAN.
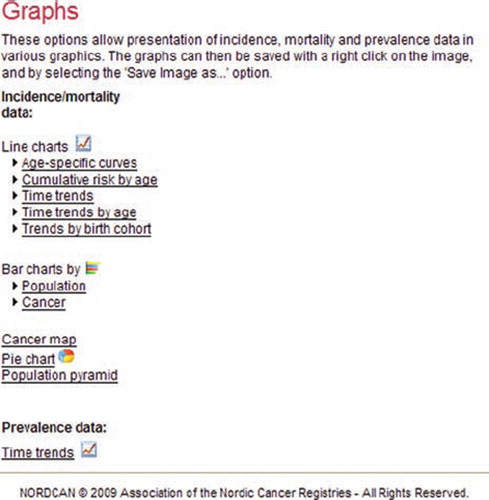
Figure 7. Submenu for graphs depicting time trends in age-standardised incidence rates, and the selection of lung cancer among men in Denmark, Finland, Norway, and Sweden in NORDCAN.
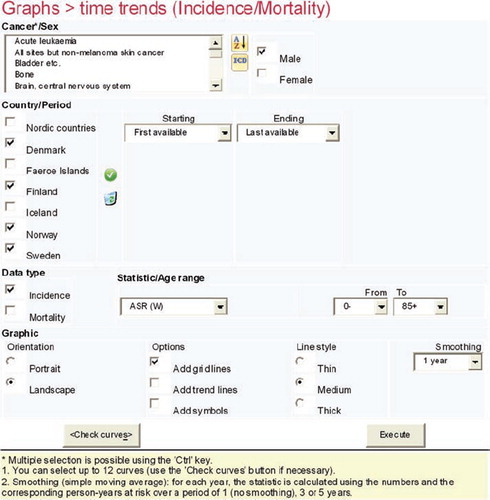
Figure 8. Time trends 1943–2007 in age-standardised (World) incidence rates of lung cancer among men in Denmark, Finland, Norway, and Sweden.
Other available graphics include bar charts by population or cancer, pie charts for the eight most common cancers, and population pyramids.
Cancer maps are not part of the web-version, but the web-version of NORDCAN provides links to animated cancer maps 1971–2003, based on incidence for 12 cancers and mortality from 10 cancers distributed by municipalities [Citation42,Citation43].
For prevalence, similar sub-menus for tables and graphics can be found.
Discussion
A primary focus of NORDCAN has been to provide comparable and timely cancer data from each of the Nordic countries together with specific descriptive analyses that serve most of the needs of policy makers, cancer societies, journalists, the general public, as well as the medical profession and researchers, in English and in the five national languages. The cancer fact sheets have proven useful in providing an overview of the specific impact of cancer on a specific population. The Danish fact sheets have been used, for example, in supplying statistics on specific cancers directly to the website of the Danish Cancer Society, via a link to the specified address.
For generating hypotheses for further research, NORDCAN provides a simple and rapid tool to examine specific geographical or temporal analyses of a cancer site of interest in one or more of the Nordic populations. A researcher in need of a download of the aggregated NORDCAN data may approach the Secretariat in Denmark or approach the Nordic cancer registries to discuss the options and the research protocol needed for access to individual data.
The cases illustrated in –11 supply a few examples for which explanations of the underlying observations are well understood. The trends in lung cancer incidence for men in the Nordic countries reflect the history of the tobacco smoking epidemic (). Finnish men started to smoke earlier than men in the other Nordic countries, but regulations also started earlier, resulting in a decrease in incidence already from 1970 [Citation44].
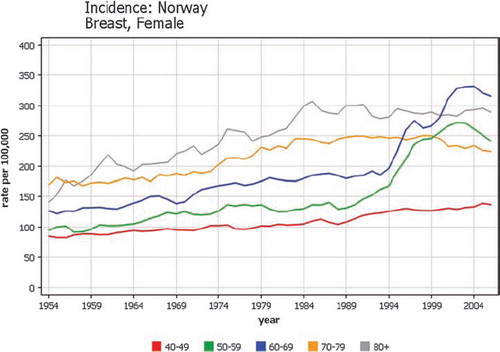
Breast cancer screening programmes are now offered in all the Nordic countries. With the start of a programme, breast cancers become detectable at an earlier stage inducing a higher number of detected cancers. shows a steep increase in the age-specific trends in ages 50–69 in Norway where breast cancer screening started in four counties in 1995–1996 [Citation45]. It was followed by a decrease in the rate for age-group 70–74 when these women were no longer screened.
Figure 9. Time trends by age of diagnosis 1943–2007 of female breast cancer incidence in Norway.
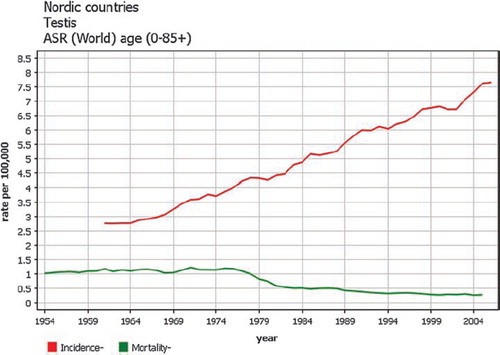
Incidence of testicular cancer has increased steadily over the years [Citation46,Citation47], but effective treatment combining surgery and radiation with modern chemotherapy introduced from the mid-seventies in all countries led to sharp declines in mortality () [Citation47].
Figure 10. Time trends 1943–2007 in age-standardised (World) testicular cancer incidence and mortality rates in the Nordic countries.
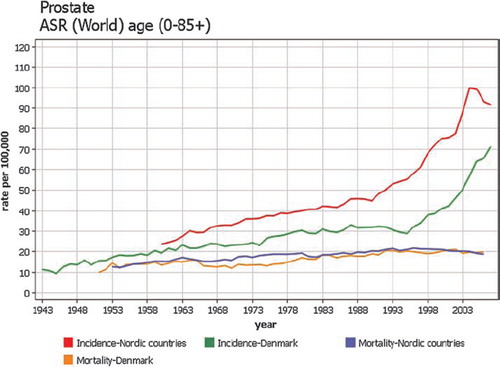
Prostate cancer incidence increased with an increased use of PSA-measurements and subsequent biopsy as part of the diagnostic process, but with a later adoption in Denmark [Citation48]. In absolute terms the current mortality rates are rather similar between countries ().
Figure 11. Time trends 1943–2007 in age-standardised (World) prostate cancer incidence and mortality rates in Denmark and the Nordic countries.
PC-based version of NORDCAN
The first PC version of NORDCAN originates from 2002 and was first supplemented by an online version in 2007. The PC version is useful for specific purposes given that it allows the further subdivision of data into counties, a possibility of grouping cancer sites or counties, more flexible choice of tables and reports, and the possibility of modifying the appearance of graphs. Cancer maps of the Nordic countries combined and for each country are also included. Development stopped with the 2.4 version covering years 1972–2006 [Citation49].
Future developments
The focus will be on updating and improving the web-based version of NORDCAN. The database will continue to be updated twice a year, while menus for selecting tables and graphs will be further developed. Ideas for improvement are most welcome. In the case where more detailed analyses are required, NORDCAN has a password-only download facility of cancer incidence and mortality data along with corresponding person-year data aggregated by cancer type, year, sex, and 5-year age group. The password (of time-limited duration) should be requested from the NORDCAN Secretariat.
The Nordic cancer registries have longstanding experience in the joint publication of analyses of cancer patient survival as well as predictions of the future cancer incidence and mortality burden. The series of papers included in this volume of Acta Oncologica examine trends in Nordic cancer survival based on patient diagnoses 1964–2003 followed up to the end of 2006. The next steps for NORDCAN include the provision of key survival information and links, both online and in the fact sheets, based on this volume.
Acknowledgements
The Nordic Cancer Union (NCU) has financially supported the development of the NORDCAN database and program. The IARC hosts the NORDCAN web application.
Declaration of interest: The authors report no conflict of interest. The authors alone are responsible for the content and writing of the paper.
Related Research Data
References
- Hakulinen T, Andersen A, Malker B, Pukkala, E, Schou G, Tulinius H. Trends in cancer incidence in the Nordic countries. A collaborative study of the five Nordic Cancer Registries. APMIS 1986;94(Suppl 288):1–151.
- Tulinius H, Storm, HH, Pukkala E, Andersen A, Ericsson J. Cancer in the Nordic countries 1981–86. A joint publication of the five Nordic Cancer Registries. APMIS 1992;100(Suppl 31):1–194.
- Jensen OM, Carstensen B, Glattre E, Malker B, Pukkala E, Tulinius H. Atlas of cancer incidence in the Nordic countries, Helsinki: Nordic Cancer Union; 1988.
- Pukkala E, Söderman B, Okeanov A, Storm HH, Rahu M, Hakulinen T, . Cancer atlas of Northern Europe. Helsinki: Cancer Society of Finland; 2001. Available from: http://www.cancerregistry.fi/atlasweb/index.htm.
- Wiklund K, Hakulinen T, Sparén P. Prediction of cancer mortality in the Nordic Countries in 2005: Effects of various interventions. Eur J Cancer Prev 1992;1:247–58.
- Engeland A, Haldorsen T, Tretli S, Hakulinen T, Hörte LG, Luostarinen T, . Prediction of cancer incidence in the Nordic countries up to the years 2000 and 2010. A collaborative study of the five Nordic Cancer Registries. APMIS 1993;101(Suppl 38):1–124.
- Engeland A, Haldorsen T, Tretli S, Hakulinen T, Hörte LG, Luostarinen T, . Prediction of cancer mortality in the Nordic countries up to the years 2000 and 2010, on the basis of relative survival analysis. A collaborative study of the five Nordic Cancer Registries. APMIS 1995;103(Suppl 49):1–161.
- Møller B, Fekjaer H, Hakulinen T, Tryggvadóttir L, Storm HH, Talbäck M, . Prediction of cancer incidence in the Nordic countries up to the year 2020. Eur J Cancer Prev 2002;11(Suppl 1):S1–S96.
- Engeland A, Haldorsen T, Dickman PW, Hakulinen T, Möller TR, Storm HH, . Relative survival of cancer patients—a comparison between Denmark and the other Nordic countries. Acta Oncol 1998;37:49–59.
- Olsen JH, Andersen A, Dreyer L, Pukkala E, Tryggvadóttir L, Gerhardsson de Verdier M, . Avoidable cancers in the Nordic countries. APMIS 1997;105(Suppl 76):1–146.
- Hristova L, Hakama M. Effect of screening for cancer in the Nordic countries on deaths, cost and quality of life up to the year 2017. Acta Oncol 1997;36(Suppl 9):1–60.
- Association of Nordic Cancer Registries. NORDCAN: Cancer incidence and mortality in the Nordic countries. Years 1973–97. Version 1.0. Danish Cancer Society. Copenhagen; 2002. Electronic publication.
- Storm H, Engholm G, Ferlay J, Langmark F, Ólafsdóttir E, Pukkala E, . NORDCAN: Cancer incidence and mortality in the Nordic countries, Version 2.0. Years 1970–99. Danish Cancer Society. Copenhagen, 2003. Electronic publication.
- Engholm G, Ferlay J, Christensen N, Bray F, Gjerstorff ML, Klint Å, . NORDCAN: Cancer incidence, mortality, prevalence, and prediction in the Nordic countries, Version 3.5. Association of Nordic Cancer Registries. Danish Cancer Society 2009. Available from: http://www.ancr.nu.
- Dalberg J, Jacobsen O, Storm HH, Egholm M, Niclasen SD, Joensen HD, . [Cancer registration in the Faeroe Islands]. Ugeskr Laeger 1998;160:3058–62.
- ANCR. Survey of Nordic cancer registries. Danish Cancer Society, Copenhagen, Denmark 2000. Available from: http://www.ancr.nu/survey.asp. 1–261.
- Storm HH, Michelsen EV, Clemmensen IH, Pihl J. The Danish Cancer Registry—history, content, quality and use. Dan Med Bull 1997;44:535–9.
- Teppo L, Pukkala E, Lehtonen M. Data quality and quality control of a population-based cancer registry. Experience in Finland. Acta Oncol 1994;33:365–9.
- Larsen IK, Småstuen M, Johannesen TB, Langmark F, Parkin DM, Bray F, . Data quality at the Cancer Registry of Norway: An overview of comparability, completeness, validity and timeliness. Eur J Cancer 2009;45:1218–31.
- Mattsson B, Wallgren A. Completeness of the Swedish cancer register. Non-notified cancer cases recorded on death certificates in 1978. Acta Radiol Oncol 1984;23:305–13.
- Barlow L, Westergren K, Holmberg L, Talbäck M. The completeness of the Swedish Cancer Register: A sample survey for year 1998. Acta Oncol 2009;48:27–33.
- Lund EM, Clemmesen IH, Storm HH. Survey of Nordic cancer registries. ANCR. Survey of Nordic cancer registries. Danish Cancer Society, Copenhagen, Denmark 2000. Available from: http://www.ancr.nu/survey.asp. 7–18.
- Sundhedsstyrelsen, Sundhedsdokumentation. Det moderniserede Cancerregister – metode og kvalitet. Copenhagen, Denmark 2010. Available from: www.sst.dk.
- Doll R, Payne P, Waterhouse J. Cancer incidence in five continents: A technical report. Berlin: Springer-Verlag (for UICC); 1966.
- Curado MP, Edwards B, Shin HR, Storm HH, Ferlay J, Heanue M, . Cancer incidence in five continents, Vol. IX. IARC Scientific Publications No. 160. Lyon: IARC; 2007.
- World Health Organization. Manual of the international statistical classification of diseases, injuries and causes of death. Seventh revision. Geneva: WHO; 1957.
- Fritz A, Percy C, Jack A, Shanmugaratnam K, Sobin L, Parkin DM, . International classification of diseases for oncology (ICD-O). 3rd. Geneva: WHO; 2000.
- World Health Organization. International statistical classification of diseases and related health problems. Tenth revision. 1. Geneva: WHO; 1992.
- Ferlay J, Burkhard S, Whelan S, Parkin DM. Check and conversion programs for cancer registries. (IARC/IACR Tools for Cancer Registries). IARC Technical Report No. 42. Lyon: IARC Press; 2005.
- IARC/IACR multiple primary rules. Lyon, France. Available from: http://www.iarc.com.fr/M/Prules_july2004.pdf.
- Karagas MR, Weinstock MA, Nelson HH. Keratinocyte carcinomas (Basal and squamous cell carcinomas of the skin). Schottenfeld D, Fraumeni JF Jr. Cancer epidemiology and prevention. 3rd. Oxford: Oxford University Press; 2006. 1230–50.
- Muir CS, Fraumeni JF Jr, Doll R. The interpretation of time trends. Doll R, Fraumeni JF Jr, Muir CS. Trends in cancer incidence and mortality. Cancer Surveys. 19/20. Imperial Cancer Research Fund 1994. 5–21.
- Doll R, Cook P. Summarizing indices for comparison of cancer incidence data. Int J Cancer 1967;2:269–79.
- Segi M. Cancer mortality for selected sites in 24 countries (1950–1957). Sendai: Tohoku University School of Medicine; 1960.
- Day NE. Cumulative rate and cumulative risk. Parkin DM, Muir CS, Whelan SL, Gao YT, Ferlay J, Powell J. Cancer incidence in five continents, vol. VI. Lyon: International Agency for Research on Cancer; 1992. 862–4.
- Clayton D, Schifflers E. Models for temporal variation in cancer rates. I: Age-period and age-cohort models. Stat Med 1987;6:449–67.
- Dyba T, Hakulinen T, Päivärinta L. A simple non-linear model in incidence prediction. Stat Med 1997;16:2297–309.
- Dyba T, Hakulinen T. Comparison of different approaches to incidence prediction based on simple interpolation techniques. Stat Med 2000;19:1741–52.
- Hakulinen T, Dyba T. Precision of incidence predictions based on Poisson distributed observations. Stat Med 1994;13: 1513–23.
- Møller B, Fekjaer H, Hakulinen T, Sigvaldason H, Storm HH, Talbäck M, . Prediction of cancer incidence in the Nordic countries: Empirical comparison of different approaches. Stat Med 2003;22:2751–66.
- NORDPRED software package. Oslo, Norway. Available from: http://www.kreftregisteret.no/en/Research/Projects/Nordpred/ (accessed on 17/12/2008).
- Pukkala E, Patama T, Engholm G, Ólafsdóttir GH, Bray F, Talbäck M, . Small-area based map animations of cancer incidence in the Nordic countries, 1971–2003. Nordic Cancer Union 2007. Available from: http://astra.cancer.fi/cancermaps/Nordic.
- Patama T, Engholm G, Klint Å, Larønningen S, Ólafsdóttir GH, Pukkala E. Small-area based map animations of cancer mortality in the Nordic countries, 1971–2003. Nordic Cancer Union 2008. Available from: http://astra.cancer.fi/cancermaps/ Nordic/mort.
- Hakulinen T, Pukkala E, Kenward M, Teppo L, Puska J, Tuomilehto J, . Changes in cancer incidence in North Karelia, an area with a comprehensive preventive cardiovascular programme. Hakama M, Beral V, Cullen V, Parkin DM. Evaluating effectiveness of primary prevention of cancer. IARC Scientific publications no 103. Lyon: IARC; 1990. 133–48.
- Wang H, Kåresen R, Hervik A, Thoresen SO. Mammography screening in Norway: Results from the first screening round in four counties and cost-effectiveness of a modeled nationwide screening. Cancer Causes Control 2001;12: 39–45.
- Adami HO, Bergström R, Möhner M, Zatonski W, Storm H, Ekbom A, . Testicular cancer in nine northern European countries. Int J Cancer 1994;59:33–8.
- Bray F, Richiardi L, Ekbom A, Pukkala E, Cuninkova M, Møller H. Trends in testicular cancer incidence and mortality in 22 European countries: Continuing increases in incidence and declines in mortality. Int J Cancer 2006;118: 3099–111.
- Kvåle R, Auvinen A, Adami HO, , Klint ÅHernes E, Møller B, . Interpreting trends in prostate cancer incidence and mortality in the five Nordic countries. J Natl Cancer Inst 2007;99:1881–7.
- Engholm G, Ferlay J, Christensen N, Bray F, Gjerstorff ML, Klint Å. PC-NORDCAN: Cancer incidence and mortality in the Nordic countries, Version 2.4. Danish Cancer Society 2009. Available from: www.ancr.nu.