Abstract
Glioma is the most common type of adult brain tumor and glioblastoma, its most aggressive form, has a dismal prognosis. Receptor tyrosine kinases such as the epidermal growth factor receptor (EGFR, ERBB2, ERBB3, ERBB4) family, and the vascular endothelial growth factor receptor (VEGFR), play a central role in tumor progression. We investigated the genetic variants of EGFR, ERBB2, VEGFR and their ligands, EGF and VEGF on glioma and glioblastoma risk. In addition, we evaluated the association of genetic variants of a newly discovered family of genes known to interact with EGFR: LRIG2 and LRIG3 with glioma and glioblastoma risk. Methods. We analyzed 191 tag single nucleotide polymorphisms (SNPs) capturing all common genetic variation of EGF, EGFR, ERBB2, LRIG2, LRIG3, VEGF and VEGFR2 genes. Material from four case-control studies with 725 glioma patients (329 of who were glioblastoma patients) and their 1 610 controls was used. Haplotype analyses were conducted using SAS/Genetics software. Results. Fourteen of the SNPs were significantly associated with glioma risk at p< 0.05, and 17 of the SNPs were significantly associated with glioblastoma risk at p< 0.05. In addition, we found that one EGFR haplotype was related to increased glioblastoma risk at p=0.009, Odds Ratio [OR] = 1.67 (95% confidence interval (CI): 1.14, 2.45). The Bonferroni correction made all p-values non-significant. One SNP, rs4947986 next to the intron/exon boundary of exon 7 in EGFR, was validated in an independent data set of 713 glioblastoma and 2 236 controls, [OR] = 1.42 (95% CI: 1.06,1.91). Discussion. Previous studies show that regulation of the EGFR pathway plays a role in glioma progression but the present study is the first to find that certain genotypes of the EGFR gene may be related to glioblastoma risk. Further studies are required to reinvestigate these findings and evaluate the functional significance.
Although the median survival time of high-grade glioma patients has increased by a few months due to combined treatment by radiotherapy and temozolomide [Citation1], prognosis of patients diagnosed with these tumors remains poor. The aetiology of glioma is unknown, but an increased risk for first degree relatives has been observed, indicating that glioma may be partially explained by genetic factors [Citation2]. Low penetrance genes are important in the aetiology of tumors at other sites [Citation3,Citation4] and are also likely to contribute to gliomagenesis. Relatively few low penetrance genes associated with glioma risk have been identified so far [Citation5–8]. Several genes affecting cell cycle and DNA repair have been proposed to play a role in glioma pathogenesis and progression [Citation9]. Amplification of the epidermal growth factor receptor (EGFR) is found in approximately 50% of high-grade glioma, suggesting that overexpression or alteration of this gene may be an important event in the development of a subset of glial tumors. Glioblastoma harboring EGFR amplifications frequently contain a genetic mutation of EGFR (i.e., EGFRvIII) resulting in an altered receptor domain that renders the receptor to be constitutively active causing a more malignant phenotype [Citation10]. In normal tissues a ligand, often the epidermal growth factor (EGF), binds to EGFR which induces a dimerization of one or several members of the EGFR receptor family (ErbB1-4). After dimerization several tyrosine kinases and other signal molecules are activated from the cell surface into the cell nucleus promoting transcription [Citation11]. Several negative regulators of the EGFR signaling pathway have been identified, such as, the LRIG1 gene, a member of the LRIG protein family (LRIG1-3) [Citation12,Citation13]. Activation of the EGFR pathway also leads to the up-regulation of the ligand vascular endothelial growth factor (VEGF) and activation of its receptor (VEGFR2) which is also more highly expressed in high grade glioma [Citation14]. Activation of the VEGF pathway promotes angiogenesis and cell growth [Citation15].
The goal of the present study was to determine whether genes proposed as associated with glioma progression are also related to glioma risk. We therefore performed a comprehensive haplotype tagging of selected proposed glioma progression genes; EGF, EGFR, ERBB2, LRIG2, LRIG3, VEGF, and VEGFR2 to assess if variations in these genes are associated with risk of glioma and glioblastoma.
Material and methods
Study subjects
The study was based on four previously described [Citation5,Citation16] case-control studies that formed part of the Interphone study [Citation17] (). Briefly, these four population-based case-control studies were conducted in Sweden, Denmark, Finland and the Thames region of Southeast England. Glioma cases were identified through neurosurgery, neuropathology, oncology, and neurology centers and cancer registries. Eligible cases were patients diagnosed with glioma (International Classification of Diseases (ICD), 10th revision, code C71; International Classification of Diseases for Oncology (ICD-O), 2nd ed., codes 9380-9384, 9390-9411, 9420-9451, 9505) who were between ages 20 to 69 years at diagnosis and resided in the Nordic countries or between 18 to 59 years at diagnosis and resided in Southeast England. Controls in the Nordic centers were randomly selected from the population register for each study area and frequency matched to all adult brain tumor cases on age, sex, and region. In the UK study, controls were recruited from general practitioner lists, frequency-matched to cases on age, sex, and region. In Sweden, the Southeast of England and Denmark, all interviewed cases and controls who agreed to provide blood samples were included in the present study. The Finnish investigators did not attempt to collect blood from all interviewed participants; rather, they drew blood from a convenience sample of predetermined size, of glioma patients in three hospitals and controls living in areas served by these hospitals. A replication set was used from a previous genome wide association study of 1 281 glioma of which 713 were glioblastoma from MDAnderson Cancer Center (MDACC) [Citation18]. The cases were collected between 1990 to 2008 at MDAnderson Cancer Center. For controls of that replication set, Illumina Hap 550-k Bead chip genotypes of 2 243 individuals from the Cancer Genetic Markers of Susceptibility Studies (CGEMS) were used [Citation19,Citation20]. The replication analyses were adjusted for age. The subgroup glioblastoma was also analyzed separately, as this is a more histopathologically homogenous subset.
Table I. Distribution of cases and controls, and number of samples with available DNA, in the Nordic – UK case-control study, 2000–2004.
SNP selection
All SNPs selected for genotyping were initially identified using the public databases dbSNP (http://www.ncbi.nih.gov), HapMap (http://www.hapmap.org/) and SNPper (http://snpper.chip.org/). To identify linkage disequilibrium (LD) blocks within and surrounding EGF, EGFR, ERBB2, LRIG2, LRIG3, VEGF and VEGFR2 and get a dense tagging of SNPs, we used Haploview software (http://www.broad.mit.edu/mpg/haploview/) setting the minimum r2 to 0.9 and the minimum minor allele frequency to 5% in HapMap CEPH (CEU) Utah residents with ancestry from Northern and Western Europe. DNA was extracted from samples using conventional methods and quantified using PicoGreen (Invitrogen Corp., Carlsbad, CA, USA).
Genotyping
Genotyping was first validated using a set of 14 family trios with genotype data available through the HapMap consortium. Concordance analyses with the HapMap data as well as analysis of the parent-offspring-compatibility with the produced genotypes were performed. On each 384 well plate analyzed as a unit, half the samples were control samples, the remainder were DNA extracted from case samples.
Internal concordance analysis was performed by genotyping 90 samples twice for all SNPs in the study. Three different DNA samples were used in quadruplicate on each 364 well plate that was analyzed. The success rate for each SNP genotyping assay was calculated as the number of genotypes retrieved over the possible number of genotypes.
The concordance between the HapMap data and the data produced on the HapMap trios was 100% for all SNPs. No parent-offspring-incompatibility was found among trios and repeated samples were 100% concordant for all the SNP assays. The three repeated samples on all different analysis units showed concordant genotypes for all assays, in all instances when they where genotyped. The success rate for the different SNP assays spanned from 96.5 to 98%.
In total, 210 tag SNPs in the selected candidate genes were selected for validation and internal concordance analyses. A number of SNPs failed the initial validation analyses (n=17) and the concordance analyses (n=2). Finally 191 SNPs (30 in EGF, 89 in EGFR, 11 in ERBB2, 6 in LRIG2, 11 in LRIG3, 17 in VEGF and 27 in VEGFR2) were included into the genotyping analyses.
All SNPs were genotyped using matrix-assisted laser desorption/ionization time-of-flight (MALDI-TOF) mass spectrometry (Sequenom Inc. USA). Assays for all SNPs were designed using SpectroDESIGNER software (Sequenom Inc.) All SNPs were genotyped using the iPLEX assays. The amplification was performed in a total volume of 5 μl containing 10 ng of genomic DNA, 100 nM of each amplification primer, 500 mM of dNTP mix, 1.625 mM MgCl2 and 0.5 units of HotStarTaq DNA Polymerase (Qiagen Inc.). The reaction was subjected to the following PCR conditions: a single cycle of denaturation at 95°C for 15 min, followed by 45 cycles at 94°C for 20 s, 56°C for 30 s, 72°C for 60 s and a final extension at 72°C for 3 min. The allele-specific extension was performed in a total volume of 9 μl using 5 pmol of extension primer and the Mass EXTEND Reagent Kit and cleaned using SpectroCleaner (Sequenom Inc.). Products from primer-extension reactions were loaded on a 384-element chip nanoliter pipetting system (Sequenom Inc.) and analyzed on a MassARRAY mass spectrometer (Bruker Daltonik GmbH, Germany). Data were analyzed independently by two persons using the SpectroTyper software (Sequenom inc.).
Statistical methods
We used SPSS software and SAS Genetics for the statistical analyses. All analyses were adjusted for sex, age and country of residence. A likelihood ratio test of a covariate equal to the number of rare alleles (0, 1 or 2) based on a logistic regression model was used to test for association between SNPs and glioma and glioblastoma risk (trend tests). For each SNP odds ratios (ORs) and corresponding confidence intervals (CIs) were estimated for each genotype by comparison to individuals homozygous for the common allele in logistic regression models. Proc Allele (SAS Genetics) was used to test for departure from Hardy-Weinberg equilibrium (HWE) among controls (an assumption required for Proc Haplotype results to be valid) and genotype frequencies were consistent with those expected under HWE. In the EGFR gene, haplotypes were identified by selecting significant SNPs at p< 0.05 level located at intron 1 since a functional role of a CA repeat in intron 1 has been proposed [Citation21]. In the ERBB2 gene, haplotypes were identified by selecting significant SNPs at p< 0.05 level located in the promoter region, an interesting region since it is an area for initiation of gene transcription. The reference category for haplotype odds ratios are all other haplotypes combined. To address the problem of multiple testing we calculated the false positive report probability (FPRP) based on ORtrend statistics [Citation22]. To do so we calculated the study had 80% power to detect a trend OR of 1.3. We calculated the FPRP for a range of prior probabilities (0.00001; 0.0001; 0.001; 0.01; 0.1; 0.25). We report results assuming a prior probability of 0.1 as the studied genes are key genes for development and progression of glioblastoma [Citation23]. We considered FPRPs <0.2 to designate a noteworthy association in accordance with published criteria [Citation22]. We also repeated the analyses with Bonferroni correction of p-values.
Results
Fourteen of the SNPs were significantly associated with glioma risk at p< 0.05 (), and 17 of the SNPs were statistically significantly associated with glioblastoma risk at p< 0.05 (). In addition, four SNPs were significant for both glioma risk overall and glioblastoma risk separately, rs4947979, rs4947986, rs9642393, rs11506105 ( and ). Odds ratios and their associated p-values for each of the 191 genotyped SNPs with their corresponding rs-numbers are shown for glioma (Supplementary Table I) and glioblastoma (Supplementary Table II). The location of all EGFR and ERBB2 SNPs with a p-value <0.05 included in the Proc Haplotype analyses are presented in and respectively. The LD in ERBB2 is higher than in EGFR indicating a need for a large number of tag SNPs in EGFR (89). Although a number of EGFR SNPs were significantly associated with glioma risk overall (), glioma consists of a heterogeneous group of tumors and each subtype may be characterized by a different genetic profile. We therefore, analyzed glioblastoma, the largest homogeneous subgroup, separately. Eleven EGFR SNPs were associated at p< 0.05 with risk of this aggressive tumor, six of which were located in intron 1 (). Five SNPs on the ERBB2 gene were also related at p < 0.05 to glioblastoma. Three of these were located in the promoter region (). For the other proposed glioma progression genes, only one SNP on the VEGFR2 gene (rs3828550) was related at p< 0.05 to glioblastoma risk (). One haplotype of the six intron 1 EGFR SNPs showed a frequency of 49% in glioblastoma cases compared with 42% in controls at p=0.009, OR=1.67 (95% CI: 1.14, 2.45) (). In the ERRB2 gene, one haplotype of the three promoter SNPs was associated with decreased risk of glioblastoma at p=0.0011, [OR]=0.61 (95% CI: 0.42, 0.89) and one haplotype of the three promoter SNPs was associated with increased risk of glioblastoma at p<0.05, [OR]=1.55 (95% CI: 1.06, 2.27) (). Six SNPs (rs4947979, rs3752651, rs10228436, rs845552, rs1476278, rs1058808) showed FPRPs <0.2 to designate a noteworthy association ( and ). The Bonferroni correction made all p-values non-significant, but because many SNPs are in LD this adjustment might be considered as over-correction. Of the 29 SNPs that reached significance at the 0.05 level in the Nordic-Interphone data set, eight were available from the GWAS data at MDACC for validation. In glioma, rs917881, rs 4947979, rs1150610, rs4947986, rs3752651, rs1468727 and rs 845552 were available for analysis, none were validated with a p-trend < 0.05, but rs845552 heterozygosity was associated with decreased glioma risk (OR = 0.84, 95% CI: 0.71–0.99). In glioblastoma rs17172430, rs4947979, rs11506105 and rs4947986 were available for analysis. The only SNP that was validated with a p-trend <0.05 was rs4947986, p=0.026, OR for heterozygosity 0.93 (95% CI: 0.78–1.12), OR for homozygosity of the rare variant 1.42 (95% CI: 1.06–1.91).
Figure 1. Linkage disequilibrium (LD) blocks of the EGFR gene and arrows indicating location of SNPs selected to estimate haplotypes by SAS Genetics. Exons have been redrawn to show the relative positions in the EGFR gene, therefore maps are not to physical scale.
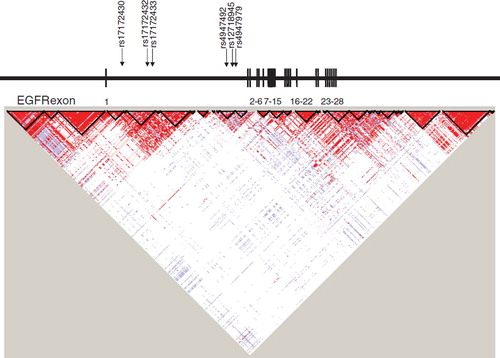
Figure 2. Linkage disequilibrium (LD) blocks of the ERBB2 gene and arrows indicating location of SNPs selected to estimate haplotypes by SAS Genetics. Exons have been redrawn to show the relative positions in the ERBB2 gene, therefore maps are not to physical scale.
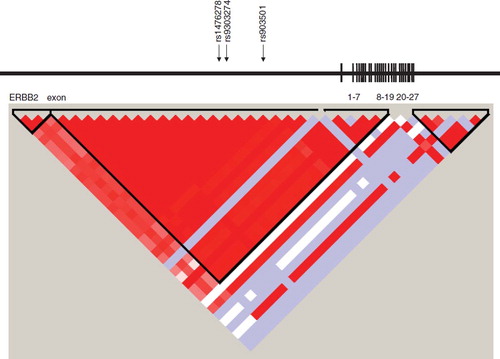
Table II. Single nucleotide polymorphisms (SNPs) associated with risk of glioma at the 5% significance level based on trend test, and their heterozygote and homozygote odds ratios, per-allele odds ratios, confidence intervals, and false-positive probabilities.
Table III. Single nucleotide polymorphisms (SNPs) associated with risk of glioblastoma at the 5% significance level based on trend test, and their heterozygote and homozygote odds ratios, per-allele odds ratios, confidence intervals, and false-positive probabilities.
Table IV. Associations between EGFR haplotypes and risk of glioblastoma in Denmark, Finland, Sweden, and UK.
Table V. Associations between ERBB2 haplotypes and risk of glioblastoma in Denmark, Finland, Sweden, and UK.
Discussion
This study provides some support for an association of the intron/exon boundary SNP at exon 7 of EGFR in glioblastoma. Our findings suggest that EGFR may be an important determinant of glioma risk overall, and that certain haplotypes in EGFR and ERBB2 may affect glioblastoma development, as we observed associations with these tumors in the regulatory parts of these genes. However, the results from the haplotype analyses need to be confirmed in additional data sets. If any of the genotypes are correlated with survival this could result in bias if cases with specific SNPs were in too poor health to take part in the study or were deceased prior to first contact.
The reference category for the haplotype odds ratio consists of all other haplotypes combined; in highly variable genes with polymorphisms not in LD the stability of this odds ratio has been questioned [Citation24]. Intron 1 of EGFR is very large, spanning 122 000 base pairs and the five associated SNPs are located from haplotype block 4 to 14 of a total of 31 blocks across the gene. All glioblastoma-associated SNPs in the ERBB2 promoter reside in the same haplotype block number 2, thereby producing a more stable estimate. As it is impossible to rule out false positive results due to multiple testing or selection bias produced by SNP-associated survival, replication of our findings is necessary. Our validation set only showed association with the SNP in the intron/exon 7 boundary of EGFR.
The function of genetic variants of EGFR and ERBB2 has not yet been systematically described. However, several regulating promoter polymorphisms have been identified in EGFR [Citation25] and a functional role of a CA repeat in intron 1 has been proposed [Citation21,Citation26]. Specifically, having a long CA repeat down-regulates transcription of EGFR and thereby inhibits production of the protein [Citation25,Citation27]. This intron CA dinucleotide repeat and the glioblastoma-associated SNP, rs17172430, are located in close proximity to each other at haplotype block 4 according to Haploview [Citation28], suggesting that this SNP is in strong linkage disequilibrium (LD) with this CA repeat thus providing a functional explanation for the observed association. Approximately 50% of glioblastoma cases are characterized by EGFR amplification and overexpression. Among these tumors, 20–30% of the extracellular part of EGFR is mutated (EGFRvIII) with a deletion of exons 2–7 [Citation29]. EGFRvIII is constitutively active and promotes cell proliferation through activation of the PI3 kinase and PTEN pathways [Citation30]. Two of our associated genetic variants, rs17172430 and rs4947986 are located at the break points of this common deletion, at intron 1 and next to the intron/exon border 7 in glioblastoma. Thus, these SNPs may represent susceptibility to EGFR mutation resulting in elevated glioblastoma risk.
Since EGFR is a highly variable gene, 89 polymorphisms had to be included to represent complete coverage of the gene. Genetic studies with comprehensive tagging of EGFR as in the present study, have not, to our knowledge, been performed before. EGFR transgenic mice develop cerebellar glioma indicating that EGFR is an early step and instrumental in glioma formation [Citation30,Citation31]. In a previous case-control study of 376 glioblastoma patients, cases were more likely to have the EGFR-216T allele than controls [Citation32]. We were not able to analyze this SNP in our study because it did not pass the validation step.
Although ERBB2 has not been as extensively studied in brain tumors as EGFR, this gene is expressed in glioblastoma [Citation33]. Recently, in a large scale whole genomic characterization of glioblastoma the TCGA consortium identified ERBB2 mutations in glioblastoma [Citation34]. A recent publication also found that expression of ERBB2 together with overexpression of EGFRvIII in breast cancer increases downstream signaling tumorigenesis [Citation35]. Whether this mechanism also is present in glioblastoma is not known. The comprehensive haplotype tagging of the other proposed progression genes; EGF, LRIG2, LRIG3, VEGF and VEGFR2 only revealed one associated SNP in VEGFR2 with respect to glioblastoma risk.
In conclusion, our analysis of comprehensive tagging of the selected proposed glioma progression genes suggests association between EGFR genotypes and glioblastoma risk. The findings in the EGFR gene suggest that germline genetic variants of EGFR in neuroepithelial cancer stem cells may be involved in glioma development. The dimerization partner of EGFR, ERBB2 is also a possible low penetrance gene candidate associated with risk of glioblastoma development. Validation of the results, by genotype-phenotype correlation studies is currently being performed by our research group. Our results, if confirmed in further studies, provide potential clues to glioblastoma development, and may be used to identify patients who would benefit from therapies targeting EGFR receptor pathways.
Supplementary Material
Download PDF (45.8 KB)Acknowledgements
All centers were supported by the European Union Fifth Framework Program “Quality of life and Management of Living Resources” (contract number QLK4-CT-1999-01563), and the International Union against Cancer (UICC). The UICC received funds for this purpose from the Mobile Manufacturers’ Forum and GSM Association. Provision of funds to the INTERPHONE study investigators via the UICC was governed by agreements that guaranteed INTERPHONE’s complete scientific independence. These agreements are publicly available at http://www.iarc.fr/ENG/Units/RCAd.html. The Swedish center was also supported by the Swedish Research Council, the Cancer Foundation of Northern Sweden, the Swedish Cancer Society, and the Nordic Cancer Union. The Danish center was supported by the Danish Cancer Society, the Finnish center by the Emil Aaltonen Foundation and the Academy of Finland, The Cancer Society of Finland, and the UK center by the Mobile Telecommunications and Health Research (MTHR) Programme and NHS funding to the NIHR Biomedical Research Centre. The views expressed in the publication are those of the authors and not necessarily those of the funders. BM, UA and RH designed the study, and BM UA, JS, SS FW and RH conducted the genetic and statistical analyses and drafted the manuscript. AhA, AA, HCC, MF, CJ, KA, SL, MS and AS designed and conducted the original case control study and gave significant input to the manuscript.
Declaration of interest: The authors report no conflicts of interest. The authors alone are responsible for the content and writing of the paper.
References
- Stupp R, Mason WP, van den Bent MJ, Weller M, Fisher B, Taphoorn MJ, . Radiotherapy plus concomitant and adjuvant temozolomide for glioblastoma. N Engl J Med 2005;352:987–96.
- Malmer B, Iselius L, Holmberg E, Collins A, Henriksson R, Grönberg H. Genetic epidemiology of glioma. Br J Cancer 2001;84:429–34.
- Tenesa A, Farrington SM, Prendergast JG, Porteous ME, Walker M, Haq N, . Genome-wide association scan identifies a colorectal cancer susceptibility locus on 11q23 and replicates risk loci at 8q24 and 18q21. Nat Genet 2008;40:631–7.
- Fletcher O, Johnson N, Gibson L, Coupland B, Fraser A, Leonard A, . Association of genetic variants at 8q24 with breast cancer risk. Cancer Epidemiol Biomarkers Prev 2008;17:702–5.
- Malmer BS, Feychting M, Lönn S, Lindström S, Grönberg H, Ahlbom A, . Genetic variation in p53 and ATM haplotypes and risk of glioma and meningioma. J Neurooncol 2007;82:229–37.
- Bethke L, Webb E, Murray A, Schoemaker M, Johansen C, Christensen HC, . Comprehensive analysis of the role of DNA repair gene polymorphisms on risk of glioma. Hum Mol Genet 2008;17:800–5.
- Rajaraman P, Hutchinson A, Rothman N, Black PM, Fine HA, Loeffler JS, . Oxidative response gene polymorphisms and risk of adult brain tumors. Neuro Oncol 2008.
- Chang JS, Yeh RF, Wiencke JK, Wiemels JL, Smirnov I, Pico AR, . Pathway analysis of single-nucleotide polymorphisms potentially associated with glioblastoma multiforme susceptibility using random forests. Cancer Epidemiol Biomarkers Prev 2008;17:1368–73.
- Collins VP. Mechanisms of disease: Genetic predictors of response to treatment in brain tumors. Nat Clin Pract Oncol 2007;4:362–74.
- Nishikawa R, Ji XD, Harmon RC, Lazar CS, Gill GN, Cavenee WK, . A mutant epidermal growth factor receptor common in human glioma confers enhanced tumorigenicity. Proc Natl Acad Sci USA 1994;91:7727–31.
- Ohgaki H, Kleihues P. Genetic pathways to primary and secondary glioblastoma. Am J Pathol 2007;170:1445–53.
- Gur G, Rubin C, Katz M, Amit I, Citri A, Nilsson J, . LRIG1 restricts growth factor signaling by enhancing receptor ubiquitylation and degradation. Embo J 2004;23:3270–81.
- Hedman H, Henriksson R. LRIG inhibitors of growth factor signalling–double-edged swords in human cancer? Eur J Cancer 2007;43:676–82.
- Johansson M, Brännström T, Bergenheim AT, Henriksson R. Spatial expression of VEGF-A in human glioma. J Neurooncol 2002;59:1–6.
- Maity A, Pore N, Lee J, Solomon D, O’Rourke DM. Epidermal growth factor receptor transcriptionally up-regulates vascular endothelial growth factor expression in human glioblastoma cells via a pathway involving phosphatidylinositol 3’-kinase and distinct from that induced by hypoxia. Cancer Res 2000;60:5879–86.
- Schwartzbaum JA, Ahlbom A, Lönn S, Warholm M, Rannug A, Auvinen A, . An international case-control study of glutathione transferase and functionally related polymorphisms and risk of primary adult brain tumors. Cancer Epidemiol Biomarkers Prev 2007;16:559–65.
- Cardis E, Richardson L, Deltour I, Armstrong B, Feychting M, Johansen C, . The INTERPHONE study: Design, epidemiological methods, and description of the study population. Eur J Epidemiol 2007;22:647–64.
- Shete S, Hosking FJ, Robertson LB, Dobbins SE, Sanson M, Malmer B, . Genome-wide association study identifies five susceptibility loci for glioma. Nat Genet 2009;41: 899–904.
- Hunter DJ, Kraft P, Jacobs KB, Cox DG, Yeager M, Hankinson SE, . A genome-wide association study identifies alleles in FGFR2 associated with risk of sporadic postmenopausal breast cancer. Nat Genet 2007;39:870–4.
- Yeager M, Orr N, Hayes RB, Jacobs KB, Kraft P, Wacholder S, . Genome-wide association study of prostate cancer identifies a second risk locus at 8q24. Nat Genet 2007;39:645–9.
- Buerger H, Gebhardt F, Schmidt H, Beckmann A, Hutmacher K, Simon R, . Length and loss of heterozygosity of an intron 1 polymorphic sequence of egfr is related to cytogenetic alterations and epithelial growth factor receptor expression. Cancer Res 2000;60:854–7.
- Wacholder S, Chanock S, Garcia-Closas M, El Ghormli L, Rothman N. Assessing the probability that a positive report is false: An approach for molecular epidemiology studies. J Natl Cancer Inst 2004;96:434–42.
- Kraft P. Efficient two-stage genome-wide association designs based on false positive report probabilities. Pac Symp Biocomput 2006:523–34.
- Hoh J, Hodge SE. A measure of phase ambiguity in pairs of SNPs in the presence of linkage disequilibrium. Hum Hered 2000;50:359–64.
- Liu W, Innocenti F, Wu MH, Desai AA, Dolan ME, , Cook EH Jr. A functional common polymorphism in a Sp1 recognition site of the epidermal growth factor receptor gene promoter. Cancer Res 2005;65:46–53.
- Buerger H, Packeisen J, Boecker A, Tidow N, Kersting C, Bielawski K, . Allelic length of a CA dinucleotide repeat in the egfr gene correlates with the frequency of amplifications of this sequence–first results of an inter-ethnic breast cancer study. J Pathol 2004;203:545–50.
- Liu W, Wu X, Zhang W, Montenegro RC, Fackenthal DL, Spitz JA, . Relationship of EGFR mutations, expression, amplification, and polymorphisms to epidermal growth factor receptor inhibitors in the NCI60 cell lines. Clin Cancer Res 2007;13(22 Pt 1):6788–95.
- Barrett JC, Fry B, Maller J, Daly MJ. Haploview: Analysis and visualization of LD and haplotype maps. Bioinformatics 2005;21:263–5.
- Stutz MA, Shattuck DL, Laederich MB, , Carraway KL 3rdSweeney C. LRIG1 negatively regulates the oncogenic EGF receptor mutant EGFRvIII. Oncogene 2008;27:5741–52.
- Ohgaki H, Kita D, Favereaux A, Huang H, Homma T, Dessen P, . Brain tumors in S100beta-v-erbB transgenic rats. J Neuropathol Exp Neurol 2006;65:1111–7.
- Weiss WA, Burns MJ, Hackett C, Aldape K, Hill JR, Kuriyama H, . Genetic determinants of malignancy in a mouse model for oligodendroglioma. Cancer Res 2003;63: 1589–95.
- Carpentier C, Laigle-Donadey F, Marie Y, Auger N, Benouaich-Amiel A, Lejeune J, . Polymorphism in Sp1 recognition site of the EGF receptor gene promoter and risk of glioblastoma. Neurology 2006;67:872–4.
- Andersson U, Guo D, Malmer B, Bergenheim AT, Brännström T, Hedman H, . Epidermal growth factor receptor family (EGFR, ErbB2-4) in gliomas and meningiomas. Acta Neuropathol 2004;108:135–42.
- McLendon R, Friedman A, Bigner D, Van Meir EG, Brat DJ, Mastrogianakis GM, . Comprehensive genomic characterization defines human glioblastoma genes and core pathways. Nature 2008;455(7216):1061–8.
- Yu H, Gong X, Luo X, Han W, Hong G, Singh B, . Co-expression of EGFRvIII with ErbB-2 enhances tumorigenesis: EGFRvIII mediated constitutively activated and sustained signaling pathways, whereas EGF-induced a transient effect on EGFR-mediated signaling pathways. Cancer Biol Ther 2008;7.