Abstract
Background. Tumor motion during radiotherapy is a major challenge for accurate dose delivery, in particular for hypofractionation and dose painting. The motion may be compensated by dynamic multileaf collimator (DMLC) tracking. Previous work has demonstrated that a single kV imager can accurately localize moving targets for DMLC tracking during rotational delivery, however this method has not been investigated for the static gantry geometry used for conformal and IMRT treatments. In this study we investigate the accuracy of single kV-imager based DMLC tracking for static-gantry delivery. Material and methods. A 5-field treatment plan with circular field shape and 200 MU per field was delivered in 20 s per field to a moving phantom with an embedded gold marker. Fluoroscopic kV images were acquired at 5 Hz perpendicular to the treatment beam axis during a 120° pre-treatment gantry rotation, during treatment delivery, and during inter-field gantry rotations. The three-dimensional marker position was estimated from the kV images and used for MLC adaptation. Experiments included 12 thoracic/abdominal tumor trajectories and five prostate trajectories selected from databases with 160 and 548 trajectories, respectively. The tracking error was determined as the mismatch between the marker position and the MLC aperture center in portal images. Simulations extended the study to all trajectories in the databases and to treatments with prolonged duration of 60 s per field. Results. In the experiments, the mean root-mean-square (rms) tracking error was 0.9 mm (perpendicular to MLC) and 1.1 mm (parallel to MLC) for thoracic/abdominal tumor trajectories and 0.6 mm (perpendicular) and 0.5 mm (parallel) for prostate trajectories. Simulations of these experiments agreed to within 0.1 mm. Simulations of all trajectories in the databases resulted in mean rms tracking errors of 0.6 mm (perpendicular) and 0.9 mm (parallel) for thorax/abdomen tumors and 0.4 mm (perpendicular) and 0.2 mm (parallel) for prostate for both 20 s and 60 s per field. Conclusion. Single kV imager DMLC tracking, which is fully compatible with IMRT, was demonstrated for static fields. The mean tracking error was sub-2 mm for most tumor trajectories with respiratory motions and sub-1 mm for most prostate trajectories.
In radiotherapy, the methods for intrafraction tumor motion management [Citation1–5] include tracking, i.e. continuous realignment of the treatment beam and the tumor. Until now, only the robotic Cyberknife system (Accuray Inc., Sunnyvale, CA) is used clinically for tracking [Citation6], but for conventional linear accelerators both couch tracking [Citation7] and dynamic MLC (DMLC) tracking [Citation8–10] have been investigated in phantom studies.
For tumors with implanted markers the three-dimensional (3D) real-time target position signal for tracking can be obtained by two simultaneous x-ray images acquired from different directions. The imagers can either be a pair of kV/kV imagers [Citation11] or a single kV imager in combination with a portal imager [Citation12,Citation13]. While the former is non-standard equipment for conventional linear accelerators the latter is not readily compatible with intensity modulated radiation therapy (IMRT) because the MLC leaves may hinder marker visibility in the portal images. In order to overcome this problem we recently developed a method for real-time 3D target position estimation based on the kV imager alone and integrated this method with DMLC tracking of moving targets during rotational treatment delivery [Citation14,Citation15]. The single imager localization method is particularly suited for rotational delivery because it relies on a 3D probability density function for the target position established online through sequential kV imaging at varying angles [Citation16].
Our previous work demonstrated that the single kV imager can accurately localize moving targets for DMLC tracking during rotational delivery. However, the method has not been investigated for the static gantry geometry used for 3D conformal and IMRT treatments. In this feasibility study we extend the use of single kV imager based DMLC tracking to static-gantry fields. The geometrical accuracy of the DMLC tracking will be investigated through experiments and simulations.
Material and methods
DMLC tracking experiments
The tracking experiments were performed with a prototype DMLC tracking system integrated with a Trilogy linear accelerator equipped with a kV On-Board Imager (OBI) and a PortalVision AS1000 portal imager (Varian Medical Systems, Palo Alto, CA). As indicated in , a treatment plan with five static fields at equidistant gantry angles of 180, 108, 36, -36, and -108 degrees was used. The field aperture was circular with 10 cm diameter and MLC leaves aligned in the cranio-caudal (CC) direction. For each field, 200 MU were delivered at a dose rate of 600 MU/min. The beam energy was 6 MV.
Figure 1. Schematic showing the gantry angles for the five fields (F1-F5), the 120° pre-treatment gantry rotation, and the 72° inter-field gantry rotations. Fluoroscopic kV images were acquired during the entire procedure and used for DMLC tracking of the moving phantom.
The treatment was delivered to a moving Styrofoam phantom with an embedded gold marker. The phantom was placed on a motion stage [Citation17] that was programmed to reproduce 12 representative thoracic/abdominal tumor trajectories and five representative prostate trajectories. The same trajectories have been used in previous studies of single kV imager DMLC tracking during arc treatments [Citation14,Citation15]. As described in Refs. [Citation14,Citation15], the trajectories were carefully selected to show the variety of motion patterns in a database with 160 thoracic and abdominal tumor trajectories (46 patients) estimated by a Cyberknife Synchrony system (Accuray Inc., Sunnyvale, CA) at Georgetown University Hospital [Citation18] and a database with 548 prostate trajectories (17 patients) measured by electromagnetic transponders at MD Anderson Cancer Center, Orlando, Florida [Citation19].
The single kV imager DMLC tracking method has been described previously for arc treatments [Citation14,Citation15]. In the present study, fluoroscopic kV images were acquired at 5 Hz with the OBI system during a 120° pre-treatment gantry rotation, during treatment delivery, and during the 72° gantry rotations between the fields as illustrated in . The mean number of kV images was 928 in total, divided into 105 pre-treatment images, 5 × 10³ intra-field images, and 4 × 77 inter-field images. The DMLC tracking procedure started after acquisition of 90 kV images (i.e. around 3 seconds before treatment start) and consisted of the following steps for each new kV image [Citation15]: (1) marker segmentation in the current image, (2) probability-based 3D position estimation from the current image and all previous images, (3) kernel density estimation-based prediction [Citation20] for the thoracic/abdominal tumor trajectories to account for the 570 ms tracking system latency [Citation14] (no prediction was used for prostate), and (4) adjustment of the MLC aperture to the resulting 3D target position estimation.
shows a typical example of gantry angle, beam-on status, and MLC aperture center position as function of time. These data were extracted from MLC log files (Dynalog files [Citation21]) recorded during tracking of a lung tumor trajectory. As indicated in the figure, we define time t = 0 as the starting time for the first field. The figure shows how the tracking procedure started a few seconds before treatment onset and continued throughout the session both during and between the fields.
Figure 2. Example of data from a typical tracking experiment for a lung tumor trajectory. From top to bottom the curves show the following as function of time: gantry angle, beam-on status, and requested MLC aperture center position perpendicular and parallel to the MLC leaf motion direction. All data were extracted from Dynalog files recorded during the experiment.
Off-line analysis of the tracking accuracy
During the experiments continuous portal images were acquired at 7.5 Hz in the beam-on periods for independent recording of the tracking process in beam's eye view (BEV) of the treatment beam. Between 145 and 148 portal images were acquired per field. After the experiments, the gold marker and the MLC aperture were segmented in each portal image [Citation22]. The tracking error was determined as the difference between the marker position and the MLC aperture center position. For each experiment, the root-mean-square (rms) of the tracking error for all MV images was calculated parallel and perpendicular to the MLC leaf direction. These two directions correspond to the CC direction and a gantry-dependent combination of the left-right (LR) and anterior-posterior (AP) directions, respectively.
During the experiments the tracking program generated a log file with the real-time estimated target position for each kV image and, for thorax/abdomen tumor trajectories, the predicted target position 570 ms later. After the experiments these position estimations were compared with the input trajectory for the motion phantom, which was assumed to represent the actual phantom positions. The target position estimation errors were calculated as follows:
The target position estimation error at the time of imaging was calculated as the difference between the actual target position at kV image acquisition and the estimated target position from the kV image. For each experiment, the rms of this error was calculated both in the 3D room coordinate system and in the 2D BEV of the treatment beam by including all intra-field kV images. This position estimation error reflects the accuracy of the single kV-imager method for 3D target position localization.
The target position estimation error at the time of beam correction was calculated as the difference between the actual target position 570 ms after kV image acquisition and either the estimated target position after prediction (for thorax/abdomen tumor trajectories) or the estimated target position from the image (for prostate). For both tumor trajectory types, the rms of the position estimation error at the time of beam correction was calculated in the BEV of the treatment beam by including all intra-field kV images. This position estimation error reflects the accuracy of the target localization including uncertainties from both the single kV-imager method and the 570 ms tracking latency.
Simulations
Simulations of the tracking experiments were performed with the purpose of extending the scope of this study to all tumor trajectories in the motion databases, to prolonged treatment durations, and to reduced tracking system latencies.
First, simulations mimicking the 12 experiments with thoracic/abdominal tumor trajectories and the five experiments with prostate trajectories were made in order to investigate the validity of the simulations. For each experiment, all kV images were simulated by projecting the actual marker position onto the kV imager plane at the image acquisition times and gantry angles known from the experiment. In this procedure, perfect imager geometry with infinite pixel resolution and no marker segmentation uncertainty was assumed. The resulting sequence of projected marker positions and gantry angles was then used as input for the tracking program, where the same sequence of calculations as in the experiments was made for target position estimation. For these calculations, the tracking program was run in an offline mode without output connection to the MLC controller. For each intra-field kV image, the target position estimation error was calculated at the time of imaging and at the time of beam correction. The rms of the position estimation error was calculated for the beam-on periods for each simulated treatment and compared with the corresponding geometrical errors in the experiments.
Next, the same simulations with 20 s per field were made for all 160 thoracic/abdominal tumor trajectories and all 548 prostate trajectories in the databases. Finally, simulations were made for all trajectories for prolonged treatment durations of 60 s per field to investigate the tracking method for hypofractionated schemes and for a reduced tracking latency of 285 ms in order to investigate the potential accuracy gain by halving the latency.
Results
In and the real-time estimated target trajectory at the time of imaging (blue curves) and at the time of beam correction (red curves) are compared with the actual phantom trajectory (black curves) for one of the 12 experiments with thoracic/abdominal tumor trajectories. The trajectories are shown both in room coordinates () and in BEV of the MV imager (). In each subfigure, the rms position estimation error is indicated both before and after application of the 570 ms prediction. In , the target motion in the Xp-direction (perpendicular to the MLC leaves) was always unresolved for the kV imager. Hence, the position estimation in this direction reflects the ability of the single-imager method to estimate the unresolved target motion from the two resolved motion components. On the other hand, the Yp-direction (parallel to the MLC leaves) was always resolved by the kV imager resulting in a low rms estimation error of only 0.11 mm at the time of imaging. However, the prediction needed for compensation of the system latency clearly introduced additional errors resulting in a rms estimation error at the time of beam correction of 1.05 mm. Some of the major prediction errors are indicated by arrows in .
Figure 3. Example of tracking experiment for lung tumor trajectory. (a, b) Phantom motion (black) and real-time estimated trajectory at the time of imaging (blue) and at the time of beam correction (i.e. after 570 ms prediction) (red). The data are shown in room coordinates (a) and in beam's eye view of the treatment beam (b). In (b), the real-time estimations are only shown for beam-on periods. (c) Position of marker (black) and beam aperture center (red) perpendicular and parallel to the MLC leaves as determined from portal images. (d) Gantry angle. The numbers specify the rms position estimation error before/after prediction (a, b) and the rms tracking error (c).
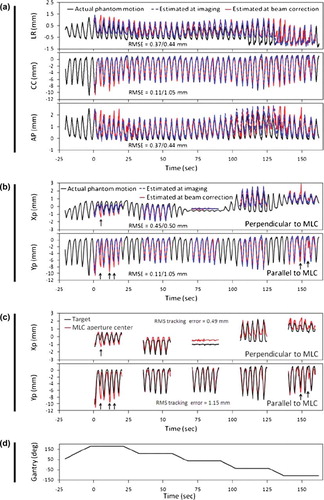
shows the marker position and the MLC aperture center position in the portal images acquired during delivery of the five fields. The difference between these positions is the tracking error. Since the coordinate system (or view direction) is the same in and the two figures can be directly compared. As indicated by the arrows in the two figures, the major tracking errors in can be directly attributed to position estimation errors at the time of beam correction in . The close similarity between target position estimation at beam correction (red curves in ) and MLC aperture motion (red curves in ) led to rms tracking errors that were equal to the rms position estimation error at imaging within 0.1 mm both perpendicular and parallel to the MLC leaves.
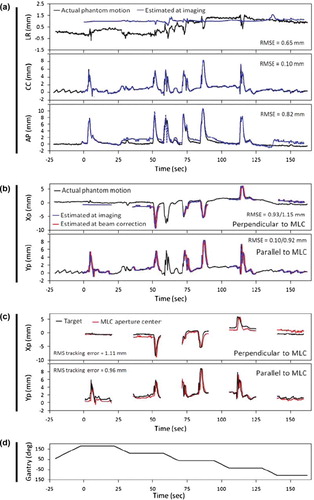
In , a similar set of data as in is presented for DMLC tracking of a prostate trajectory with high frequency excursions. For prostate no prediction was applied. Therefore, the position estimation at beam correction in is identical to the position estimation at imaging except for a time shift equal to the tracking system latency of 570 ms. Similar to the lung tumor case in the position estimation at the time of imaging was very accurate parallel to the MLC leaves (rms error of 0.10 mm) because this direction was always resolved in the kV images. Perpendicular to the MLC leaves the position was less accurate although the single-imager method was able to estimate the major target excursions correctly. As for the lung tumor example, the trajectory of the MLC aperture center in the portal images (red curves in ) was very similar to the estimated target position at beam correction (red curves in ) in both directions of the portal imager. Note the different DMLC tracking characteristics for the two types of tumor motion: For thoracic/abdominal tumors, the MLC aperture moved in phase with the target, but with occasional errors caused by prediction (). For prostate, the MLC motions more accurately mimicked the target motion, but it consistently lagged behind the target motion due to the non-compensated tracking latency ().
Figure 4. Example of tracking experiment for prostate trajectory. (a) Phantom motion (black) and real-time estimated trajectory (blue) in room coordinates. (b) Phantom motion (black) and real-time estimated trajectory at the time of imaging (blue) and 570 ms later (red) in beam's eye view of the treatment beam. (c) Position of marker (black) and beam aperture center (red) perpendicular and parallel to the MLC leaves as determined from portal images. (d) Gantry angle. The numbers specify the rms position estimation error at imaging (a) or at imaging/570 ms after imaging (b), and the rms tracking error (c).
summarizes the mean and maximum of the rms position estimation errors and the rms tracking error for all the experiments. In both directions of the portal imager (Xp and Yp), the rms tracking error was sub-2 mm for most thoracic/abdominal tumor trajectories and sub-1 mm for most prostate trajectories. For comparison, the last two columns in show the rms of the target position deviation from the mean target position during the pretreatment imaging period. This rms deviation was calculated for the beam-on periods of each experiment. It represents the geometrical errors for an idealized motion inclusive treatment with no gantry sag or MLC misalignment, but with perfect couch adjustment to the mean 3D tumor position during a ∼20 s period immediately before treatment start. Compared with this situation the tracking experiments resulted in reductions of the mean rms error by 35–40% for thoracic/abdominal tumor trajectories and 65–70% for prostate trajectories.
Table I. Results of experiments [and simulations hereof shown in brackets]. Rms of position estimation errors, tracking errors and target displacement.
As shown in brackets in simulations of the experiments reproduced the target position estimation errors at the time of beam correction (570 ms later than the imaging) fairly well. The comparison between experiments and simulations is further detailed in and . The figures show scatter plots of the rms errors for all experiments versus the rms errors in simulations of the experiments. At the time of imaging ( and ) the rms position estimation error was around 0.1 mm parallel to the MLC leaves and, in most cases, below 1 mm in the kV-unresolved direction perpendicular to the MLC leaves. The simulations tended to underestimate the position estimation errors at the time of imaging because marker segmentation uncertainties were not simulated ( and ). At the time of beam correction the rms position estimation error increased to above 2 mm for a few thorax/abdomen tumor trajectories () while it was still below 1 mm for most prostate cases (). The simulated errors agreed well with the experimental errors at the time of beam correction since the simulations correctly modeled the main error contributions related to the latency ( and ).
Figure 5. Root-mean-square errors in 12 experiments for thorax/abdomen tumor trajectories versus the rms errors in simulations of the same experiments.
Figure 6. Root-mean-square errors in five experiments for prostate trajectories versus the rms errors in simulations of the same experiments.
In the simulations, the tracking error ( and ) was identical to the position estimation error at the time of beam correction ( and ) since imperfections due to gantry sag and MLC calibration were not simulated. In the experiments, such imperfections resulted in a minimum rms tracking error of around 0.4 mm, which led to some discrepancies between experiments and simulations for small rms tracking errors ( and ). Except for these small errors there was good agreement between experiments and simulations. It justifies the extension of the simulations to all available trajectories in the databases and to prolonged treatment durations and reduced tracking system latencies. The results of these simulations are summarized in along with the rms tumor position deviation from the pretreatment mean position. The mean rms tracking error over the entire tumor motion databases () was a little smaller than for the trajectories selected for experiments (, brackets) and it was almost independent of the treatment duration.
Table II. Simulation results. Rms of position estimation errors and target displacement.
Compared with the idealized motion inclusive treatments (the last two columns in ) tracking reduced the mean rms error by 30–40% for thorax/abdomen tumors and 50–80% for prostate. Halving the tracking system latency to 285 ms resulted in improved tracking accuracy for thoracic/abdominal tumors in both directions and for prostate in the direction parallel to the MLC leaves. On the other hand, faster tracking feedback did not improve the accuracy perpendicular to the MLC leaves for prostate because the overall accuracy in this direction was determined by limitations of the single-imager position estimation rather than the tracking system latency.
Discussion
This study extends the use of single kV imager based DMLC tracking from arc treatments to static gantry angles as used for 3D conformal and IMRT treatments. Although the static gantry geometry is less favorable for the single-imager target position estimation the rms tracking error is below 2 mm for most thorax/abdomen tumor trajectories and below 1 mm for most prostate trajectories.
In the kV-unresolved direction, the current simulations for static gantry angles show slightly larger position estimation errors at the time of imaging than previous simulations for rotational treatments. For thorax/abdomen tumors, the mean rms position estimation error was 0.20 mm (LR), 0.001 mm (CC), and 0.21 mm (AP) for treatments with 20 s per field (), whereas previous simulations for 72 s arc treatments resulted in mean rms errors of 0.17 mm (LR), 0.001 mm (CC), and 0.18 mm (AP) [Citation15]. For prostate, the mean rms error in the position estimation at the time of imaging was 0.16 mm (LR), 0.001 mm (CC), and 0.23 mm (AP) for treatments with 20 s per field (), while simulations of 60 s arc treatments showed mean rms errors of 0.13 mm (LR), 0.0003 mm (CC), and 0.18 mm (AP) [Citation16].
For prostate, the tracking accuracy in the kV-unresolved direction perpendicular to the MLC leaves was limited by the single imager position estimation as seen by the almost identical rms estimation errors at the time of imaging and at the time of beam correction in (Xp-direction). However, the resulting mean rms tracking error for this case was only 0.3–0.4 mm depending on the treatment duration. For prostate tracking parallel to the MLC leaves and for thoracic and abdominal tumor tracking, the tracking accuracy was limited by the long system latency of 570 ms for the current kV system, which was not designed for real time application. The impact of the latency is obvious from the large increase in the position estimation error from the time of imaging to the time of beam correction (see , , and , ). The simulations summarized in indicate that halving the tracking system latency would result in a reduction of the mean and maximum rms tracking errors of 20–30%.
The tracking method is based on standard equipment for modern linear accelerators and it is fully compatible with IMRT since portal images are not used for target position estimation. The more complex MLC sequences in IMRT will be more challenging for the real-time leaf fitting. Other challenges for clinical implementation include latency reduction [Citation15], development of robust marker segmentation in clinical x-ray images, and development of quality assurance programs for tracking.
In the experiments, the number of kV images was approximately 900 (100 pre-treatment images, 300 intra-field images, and 500 inter-field images). This is the same amount of images as typically acquired for 1.5 cone-beam CT (CBCT) scans. Compared to a CBCT scan the kV field size for DMLC tracking can be reduced to a small area around the tumor position. For prostate, previous simulations [Citation16] and experiments [Citation14] with single-imager tracking during arc therapy have demonstrated that the kV imaging frequency can be reduced from 5 Hz to 1 Hz with only a modest loss in tracking accuracy. For thoracic and abdominal tumors, the number of images can be reduced by combining the kV imaging signal with respiratory monitoring [Citation23], which has the added effect of reducing the overall latency and therefore tracking errors.
Conclusion
In conclusion, the use of single-imager based DMLC tracking was investigated for static treatment fields. The method relies on tumor (surrogate) visibility in kV x-ray images. It is fully compatible with IMRT and it results in mean rms tracking errors below 2 mm for most thorax/abdomen tumor trajectories and below 1 mm for most prostate trajectories.
Acknowledgements
We gratefully thank Drs Patrick Kupelian and Katja Langen, MD Anderson Cancer Center Orlando, for the prostate trajectories, Drs Yelin Suh and Sonja Dieterich, Stanford University, for the thoracic/abdominal tumor trajectories, Herbert Cattell, Varian Medical Systems, for substantial contributions to the DMLC tracking program, and Hassan Mostafavi and Alexander Sloutsky, Varian Medical Systems, for the marker extraction software used for offline MV image analysis. This work was supported by NCI Grant R01CA93626 and by research grants from Varian Medical Systems, Palo Alto, CA and CIRRO - The Lundbeck Foundation Center for Interventional Research in Radiation Oncology and The Danish Council for Strategic Research.
Declaration of interest: The authors report no conflicts of interest. The authors alone are responsible for the content and writing of the paper.
References
- Guckenberger M, Krieger T, Richter A, Baier K, Wilbert J, Sweeney RA, . Potential of image-guidance, gating and real-time tracking to improve accuracy in pulmonary stereotactic body radiotherapy. Radiother Oncol 2009;91:288–95.
- Korreman SS, Juhler-Nøttrup T, Boyer AL. Respiratory gated beam delivery cannot facilitate margin reduction, unless combined with respiratory correlated image guidance. Radiother Oncol 2008;86:61–8.
- Korreman SS, Juhler-Nøttrup T, Persson GF, Pedersen AN, Enmark M, Nyström H, . The role of image guidance in respiratory gated radiotherapy. Acta Oncol 2008;47: 1390–6.
- Juhler-Nøttrup T, Korreman SS, Pedersen AN, Persson GF, Aarup LR, Nyström H, . Interfractional changes in tumour volume and position during entire radiotherapy courses for lung cancer with respiratory gating and image guidance. Acta Oncol 2008;47:1406–13.
- Jensen HR, Hansen O, Hjelm-Hansen M, Brink C. Inter- and intrafractional movement of the tumour in extracranial stereotactic radiotherapy of NSCLC. Acta Oncol 2008;47:1432–37.
- Voort van Zyp NC, Prevost JB, Hoogeman MS, Praag J, van der Holt B, Levendag PC, . Stereotactic radiotherapy with real-time tumor tracking for non-small cell lung cancer: Clinical outcome. Radiother Oncol 2009;91:296–300.
- D'Souza WD, Malinowski KT, Van Liew S, D'Souza G, Asbury K, McAvoy TJ, . Investigation of motion sickness and inertial stability on a moving couch for intra-fraction motion compensation. Acta Oncol 2009;48:1198–203.
- Keall PJ, Kini VR, Vedam SS, Mohan R. Motion adaptive x-ray therapy: A feasibility study. Phys Med Biol 2001;46:1–10.
- Zimmerman J, Korreman S, Persson G, Cattell H, Svatos M, Sawant A, . DMLC motion tracking of moving targets for intensity modulated arc therapy treatment: A feasibility study. Acta Oncol 2009;48:245–50.
- Falk M, Munck af Rosenschöld P, Keall P, Cattell H, Cho B, Poulsen P, . Real-time dynamic MLC tracking for inversely optimized arc radiotherapy. Radiother Oncol 2010;94:218–23.
- Katoh N, Onimaru R, Sakuhara Y, Abo D, Shimizu S, Taguchi H, . Real-time tumor-tracking radiotherapy for adrenal tumors. Radiother Oncol 2008;87:418–24.
- Wiersma RD, Mao W, Xing L. Combined kV and MV imaging for real-time tracking of implanted fiducial markers. Med Phys 2008;35:1191–8.
- Cho B, Poulsen PR, Sloutsky A, Sawant A, Keall P. First demonstration of combined kV/MV image-guided real-time dynamic multileaf-collimator target tracking. Int J Radiat Oncol Biol Phys 2009;74:859–67.
- Poulsen PR, Cho B, Sawant A, Keall PJ. Implementation of a new method for dynamic multileaf collimator tracking of prostate motion in arc radiotherapy using a single kV imager. Int J Radiat Oncol Biol Phys 2010;76:914–23.
- Poulsen PR, Cho B, Ruan D, Sawant A, Keall PJ. Dynamic multileaf collimator tracking of respiratory target motion based on a single kilovoltage imager during arc radiotherapy. Int J Radiat Oncol Biol Phys 2010;77:600–7.
- Poulsen PR, Cho B, Keall PJ. Real-time prostate trajectory estimation with a single imager in arc radiotherapy: A simulation study. Phys Med Biol 2009;54:4019–35.
- Malinowski K, Noel C, Lu W, Lechleiter K, Hubenschmidt J, Low D, . Development of a 4D Phantom for patient-specific, end-to-end radiation therapy QA. Proc SPIE Int Soc Opt Eng 2007;6510, 65100E–65101–65100E–65109.
- Suh Y, Dieterich S, Cho B, Keall PJ. An analysis of thoracic and abdominal tumour motion for stereotactic body radiotherapy patients. Phys Med Biol 2008;53:3623–40.
- Langen KM, Willoughby TR, Meeks SL, Santhanam A, Cunningham A, Levine L, . Observations on real-time prostate gland motion using electromagnetic tracking. Int J Radiat Oncol Biol Phys 2008;71:1084–90.
- Ruan D. Kernel density estimation-based real-time prediction for respiratory motion. Phys Med Biol 2010;55:1311–26.
- Litzenberg DW, Moran JM, Fraass BA. Verification of dynamic and segmental IMRT delivery by dynamic log file analysis. J Appl Clin Med Phys 2002;3:63–72.
- Sawant A, Venkat R, Srivastava V, Carlson D, Povzner S, Cattell H, . Management of three-dimensional intrafraction motion through real-time DMLC tracking. Med Phys 2008;35:2050–61.
- Cho B, Poulsen PR, Keall PJ. Real-time tumor tracking using sequential kV imaging combined with respiratory monitoring: A general framework applicable to commonly used IGRT systems. Phys Med Biol 2010;55:3299–316.