Abstract
Introduction. Polarographic oxygen-sensitive electrodes have demonstrated prognostic significance of hypoxia. However, its routine application is limited. 18F-FMISO PET scans are a noninvasive approach, able to measure spatial and temporal changes in hypoxia. The aim of this study was to examine the association between measures of hypoxia defined by functional imaging and Eppendorf pO2 electrodes. Materials and methods. A total of 18 patients were included, nine squamous cell carcinoma of the head and neck and nine soft tissue tumors. The tumor volume was defined by CT, MRI, 18FDG-PET or by clinical examination. The oxygenation status of the tumors was assessed using 18F-FMISO PET imaging followed by Eppendorf pO2 electrode measurements. Data were compared in a ‘virtual voxel’, resulting in individual histograms from each tumor. Results. The percentages of pO2 ≤ 5 mmHg ranged from 9 to 94% (median 43%) for all 18 tumors. For 18F-FMISO PET the T/M ratio ranged from 0.70 to 2.38 (median 1.13). Analyzing the virtual voxel histograms tumors could be categorized in three groups: Well oxygenated tumors with no hypoxia and concordance between the 18F-FMISO data and the Eppendorf measurements, hypoxic tumors likewise with concordance between the two assays and inconclusive tumors with no concordance between the assays. Conclusion. This study analyzed the relationship between 18F-FMISO PET and Eppendorf pO2 electrode measurements by use of a virtual voxel model. There was a spectrum of hypoxia among tumors that can be detected by both assays. However no correlation was observed, and in general tumors were more hypoxic based on Eppendorf pO2 measurements as compared to 18F-FMISO PET.
Hypoxia persists as a major factor for radiation sensitivity [Citation1–3]. Numerous methods for studying hypoxia in tumors exist. Generally these are based on three different principles. One is the direct measurements of the physical presence of oxygen in tissue such as the Eppendorf pO2 Histograph. Such principle was the first to demonstrate the prognostic significance of hypoxia in solid tumors [Citation4] followed by other [Citation5–8], but has never been established as a routine clinical assay due to assay related limitations. The method is restricted to accessible tumors only, and cannot differentiate between pO2 values obtained from necrotic or viable hypoxic cells. The second principle is using markers reduced under hypoxic conditions. These are mainly nitroimidazole compounds that can be detected by e.g. immunohistochemistry or fluorinated radioactive nitroimidazoles detected by Positron Emission Tomography (PET). Nitroimidazoles enters the cell by passive diffusion and undergo reduction forming reactive species. If oxygen is present the compound is reoxygenated and leaves the cell, but under hypoxic conditions further reduction occurs binding the compound covalently to macromolecules and thereby ‘trapping’ it inside the cell [Citation9]. This process is dependent on enzymatic activity and thus occurs in viable hypoxic cells only [Citation9–11]. Immunohistochemical analysis requires a tumor biopsy, whereas PET is a non-invasive method that allows repeated measurements of the same tumor and can determine spatial and temporal changes in hypoxia. A range of hypoxia specific PET tracers have been investigated. 18F-fluoromisonidazole (18F-FMISO) was the first generation of hypoxia specific PET tracers and so far the most widely used [Citation12,Citation13]. Results obtained by 18F-FMISO PET have shown that the degree of hypoxia varies within individual tumors and between tumors of identical histology [Citation14]. Recently the use of other specific tracers has been applied, e.g. 18F-FAZA, 18F-EF5, Cu-ATSM [Citation9]. The third principle for measuring hypoxia is by studying endogenous markers (such as HIF-1α, CAIX), or genes regulated by hypoxia [Citation15].
In the current study hypoxia measured by 18F-FMISO PET was compared with oxygenation status obtained by the polarographic needle electrodes within the same tumor. A few clinical studies have performed such comparison, with mixed results. The aim of this study was to examine the association between measures of hypoxia defined by functional imaging and Eppendorf pO2 electrodes.
Materials and methods
Patients
A total of 18 patients with pretreatment tumor pO2 measurements and tumor hypoxia assessment using 18F-FMISO scans were included in the study. Prior to entering written informed consent was obtained from all patients and the study was approved by the Ethics Committee of Aarhus County, Denmark. Nine patients had biopsy proven squamous cell carcinoma of the head and neck (HNSCC). Five patients had soft tissue sarcomas and four had benign soft tissue tumors. Eight of these patients have previously been published [Citation16].
Tumor volume was defined by CT, MRI, 18FDG-PET or by clinical examination. In patients with HNSCC measurements were made in a single lymph node, in patients with soft tissue tumors the primary tumor was measured. In the following the term “tumor” will refer to the region studied regardless of that being primary tumor or lymph node. Measurements of hypoxia by 18F-FMISO PET and Eppendorf were in general made in the same site (either primary tumor or a lymph node). The 18F-FMISO scan was in general followed by pO2 measurements within the same day, n=13. However, in four patients the pO2 measurements were performed 6–14 days after an 18F-FMISO scan and in one case tumor pO2 measurements was followed by 18F-FMISO PET the day after.
Eppendorf
The partial oxygen pressure (pO2) of the tumors was measured by a 0.35 mm diameter computerized polarographic needle electrode (Eppendorf, Germany). Further details are described elsewhere [Citation17]. In short, the computerized oxygen electrode was inserted into the tumor under visual guidance and multiple measures of pO2 were obtained as the probe moved automatically along a measurement track. The distance between each pO2 value was 0.7 mm, and represents the average pO2 of a sampling range that covers several cell layers irrespective of cell origin (malignant or normal) and viable status. The length and number of tracks depended on tumor size and accessibility. In order to minimize intra-tumor variability a minimum of three electrode tracks were obtained per tumor. Tumor oxygenation status was reported as the fraction of pO2 measurements ≤ 5 mmHg.
18F-FMISO PET
18F-FMISO was synthesized as previously described [Citation18]. The PET scans were performed using a Siemens ECAT EXACT HR 47 scanner. Patients were intravenously injected by 400 MBq 18F-FMISO (median 394, range 218–462 MBq) and a static scan was performed 150–249 minutes later (medium 211 minutes). The HNSCC patient wholebody scans were reconstructed with the OSEM method (16 subsets and 6 iterations) and a 10 mm gaussian filter. The resulting images contained 128 × 128 × 92 voxels with a size of 4.4 × 4.4 × 4.4 mm3. The scans of the patients with soft tissue sarcomas and benign soft tissue tumors each consisted of a single bedposition and were reconstructed using the same algorithm and resampled to the same voxelsize (4.4 × 4.4 × 4.4 mm3). For reference additional ROIs were drawn in muscle tissue. Data was reported as ratios of tumor to muscle radioactivity (T/M ratio).
Data analysis
The virtual voxel was generated to allow a direct comparison of voxel based distributions of hypoxia in a tumor measured by 18F-FMISO PET and Eppendorf pO2 electrodes respectively, . In order to perform this comparison the Eppendorf pO2 measurements were converted to an “Eppendorf virtual voxel”. Since the voxel size of the 18F-FMISO PET scan in this study was 4.4 × 4.4 × 4.4 mm3, the Eppendorf pO2 measurements of seven successive pO2 values (7 × 0.7 mm = 4.9 mm3) were aligned to represent one dimension of an 18F-FMISO voxel. The alignment of the pO2 measurements were done consecutively i.e. the first “Eppendorf virtual voxel” consisted of seven pO2 measurements number 1 to 7, the next of numbers 2 to 8 etc. This approach was used in order to simulate This approach was used in order to simulate the partial volume effect inherent in PET data, where the signals in neighboring voxels are correlated. After grouping the pO2 values in “Eppendorf virtual voxels”, the amount of hypoxia in each voxel was determined. In this study Eppendorf pO2 values ≤ 5 mmHg were defined as being hypoxic. Thus, for each tumor the percentage of pO2 values ≤ 5 mmHg was determined for each “Eppendorf virtual voxel” (e.g. if 3/7 pO2 values were ≤ 5 mmHg = 42% hypoxia in the “Eppendorf virtual voxel”, if 1/7 pO2 value ≤ 5 mmHg = 14% hypoxia). For each tumor the distribution of “Eppendorf virtual voxel hypoxic fraction” are presented in a histogram ( and ).
Figure 1. The virtual voxel histogram. For each tumor the Eppendorf pO2 measurements of seven successive pO2 values were aligned to resemble signal obtained from an 18F-FMISO PET voxel in one dimension (A). Eppendorf pO2 measurements from patient number 5 (B) converted to a virtual voxel histogram (C). 18F-FMISO PET data from patient number 5 (D) converted to a virtual voxel histogram (E). A corresponding virtual voxel histogram from patient number 2 (F). For direct comparison with the Eppendorf virtual voxel histogram the 18F-FMISO data (percentage of “hypoxia within voxel”) was rounded to nearest seventh part percent (0, 14, 28 … or 100%).
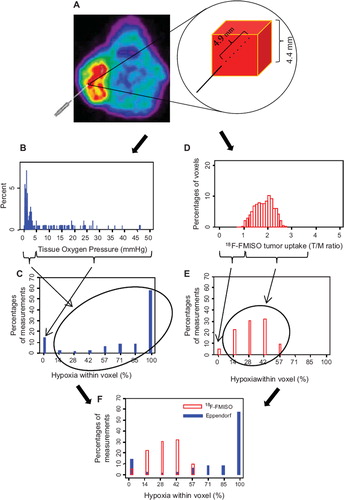
For each tumor the 18F-FMISO T/M ratio in each individual voxel was calculated; voxel values ≤1 were defined as non hypoxic (assuming muscle tissue is non hypoxic) whereas voxel values ≥ 3.7 was defined as being hypoxic. The percentage of hypoxia was calculated within each voxel by dividing the actual T/M value with 3.7 ( and ). For each patient median hypoxia based on the above analysis was determined for 18F-FMISO and Eppendorf pO2 measurements, respectively.
Results
Patient and tumor characteristics are shown in . Tumor size varied considerably with a range of 6 to 2 593 ml (median 55 ml). No correlation was observed between tumor volume and hypoxia determined by the physiological pO2 or by 18F-FMISO PET. Eppendorf pO2 showed that the percentages of pO2 ≤ 5 mmHg ranged from 9 to 94% (median 43%) for all 18 tumors. The median number of tracks was 6 (range 4–10) and the number of pO2 values ranged from 56 to 230 (median 108). The range of percentages of pO2 values ≤ 5 mmHg for the nine HNSCC, the five soft tissue sarcomas and the four benign tumors, were 13–94% (median 48%), 19–68% (median 44%) and 9–39% (median 31%), respectively.
Table I. Patient and tumor characteristics.
The 18F-FMISO T/M ratio among all tumors ranged from 0.70 to 2.38 (median 1.13). The nine HNSCC had an 18F-FMISO T/M ratio range of 1.18–2.38 (median 1.68). The five sarcomas had an 18F-FMISO T/M ratio range of 0.70–1.00 (median 0.78). For the four benign soft tissue tumors the 18F-FMISO T/M ratio range was 0.77–1.05 (median 0.93).
In general tumors were classified as more hypoxic based on Eppendorf pO2 measurements as compared with 18F FMISO PET. The Eppendorf pO2 measurements showed a large variation in the amount of hypoxia within the tumors. Overall HNSCC and soft tissue sarcomas were more hypoxic than the benign tumors. The 18F-FMISO T/M ratios indicated that the HNSCC were hypoxic, whereas the benign soft tissue tumors were non hypoxic by 18F-FMISO PET, with a T/M ratio close to one. Unexpectedly, the T/M ratio was also close to one in the soft tissue sarcomas.
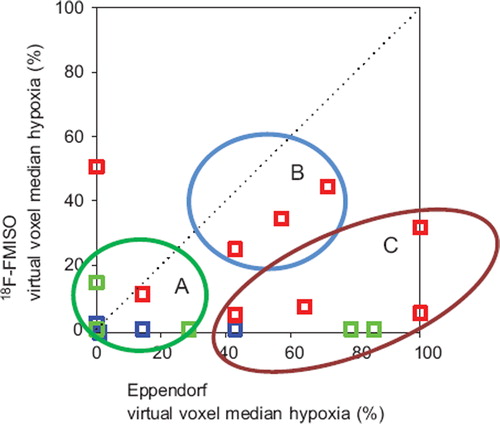
Results from all tumors were presented in as the virtual voxel median hypoxia measured by Eppendorf and 18F-FMISO PET, respectively. No statistical significant correlation could be demonstrated. From data presented in tumors were categorized in three groups: Concordance between the 18F-FMISO data and the Eppendorf measurements showing a well oxygenated tumor (), a hypoxic tumor () and a tumor with no concordance between the assays (). In the category with no concordance between the assays, generally the 18F-FMISO uptake was low (close to 0% hypoxia within the virtual voxel), whereas the low pO2 measured by Eppendorf was in disagreement to this (some measurements within the virtual voxel showing 100% hypoxia). In this group all three tumor types (HNSCC, benign tumors and sarcomas) were represented.
Figure 2. Three examples of 18F-FMISO tumor imaging and the corresponding virtual voxel histograms. A: Patient number 1 with concordance between Eppendorf pO2 measurements and 18F-FMISO PET (both showing little/no hypoxia). B: Patient number 12 likewise with concordance between Eppendorf pO2 measurements and 18F-FMISO PET (both showing hypoxia). C: Patient number 15 with lack of con cordance between Eppendorf pO2 measurements (showing high degree of hypoxia) and 18F-FMISO PET (showing very little hypoxia).
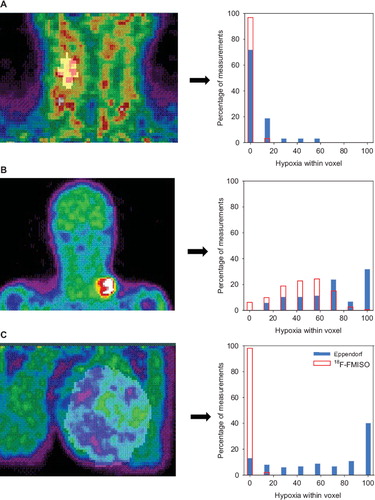
Figure 3. Comparison between the virtual voxel median hypoxia measured by Eppendorf pO2 electrodes and 18F-FMISO PET, respectively. The dotted line indicates an ideal situation with total concordance between the two different assays. Red symbol: HNSCC. Blue symbol: Benign tumors. Green symbol: Soft tissue tumors. A, B, C refers to tumor categories as exemplified in .
Discussion
The present study correlated measurements of physiological pO2 and 18F-FMISO PET. Only few clinical studies have done similar comparison and all studies have very few patients. Bentzen et al. reported of 13 patients with soft tissue tumors (of which some also participates in this study) [Citation16] and showed no correlation. In contrast Gagel et al. reported a significant correlation between 18F-FMISO T/M and the fraction of pO2 ≤ 2.5, 5 and 10 mmHg, respectively in two studies of 16 and 22 head and neck cancer patients [Citation19,Citation20].
In accordance with the current study a comparison between the nitroimidazole, pimonidazole and Eppendorf pO2 in uterine cervical cancer showed no correlation [Citation21]. This study indicated a higher degree of hypoxia by the Eppendorf pO2 measurements as compared with pimonidazole.
There are several possible explanations for the disagreement between results obtained by the two assays. The 18F-FMISO PET scan has inherent limitations; the low resolution of the clinical PET scanner; signal from a single voxel represents a large heterogeneous tissue area. In a preclinical study by Busk at al. [Citation22] xenografts injected with fluoroazomycin arabinoside (18F-FAZA, a similar PET hypoxia-tracer), reported that some PET pixels were classified as non-hypoxic, yet autoradiography exposed foci of hypoxic cells. These pixels would be classified correctly if the resolution was improved from 4 to 2 mm, which is the resolution of an animal micro-PET scanner [Citation23]. Other limitations for 18F-FMISO PET are the slow washout of unbound tracer from the background, the partial volume effect applying for small tumors, the 18F-FMISO data being a result of a 2–3 hour period (from 18F-FMISO injection to PET scan) resulting in primarily visualization of chronic hypoxia. Defining the tumor volume may be a source of uncertainty which unfortunately hampered the present study due to lack of proper co-registration. Improved co-registration is presumably of major importance to obtain a strong correlation as emphasized by a recent preclinical study by Chang et al. [Citation24]. They showed that 18F-FMISO PET image intensity correlated with OxyLite-measured pO2 when using a robotic system that allows 3D tracking of the electrode tip.
The Eppendorf pO2 electrodes have other characteristics; pO2 is measured instantly thereby reflecting both acute and chronic hypoxia. The necrotic areas of the tumors are identified as being hypoxic which may explain why some of the sarcomas in the current study are more hypoxic measured by Eppendorf electrodes, and have no uptake of 18F-FMISO. Furthermore, the Eppendorf pO2 measurement needle track may not be representative for the entire tumor volume.
Several assumptions applied to the “virtual voxel”-model. For the Eppendorf measurements values above 5 mmHg were defined as non hypoxic, while measurements below or equal to 5 mmHg were considered to be hypoxic. This is in agreement with in vitro studies on the 18F-FMISO hypoxic binding capacity [Citation11]. Furthermore, this value is in agreement with the level of radiobiological hypoxia [Citation25,Citation26]. The 18F-FMISO value of T/M ratio ≥ 3.7 for total hypoxia was chosen empirically as the second highest individual value of 18F-FMISO T/M ratio measured in the current study. This value is somewhat higher than what have been used in other studies [Citation12,Citation14,Citation27], but was found to be most representative for extreme hypoxia.
In conclusion this study analyzed the relationship between 18F-FMISO PET and Eppendorf pO2 electrode measurements by use of a virtual voxel model. There was a spectrum of hypoxia among tumors that can be detected by both assays. However no correlation was observed, and in general tumors were more hypoxic based on Eppendorf pO2 measurements as compared to 18F-FMISO PET.
Acknowledgements
Supported by the Danish Cancer Society, CIRRO – The Lundbeck Foundation Center for Interventional Research in Radiation Oncology and The Danish Council for Strategic Research.
Declaration of interest: The authors report no conflicts of interest. The authors alone are responsible for the content and writing of the paper.
References
- Overgaard J. Sensitization of hypoxic tumour cells – clinical experience. Int J Radiat Biol 1989;56:801–11.
- Overgaard J, Horsman MR. Modification of hypoxia-induced radioresistance in tumors by the use of oxygen and sensitizers. Semin Radiat Oncol 1996;6:10–21.
- Overgaard J. Hypoxic radiosensitization: Adored and ignored. J Clin Oncol 2007;25:4066–74.
- Kolstad P. Intercapillary distance, oxygen tension and local recurrence in cervix cancer. Scand J Clin Lab Invest Suppl 1968;106:145–57.
- Hockel M, Vorndran B, Schlenger K, Baussmann E, Knapstein PG. Tumor oxygenation: A new predictive parameter in locally advanced cancer of the uterine cervix. Gynecol Oncol 1993;51:141–9.
- Nordsmark M, Overgaard M, Overgaard J. Pretreatment oxygenation predicts radiation response in advanced squamous cell carcinoma of the head and neck. Radiother Oncol 1996;41:31–9.
- Fyles AW, Milosevic M, Wong R, Kavanagh MC, Pintilie M, Sun A, . Oxygenation predicts radiation response and survival in patients with cervix cancer. Radiother Oncol 1998;48:149–56.
- Nordsmark M, Bentzen SM, Rudat V, Brizel D, Lartigau E, Stadler P, . Prognostic value of tumor oxygenation in 397 head and neck tumors after primary radiation therapy. An international multi-center study. Radiother Oncol 2005;77: 18–24.
- Lapi SE, Voller TF, Welch MJ. Positron emission tomography imaging of hypoxia. PET Clin 2009;4:39–47.
- Rajendran JG, Krohn KA. Imaging hypoxia and angiogenesis in tumors. Radiol Clin North Am 2005;43:169–87.
- Franko AJ, Koch CJ, Garrecht BM, Sharplin J, Hughes D. Oxygen dependence of binding of misonidazole to rodent and human tumors in vitro. Cancer Res 1987;47: 5367–76.
- Koh WJ, Rasey JS, Evans ML, Grierson JR, Lewellen TK, Graham MM, . Imaging of hypoxia in human tumors with [F-18]fluoromisonidazole. Int J Radiat Oncol Biol Phys 1992;22:199–212.
- Rajendran JG, Schwartz DL, O'Sullivan J, Peterson LM, Ng P, Scharnhorst J, . Tumor hypoxia imaging with [F-18]fluoromisonidazole positron emission tomography in head and neck cancer. Clin Cancer Res 2006;12: 5435–41.
- Rasey JS, Koh WJ, Evans ML, Peterson LM, Lewellen TK, Graham MM, . Quantifying regional hypoxia in human tumors with positron emission tomography of [18F]fluoromisonidazole: A pretherapy study of 37 patients. Int J Radiat Oncol Biol Phys 1996;36:417–28.
- Sorensen BS, Toustrup K, Horsman MR, Overgaard J, Alsner J. Identifying pH independent hypoxia induced genes in human squamous cell carcinomas in vitro. Acta Oncol 2010; 49:895–905.
- Bentzen L, Keiding S, Nordsmark M, Falborg L, Hansen SB, Keller J, . Tumour oxygenation assessed by 18F-fluoromisonidazole PET and polarographic needle electrodes in human soft tissue tumours. Radiother Oncol 2003;67:339–44.
- Nordsmark M, Bentzen SM, Overgaard J. Measurement of human tumour oxygenation status by a polarographic needle electrode. An analysis of inter- and intratumour heterogeneity. Acta Oncol 1994;33:383–9.
- Bentzen L, Keiding S, Horsman MR, Falborg L, Hansen SB, Overgaard J. Feasibility of detecting hypoxia in experimental mouse tumours with 18F-fluorinated tracers and positron emission tomography—a study evaluating [18F]Fluoro-2-deoxy-D-glucose. Acta Oncol 2000;39:629–37.
- Gagel B, Reinartz P, DiMartino E, Zimny M, Pinkawa M, Maneschi P, . pO(2) Polarography versus positron emission tomography ([(18)F] fluoromisonidazole, [(18)F]-2-fluoro-2′-deoxyglucose). An appraisal of radiotherapeutically relevant hypoxia. Strahlenther Onkol 2004;180:616–22.
- Gagel B, Piroth M, Pinkawa M, Reinartz P, Zimny M, Kaiser HJ, . pO polarography, contrast enhanced color duplex sonography (CDS), [18F] fluoromisonidazole and [18F] fluorodeoxyglucose positron emission tomography: Validated methods for the evaluation of therapy-relevant tumor oxygenation or only bricks in the puzzle of tumor hypoxia? BMC Cancer 2007;7:113.
- Nordsmark M, Loncaster J, Aquino-Parsons C, Chou SC, Gebski V, West C, . The prognostic value of pimonidazole and tumour pO2 in human cervix carcinomas after radiation therapy: A prospective international multi-center study. Radiother Oncol 2006;80:123–31.
- Busk M, Horsman MR, Overgaard J. Resolution in PET hypoxia imaging: Voxel size matters. Acta Oncol 2008;47: 1201–10.
- Busk M, Horsman MR, Jakobsen S, Hansen KV, Bussink J, van der Kogel A, . Can hypoxia-PET map hypoxic cell density heterogeneity accurately in an animal tumor model at a clinically obtainable image contrast? Radiother Oncol 2009; 92:429–36.
- Chang J, Wen B, Kazanzides P, Zanzonico P, Finn RD, Fichtinger G, . A robotic system for 18F-FMISO PET-guided intratumoral pO2 measurements. Med Phys 2009;36: 5301–9.
- Horsman MR, Khalil AA, Nordsmark M, Grau C, Overgaard J. Relationship between radiobiological hypoxia and direct estimates of tumour oxygenation in a mouse tumour model. Radiother Oncol 1993;28:69–71.
- Horsman MR, Khalil AA, Siemann DW, Grau C, Hill SA, Lynch EM, . Relationship between radiobiological hypoxia in tumors and electrode measurements of tumor oxygenation. Int J Radiat Oncol Biol Phys 1994;29:439–42.
- Rajendran JG, Wilson DC, Conrad EU, Peterson LM, Bruckner JD, Rasey JS, . [(18)F]FMISO and [(18)F]FDG PET imaging in soft tissue sarcomas: Correlation of hypoxia, metabolism and VEGF expression. Eur J Nucl Med Mol Imaging 2003;30:695–704.