Abstract
Radiological pneumonitis and fibrosis are common after stereotactic body radiotherapy (SBRT) but current scoring systems are qualitative and subjective. We evaluated the use of CT density measurements and a deformable registration tool to quantitatively measure lung changes post-SBRT. Material and methods. Four-dimensional CT datasets from 25 patients were imported into an image analysis program. Deformable registration was done using a B-spline algorithm (VelocityAI) and evaluated by landmark matching. The effects of respiration, contrast, and CT scanner on density measurements were evaluated. The relationship between density and clinician-scored radiological pneumonitis was assessed. Results. Deformable registration resulted in more accurate image matching than rigid registration. CT lung density was maximal at end-expiration, and most deformation with breathing occurred in the lower thorax. Use of contrast increased mean lung density by 18 HU (range 16–20 HU; p = 0.004). Diagnostic scans had a lower mean lung density than planning scans (mean difference 57 HU in lung contralateral to tumor; p = 0.048). Post-treatment CT density measurements correlated strongly with clinician-scored radiological pneumonitis (r = 0.75; p < 0.001). Conclusions. Quantitative analysis of changes in lung density correlated strongly with physician-assigned radiologic pneumonitis scores. Deformable registration and CT density measurements permit objective assessment of treatment toxicity.
Stereotactic body radiation therapy (SBRT) for stage I non-small cell lung cancer (NSCLC) is a highly effective local therapy, and is accompanied by radiological pneumonitis and fibrosis in more than 50% of patients [Citation1–3]. Radiological findings will usually develop within three months, but can evolve beyond one year [Citation2,Citation4], making it important to differentiate treatment-induced changes from disease progression in order to avoid the risk of unnecessary salvage interventions [Citation5]. However, current scoring systems for post-SBRT radiological findings are largely qualitative in nature and have not yet been formally validated [Citation1–3].
Lung density measurements on computed tomography (CT) have been used in studying of pulmonary emphysema, where it correlates well with lung function and pathological findings [Citation6,Citation7]. Previous work suggests that density changes on CT scan can be used to quantify radiation lung damage [Citation8]. However, major challenges exist in using serial CT scans for density measurements after radiotherapy. Studies of lung density measurements have used spirometry or respiratory coaching in order to ensure that all scans are done with the same degree of inspiration [Citation9–11]. Radiotherapy planning and subsequent diagnostic follow-up scans are generally not done at uniform levels of inspiration and may not co-register accurately, potentially introducing errors in density comparisons. In addition, different CT scanners are used for planning and follow-up scans, which could affect density measurements [Citation10], and patient positioning and/or couch shape can differ. Finally, the use of intravenous (IV) contrast may differ between planning and follow-up scans.
In light of these challenges, we evaluated the use of quantitative CT density measurements using deformable registration to study acute changes in lung density in patients who had completed lung SBRT.
Material and methods
The goal of this study was to determine the feasibility and validity of measuring early CT density changes after lung SBRT, using a deformable registration algorithm. We assessed the changes in CT Hounsfield unit (HU) density with breathing, the effect of IV contrast on lung density, and differences in density measurements between planning vs. diagnostic scanners. Finally, the accuracy of deformable registration between planning and follow-up scans and correlation between CT density and severity of radiological pneumonitis was evaluated. A total of 25 patients were included in various sub-analyses in this study, although not all patients were used for each assessment.
Four-dimensional (4D) CT scans (GE Medical Systems, Waukesha, USA) acquired at 140 kVp and 100–110 mAs were used for treatment planning, as previously described [Citation12]. All diagnostic CT scans, either pre-treatment or post-treatment used here were performed on one of three different scanners at the VU Medical Center [Siemens Volume Zoom 4-slice, Siemens Sensation 64-slice (Siemens Nederland N.V., Den Haag, Netherlands) or Philips Brilliance iCT 256-slice (Royal Philips Electronics, Inc., Amsterdam, Netherlands)]. Machine settings were 120 kVp, 100 mAs, with spiral acquisition and a 0.5 s rotation time. Seventy milliliters of contrast was administered with a delay of 25 s. Scans were acquired at inspiratory breath hold. A summary of differences between planning and follow-up scans is shown in .
Table I. Summary of differences between planning and follow-up scans.
Image registration and deformation was performed using VelocityAI (version 2.2.1, Velocity Medical Solutions, Atlanta, Georgia, USA) running on a Pentium dual core PC platform equipped with Windows XP (Microsoft Corporation, Redmond, Washington, USA). Rigid registration of images with scaling was applied and manually inspected before deformation. A modified B-spline calculation algorithm computed the 3D displacement necessary for voxels to reach optimal fits, and contours attached to specific voxels were warped with the same 3D displacement. Graded levels of deformation from “coarse” to “fine” were performed using increasing number of control points (nodes). Coarse deformations were applied first, and if further deformation was needed based on visual inspection, fine deformation was applied.
VelocityAI uses a modified B-spline-based calculation algorithm combined with the Mattes formulation of the mutual information metric. B-spline algorithms allow for substantial local/regional variation in the deformation map. The underlying algorithm parameters are not user-defined but inherent in the program, and the number of control points is not specifically stated but users choose between ‘coarse’ and ‘fine’ settings on a scale. After deformation, matching was assessed qualitatively by comparing locations of major structures (e.g. great vessels, vertebrae, major airways). Voxel-HU density histograms were created for quantitative assessments of lung density, and mean lung densities were derived.
Lung density changes with breathing
To assess whether changes in normal lung density associated with breathing are detected with CT density measurements, the end-expiration phase of the 4D-CT was registered and deformed to nine other breathing phases for four patients. The lung contralateral to the patient's tumor was used for analysis. The changes in mean lung density of three defined regions of interest (ROI) were assessed on each phase of the original 4D-CT and on the deformed end-expiration scan, namely (i) whole lung, (ii) upper lung ROI, and (iii) lower lung ROI. The ROIs used were cylinders 2 cm in height x 3 cm diameter, and were exported from the planning system along with lung volumes. Density measurements on each phase of the 4D-CT were used to assess changes with breathing, whereas density measurements on the deformed end-expiratory scan were done to determine if lung densities are altered by the deformation process.
Influence of contrast and scanner
In order to study the influence of contrast on CT density measurements, patients in whom 4D-CT scans had been obtained with and without contrast at the same imaging session were identified. Our protocol calls for administration of IV contrast only in select cases to assist with contouring or centrally located tumors, and three such patients were identified in whom only the tumor-bearing region was scanned. For this assessment, the lung contralateral to the primary tumor was contoured in the contrast scan, and this scan was registered and deformed to the non-contrast scan. Changes in mean lung density on end-expiratory 4D-CT phases with and without contrast were compared.
To quantify differences in lung density between scans performed on a diagnostic scanner (with contrast) and a planning scanner (without contrast), scans of five patients who underwent diagnostic CT scans at our hospital in the month prior to SBRT were identified. The phase of the corresponding planning scan that best matched the lung volumes on the diagnostic scan was chosen, co-registered and deformed to the diagnostic scan. The mean lung HU density difference between the two scans was calculated for both lungs.
It was hypothesized that the images from different scanners would have different HU densities, but that these differences would be the similar for both lungs, allowing for correction of the ipsilateral lung density changes based on changes in the contralateral lung. This hypothesis was tested using one-third of the contralateral lung (upper, middle, or lower) that was furthest from the planes of the primary tumor. Differences measured in this contralateral region were subtracted from the ipsilateral density changes, and the accuracy of this correction was assessed. This correction factor incorporates both the use of contrast and the difference in CT scanners.
Discrimination of radiological pneumonitis
In a previous study, CT scans of SBRT patients were scored for acute radiological pneumonitis post-treatment by a consensus of three experienced thoracic radiation oncologists who were blinded to patient identifiers and treatment outcomes [Citation1]. In addition to scoring morphologic changes, judges subjectively scored the severity of radiographic findings as follows (): “severe” (more extensive than would be expected with SBRT); “moderate” (changes that are common with SBRT), “minor” (slight changes felt to be of little importance). The three-month follow-up CT scan was used to assess radiological pneumonitis.
Figure 1. Examples of radiological pneumonitis scored as mild, moderate, or severe.
For the present study, five patients were chosen from each of the first three categories (i.e. ‘none’, ‘mild’, and ‘moderate’), and three from the ‘severe’ category (due to the infrequency of this latter designation). These patients had been treated with SBRT using either 3D-conformal radiotherapy (3D-CRT) with 8–12 noncoplanar static beams or volumetric modulated arc therapy (RapidArc™ [RA], Varian Medical Systems Inc., Palo Alto, California), consisting of 2–5 arcs. Fractionation was based on tumor size and location. With the pencil beam algorithm used for 3D-CRT patients, the three fractionations were: 3 × 20 Gy, 5 × 12 Gy, or 8 × 7.5 Gy, whereas with the AAA algorithm used for RA patients, the equivalent fractionations were 3 × 18 Gy, 5 × 11 Gy, or 8 × 7.5 Gy [Citation13]. The planning target volume consisted of an internal target volume (ITV) that encompassed all motion observed on 4DCT, with an additional margin of 3–5 mm for set-up error.
Clinical characteristics of these patients were as follows: Median age 72 years (range 50–81 years), 13 (72%) were male, 13 (72%) had peripheral tumors more than 2 cm from the mediastinum, and 11 (61%) had tumors above the level of the carina. Seven patients (39%) received the 8-fraction schedule, six (33%) received 5 fractions and five (28%) received 3 fractions. The median PTV volume was 47 cm3 (range 6–96 cm3). Clinical symptoms of pneumonitis were uncommon: of these 18 patients, one (5.5%) had grade 2 radiation pneumonitis; none had grade 3 or higher pneumonitis. Given the low frequency of symptomatic pneumonitis, no correlation was attempted between density changes and symptoms.
For each patient, the phase of the 4D-CT that best matched the lung volumes on the follow-up diagnostic scan was chosen, then co-registered and deformed to the diagnostic scan. The accuracy of rigid registration and deformable registration were assessed by contouring ten structures of interest on both the planning scan and diagnostic scan in ten patients, chosen from all four severity categories. These landmarks were selected to be easily identifiable and representative of whole thorax, including components of the chest wall (sternal notch, spinous process of T5), mediastinum (carina, origin of brachiocephalic artery), bronchial tree (origins of right upper lobe and left lower lobe bronchi), and lung volumes (bilateral apices of lungs and diaphragms). If the selected bronchial landmarks could not be identified on the scan, an alternative bronchial landmark in the region was contoured. The contours from the planning scan were warped as per the 3D displacement of the rigid or deformable registration and transferred to the diagnostic scan. The contoured structure on the diagnostic scan was considered the ‘gold standard’. The locations of the centers of mass were compared to calculate the 3D displacement error. For the apices of the lungs and diaphragms, the axial displacement between the highest position of the structures was calculated.
Changes in lung density three months after treatment were assessed in two volumes: the whole ipsilateral lung, and the peri-tumoral region. In order to provide a standardized volume for all patients, the ‘peri-tumor region’ was defined as a 3 cm 3D expansion around the ITV (not including the ITV itself), excluding the chest wall and mediastinum. Changes in density due to scanner type were corrected using one-third of the contralateral lung volume remote from the tumor, as described above. The correlation between lung density changes and pneumonitis scores were assessed.
Statistical analysis
The matched-pair t-test and Spearman's correlation were used as appropriate. All statistical tests were two-sided with p ≤ 0.05 indicative of statistical significance, and all statistical analyses were performed using the Statistical Package of Social Sciences (SPSS version 15.0, Chicago, Illinois).
Results
A representative illustration of rigid and deformable registrations for a single patient is shown in . In general, rigid registration provided a good match for bony structures but not for lung inflation, which could result in errors in matching at the tumor location. In unique situations, such as pneumonitis occurring in the region of a resolved pleural effusion (), limitations were observed since the algorithm presumes that the scans contain mutual information and may not distinguish two high-density pathological processes occurring at different times but in the same location.
Figure 2. A. Representative example of using deformable registration to account for breathing. B. A unique situation illustrating the limits of deformable registration. The left-sided pleural effusion has resolved, but pneumonitis occurs in the same region. The deformed lung volume (outlined in white) does not include the region of pneumonitis.
Breathing and lung density changes
Most deformation occurred in the inferior regions of the thorax, as would be expected since these regions are closest to the diaphragm. The median diaphragmatic excursion for these four patients was 1.2 cm, and the mean change in the volume of the contralateral lung between end-expiration and end-inspiration was 134 cm3. Density changes with breathing followed a predictable pattern through the phases of the 4D-CT, with lung density maximal at end-expiration and minimal at end-inspiration (). The mean difference in HU between end-expiration and end-inspiration was 42 HU (range 19–65 HU; p = 0.027). However, on the end-expiration scan that was deformed to each phase of the 4D-CT scan, the lung densities did not change as the scan was deformed through the respiratory cycle (), indicating that the algorithm does not appreciably change density information.
Figure 3. A. Changes in lung Hounsfield unit density with breathing for four patients. Mean values are plotted for each phase of the breathing cycle. Standard deviations range from 0.001 to 0.04 (not shown). B. Lung density values as measured on the end-expiratory phase of the 4D-CT scan, after it was deformed to match each of the other phases of breathing, indicating that the HU density values did not change appreciably when the scans were deformed.
Effect of contrast and scanner
Addition of contrast for the planning 4D-CT scan resulted in a mean increase in mean lung HU density of 18 HU (range 16–20 HU), corresponding to an increase of 2.4% in mean lung density. Despite the small sample size, this difference was statistically significant (paired-sample t-test p = 0.004). The effect of contrast was most apparent on the highest HU range of the voxel-HU histograms, likely representing blood flow in small vessels.
Lung densities on diagnostic pre-treatment scans were lower (less dense) than on planning scans for the ipsilateral lung (n = 5, mean difference 47 HU; p = 0.05) and the contralateral lung (mean difference 57 HU; p = 0.048). Using differences in a remote portion of the contralateral lung to correct the ipsilateral lung density reduced the mean difference to 10 HU (range -29 to 65 HU). Although it was not possible to perfectly correct for differences between scanners using this method, on average the ipsilateral lung density was corrected to within 1% between the planning and diagnostic scanners (range −3 to 8%).
Discrimination of Radiation Pneumonitis at 3 months
A quantitative comparison of deformable and rigid registration for aligning planning and three-month follow-up scans is shown in . For most structures, the accuracy of deformable registration was within 3–5 mm, and significantly better than rigid registration. This advantage of deformable registration was most evident for structures that are highly mobile, such as the diaphragms, carina, and smaller bronchi.
Table II. Accuracy of rigid registration vs. deformable registration.*
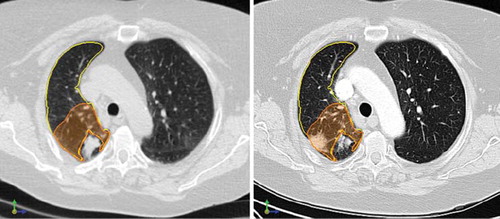
The correlation between CT density changes and physician-graded radiological pneumonitis scores is shown in , with an example of pre- and post-SBRT scans shown in . There was no correlation between severity of pneumonitis and changes in HU density in the whole ipsilateral lung (Spearman's r = 0.30; p = 0.22). However, local density changes in the region around the target correlated strongly with increased severity of radiological pneumonitis (Spearman's r = 0.75; p < 0.001). Correlations were very similar and remained strong (all r > 0.70) if the uncorrected density changes were used, or if the end-expiratory phase of the 4D-CT scan was used for baseline density measurements.
Figure 4. Changes in ipsilateral whole lung density (left) for all 18 patients (left) did not correlate with degree of pneumonitis (Spearman's r = 0.30; p = 0.22) whereas changes in lung density in the peri-tumoral region (right) showed strong correlation with radiological pneumonitis (Spearman's r = 0.75; p < 0.001). Mean values for each category are denoted by open circles, and error bars represent one standard error (SE). HU: Hounsfield units.
Figure 5. Pre- and post-treatment scans, showing radiological pneumonitis near the original tumor. Left: Deformed end-inspiratory phase of pre-treatment 4D-CT scan, with a right-sided tumor evident. The ipsilateral lung (yellow) and 3-cm expansion around the tumor (orange) are contoured. Right: Follow-up scan three months later, showing good resolution of the tumor, with a new area of radiological pneumonitis in the peri-tumoral region.
Discussion
This study demonstrates that CT density measurements using a deformable registration technique allow for quantitative assessment of radiological pneumonitis, and correlate strongly with physician-assigned pneumonitis scores. Our findings are in agreement with previous data showing that CT density measurements correlate with radiation dose and symptoms after conventionally fractionated thoracic radiotherapy, in which larger fields which encompass the primary tumor and/or associated nodal regions were applied [Citation8,Citation14,Citation15]. Changes in CT lung density can increase in a dose-dependent fashion [Citation8,Citation14], with the largest increases noted in regions receiving more than 50 Gy [Citation16].
In contrast to previous studies, we exclusively studied patients who had undergone SBRT. Our data suggests that rigid registration techniques lack the accuracy required to adequately compare density changes after SBRT. Deformable registration better accounts for changes in lung volumes and tumor position, and such precise spatial information is needed due to the steep dose fall-off with SBRT. Better spatial information on density changes may help in evaluating optimal SBRT techniques as a variety of dose-fractionation regimens and treatment delivery techniques are now in use [Citation1–3]. For patients who develop new radiographic findings in the years following treatment, the technique could be used to relate previous dose distributions to the location of the new radiological findings, which could represent benign changes, recurrent disease, or primary lung tumors that arise at a rate of 1–3% per year [Citation17].
At present, the clinical application of deformable registration in lung cancer has generally been limited to treatment planning and delivery, rather than assessment of radiological outcomes [Citation18,Citation19]. In this study, deformable registration was used to match images that could be fundamentally different, such as pre- and post-treatment scans with differences in tumor size and/or the presence of pneumonitis. This can lead to two problems due to the algorithm's assumption that the scans contain the same anatomic information: firstly, since the algorithm is based on local relationships between HU values (voxel intensity), inaccuracies can occur when different high-density abnormalities occur in the same location (such as in ). This prevents adequate registration in some patients, and therefore limits the application of this technique; Secondly, the algorithm in theory will endeavor to deform the two scans to match exactly. For example, the algorithm could deform pneumonitis until it matches the original tumor. For this reason, we used coarse deformation techniques with relatively few control points, resulting in good visual matches for lungs, normal tissues, and tumor position, without apparent local distortion of the tumor or pneumonitis itself.
It is important to keep in mind the fact that measured lung density depends on degree of inspiration, regional blood flow, and the presence of disease such as COPD [Citation20–22]. In addition, degree of contrast enhancement can be affected by factors such as patient weight, renal function, age, gender, and timing of contrast delivery [Citation23], and we were unable to evaluate the effects of these variables individually in our study. We did not attempt to correlate CT density changes with clinical pneumonitis rates, given the low event rate in the SBRT population (≤5%), which is compounded by the difficulty distinguishing clinical pneumonitis from COPD exacerbations and other respiratory diseases. We found that diagnostic scans had lower lung HU densities than planning scans performed with contrast, although this study was not powered to assess these differences for diagnostic scanners from different manufacturers. Though apparently counter-intuitive, it is likely due to the fact that the diagnostic scans are of higher quality (i.e. resulting in lung tissue that appears darker, or less dense), and that the contrast-bearing vessels are mostly in the mediastinum, which is not included in the contoured lung volumes.
The anatomic errors associated with deformable registration appear to be small, despite the fact that baseline and follow-up scans were done in different positions (with the potential for flexion/extension, rotation and translation), they were separated in time by three months, and that the deformation was not fully optimized (to avoid overfitting differences between tumor and pneumonitis). For most structures, accuracy was within 3–5 mm, and deformable registration showed the greatest advantage for highly mobile structures. It may be possible to further improve this technique by using CT scans with thinner slices, on the order of 1–2 mm. Our measurements are in keeping with other studies: a multi-institutional study showed the mean absolute error associated with deformable registration between end-expiratory and end-inspiratory phases of a 4D-CT scan to be less than 2.5 mm [Citation24], and B-spline deformation can model lung volume changes with breathing to within 3 mm [Citation25].
In conclusion, our study demonstrates that CT lung density measurement after deformable registration is a feasible and accurate technique that correlates strongly with physician-graded radiologic pneumonitis scores. This tool will allow for quantitative, objective comparisons of radiological changes after lung cancer radiotherapy.
Acknowledgements
Dr. Palma's work is supported by the Canadian Association of Radiation Oncologists Elekta Research Fellowship, the Royal College of Physicians and Surgeons, and the Ontario Institute for Cancer Research (Atlanta, Georgia, USA). This manuscript has was presented in part at the Canadian Association of Radiation Oncologists’ Annual Meeting, September 2010.
Declaration of interest: The authors report no conflicts of interest. The authors alone are responsible for the content and writing of the paper. The VU University Medical Center has a research collaboration with Velocity Medical Solutions.
References
- Palma D, Senan S, Haasbeek CJA, Verbakel WF, Vincent A, Lagerwaard FJ. Radiological and clinical pneumonitis after stereotactic lung radiotherapy: A matched analysis of 3D-conformal and volumetric modulated arc therapy techniques. Int J Radiat Oncol Biol Phys. 2010 Jun 26. [Epub ahead of print].
- Guckenberger M, Heilman K, Wulf J, Mueller G, Beckmann G, Flentje M. Pulmonary injury and tumor response after stereotactic body radiotherapy (SBRT): Results of a serial follow-up CT study. Radiother Oncol 2007;85:435–42.
- Kimura T, Matsuura K, Murakami Y, Hashimoto Y, Kenjo M, Kaneyasu Y, . CT appearance of radiation injury of the lung and clinical symptoms after stereotactic body radiation therapy (SBRT) for lung cancers: Are patients with pulmonary emphysema also candidates for SBRT for lung cancers? Int J Radiat Oncol Biol Phys 2006;66:483–91.
- Trovo M, Linda A, El Naqa I, Javidan-Nejad C, Bradley J. Early and late lung radiographic injury following stereotactic body radiation therapy (SBRT). Lung Cancer. 2010 Jul;69(1): 77–85. Epub 2009 Nov 11.
- Takeda A, Kunieda E, Takeda T, Tanaka M, Sanuki N, Fujii H, . Possible Misinterpretation of demarcated solid patterns of radiation fibrosis on CT scans as tumor recurrence in patients receiving hypofractionated stereotactic radiotherapy for lung cancer. Int J Radiat Oncol Biol Phys 2008;70: 1057–65.
- Park KJ, Bergin CJ, Clausen JL. Quantitation of emphysema with three-dimensional CT densitometry: Comparison with two-dimensional analysis, visual emphysema scores, and pulmonary function test results. Radiology 1999;211:541–7.
- Gevenois PA, De Vuyst P, de Maertelaer V, Zanen J, Jacobovitz D, Cosio MG, . Comparison of computed density and microscopic morphometry in pulmonary emphysema. Am J Respir Crit Care Med 1996;154:187–92.
- Mah K, Van DJ, Keane T, Poon PY. Acute radiation-induced pulmonary damage: A clinical study on the response to fractionated radiation therapy. Int J Radiat Oncol Biol Phys 1987;13:179–88.
- Soejima K, Yamaguchi K, Kohda E, Takeshita K, Ito Y, Mastubara H, . Longitudinal follow-up study of smoking-induced lung density changes by high-resolution computed tomography. Am J Respir Crit Care Med 2000;161:1264–73.
- Yuan R, Mayo JR, Hogg JC, Par PD, McWilliams AM, Lam S, . The effects of radiation dose and CT manufacturer on measurements of lung densitometry. Chest 2007;132: 617–23.
- Lamers RJ, Thelissen GR, Kessels AG, Wouters EF, van Engelshoven JM. Chronic obstructive pulmonary disease: Evaluation with spirometrically controlled CT lung densitometry. Radiology 1994;193:109–13.
- Lagerwaard FJ, Haasbeek CJA, Smit EF, Slotman BJ, Senan S. Outcomes of risk-adapted fractionated stereotactic radiotherapy for stage I non-small-cell lung cancer. Int J Radiat Oncol Biol Phys 2008;70:685–92.
- Hurkmans CW, Cuijpers JP, Lagerwaard FJ, Widder J, van der Heide UA, Schuring D, . Recommendations for implementing stereotactic radiotherapy in peripheral stage IA non-small cell lung cancer: Report from the Quality Assurance Working Party of the randomised phase III ROSEL study. Radiat Oncol 2009;4:1.
- Mah K, Keane TJ, Van DJ, Braban LE, Poon PY, Hao Y. Quantitative effect of combined chemotherapy and fractionated radiotherapy on the incidence of radiation-induced lung damage: A prospective clinical study. Int J Radiat Oncol Biol Phys 1994;28:563–74.
- Wennberg B, Gagliardi G, Sundbom L, Svane G, Lind P. Early response of lung in breast cancer irradiation: Radiologic density changes measured by CT and symptomatic radiation pneumonitis. Int J Radiat Oncol Biol Phys 2002; 52: 1196–206.
- Ma J, Zhang J, Zhou S, Hubbs JL, Foltz RJ, Hollis DR, . Association between RT-induced changes in lung tissue density and global lung function. Int J Radiat Oncol Biol Phys 2009; 74:781–9.
- Martini N, Bains MS, Burt ME, Zakowski MF, McCormack P, Rusch VW, . Incidence of local recurrence and second primary tumors in resected stage I lung cancer. J Thorac Cardiovasc Surg 1995;109:120–9.
- Kaus MR, Brock KK. Deformable image registration for radiation therapy planning: Algorithms and applications. Biomechanical systems technology. Leondes CT. Singpore: World Scientific Publishing Company, Inc.; 2007.
- Lu W, Olivera GH, Chen Q, Ruchala KJ, Haimerl J, Meeks SL, . Deformable registration of the planning image (kVCT) and the daily images (MVCT) for adaptive radiation therapy. Phys Med Biol 2006;51:4357–74.
- Verschakelen JA, Van FL, Laureys G, Demedts M, Baert AL. Differences in CT density between dependent and nondependent portions of the lung: Influence of lung volume. AJR Am J Roentgenol 1993;161:713–7.
- Camiciottoli G, Bartolucci M, Maluccio NM, Moroni C, Mascalchi M, Giuntini C, . Spirometrically gated high-resolution CT findings in COPD*. Chest 2006;129:558–64.
- Lamers RJ, Kemerink GJ, Drent M, van Engelshoven JM. Reproducibility of spirometrically controlled CT lung densitometry in a clinical setting. Eur Respir J 1998;11: 942–5.
- Bae KT. Optimization of contrast enhancement in thoracic MDCT. Radiol Clin North Am 2010;48:9–29.
- Brock KK. Results of a Multi-Institution Deformable Registration Accuracy Study (MIDRAS). Int J Radiat Oncol Biol Phys. 2010 Feb 1;76(2):583–96. Epub 2009 Nov 10.
- Schreibmann E, Chen GTY, Xing L. Image interpolation in 4D CT using a BSpline deformable registration model. Int J Radiat Oncol Biol Phys 2006;64:1537–50.