Abstract
Purpose. To investigate inter-/intra-observer variability in defining the prostate by use of planning computed tomography (PCT) and cone beam CT (CBCT) with magnetic resonance image (MRI) as guidance prior to the introduction of an adaptive radiotherapy for prostate cancer. Material and methods. We reviewed PCT and firstly acquired CBCT datasets of each ten patients with prostate cancer. Three physicians independently delineated the prostate based on PCT and CBCT with MRI as guidance, allowing determination of inter-physician variability. Two physicians repeated prostate contouring three times in total to investigate intra-physician variability. We compared delineated prostate volumes in terms of the generalized conformity index (CIgen), maximum variation ratio (MVR), and center of mass (COM). Results. There were no significant inter-/intra-observer differences in the estimation of prostate volume on both PCT and CBCT. For both inter- and intra-observer variability in contouring the prostate gland, there were no significant differences in MVR between PCT and CBCT. The CIgen for inter-observer variability was 0.74 by PCT and 0.69 by CBCT. The CIgen for intra-observer variability on PCT and CBCT was 0.84 and 0.81 for observer 2 and 0.76 and 0.73 for observer 3. COM analyses showed that the greatest inter-/intra-observer variability was in the measurement of the prostate apex and base. With respect to CIgen and COM analysis for the inter-observer variability, more precise delineation of the prostate was possible on PCT than CBCT. More precise contouring in terms of both CIgen and COM was demonstrated by observer 2 than observer 3. Conclusions. Despite some ambiguity in apex and base level, there was a good consistency in delineating the gland on CBCT plus MRI-guided modification both among/within observer(s), without any significant difference from the consistency in defining the prostate on PCT. This study provides a framework for future studies of CBCT imaging of the prostate.
A recent meta-analysis of studies that examined treatment of prostate cancer by high dose radiotherapy demonstrated that the dose escalation resulted in improved biochemical control of the disease [Citation1], at the cost of increased late toxicity [Citation2,Citation3]. This complications are attributable to the proximity of the prostate and its surrounding organs, and motion of the prostate in response to rectal and bladder filling, so that the planning target volume (PTV) margin must be enlarged to avoid suboptimal target coverage. Recently, several groups showed that dose escalated radiotherapy using three-dimensional conformal and/or intensity modulated radiotherapy combined with image-guided techniques result in favorable biochemical control rate without significant increase of toxicity [Citation4,Citation5].
Numerous image-guidance strategies or their combinations allow better determination of the position of the prostate prior to treatment [Citation6–9]. Useful techniques include the endorectal balloon [Citation6], trans-abdominal ultrasound guidance, onboard volumetric imaging (kV- and MV-computed tomography imaging) [Citation7,Citation9], computed tomography-on-rails (CT-on-rails), and implanted radiographic fiducials [Citation8]. Implantation of fiducial markers is feasible and safe in general [Citation8], but has some disadvantages. First, although severe complications are rare, the procedure is invasive. Second, the approach does not provide information on the position of adjacent organs. Finally, the technique can provide limited information on whether the prostate gland swells or shrinks during the course of radiotherapy indirectly, based on inter-marker distance only. Cone beam CT (CBCT) is a non-invasive method that provides three-dimensional information on the position of the prostate and adjacent organs, such as the bladder and rectum. Previous studies have shown that contouring of the prostate gland on CT images is not consistent, especially at the prostatic apex and base [Citation10,Citation11] and that addition magnetic resonance image (MRI) to CT resulted in decrease of the inter-observer contouring variation, especially at the prostate apex level [Citation12]. Recently, a study on MV helical CT guidance using of a helical tomotherapy unit demonstrated the value of MV helical CT in terms of inter-user variability of the image registration, despite the fact that it is inferior to kV CT [Citation7]. However, except for few studies, little is known about the accuracy of prostate delineation by CBCT [Citation9,Citation13,Citation14].
To apply to image-guided adaptive radiotherapy for the prostate cancer using CBCT, we investigated the accuracy of the prostate localization in CBCT images in terms of inter- and intra-observer variability. Because relatively poor image quality of CBCT, compared to CT, may increase the variation and reduce its usefulness for adaptive RT. The primary goal of the present study was to determine inter- and intra-observer variability in prostate delineation by CBCT and PCT. The secondary goal was to define anatomic locations where disparities were most significant.
Materials and methods
Patient characteristics and fiducial insertion
In 2008, ten consecutive patients with biopsy-confirmed prostate cancer who underwent IMRT with CBCT-based image guidance were selected for the present study (). A radiologist implanted three gold fiducial markers (0.9 mm in diameter, 3 mm in length), using guidance from transrectal ultrasound. In general, one marker was implanted in the prostatic apex region and the other two in the prostatic base.
Table I. Patients characteristics.
Planning CT (PCT) and CBCT acquisition
A week after insertion of the fiducials, a PCT simulation was performed with the patient in the supine position, the use of intravenous contrast agents, and the patient in a free-breathing state. All subjects were asked to void immediately before PCT and every subsequent radiotherapy session. A knee- with/without ankle-positioning cushion (Knee-Lok and Foot-Lok positioner, CIVCO, Iowa, USA) was used for patient comfort and setup reproducibility, but no other immobilization procedures were employed. The pelvis was scanned using a Light Speed RT instrument (GE Healthcare, St. Giles, UK), with a slice thickness of 2.5 mm. The reconstructive field of view was 42.7 cm, the uniform out-of-plane image resolution was 2.5 mm (i.e., the slice spacing), and the in-plane matrix was 512 × 512 pixels.
The details of CBCT acquisition process were described in the study by Foroudi et al. [Citation15]. Briefly summing up, CBCT was performed immediately after the setup, guided by skin marks. The CBCT images of a prostate cancer patient were acquired using On-Board Imager (OBI, Varian Medical Systems, Palo Alto, CA, USA) system which consists of amorphous Silicon flat panel detector and kV x-ray source mounted on Varian Clinac iX linear accelerator. We used a filtered back projection technique for CBCT image reconstruction. The field of view was set to 50 cm in the axial direction, and 14 cm in the superior-inferior direction, with a slice thickness of 2.5 mm. CBCT in-plane dimension is also 512 × 512, and the pixel size equals to 0.977 (= 500/512) mm. To maintain the image quality of the CBCT images, normalization/calibration was routinely performed to account for radiation scatter and beam hardening which can cause cupping artifacts in reconstructed images.
Delineation of the prostate
Prior to individual definition of the prostate gland, each observer received supplemental short lecture on pelvic radiologic anatomy by a genitourinary-specialized radiologist. Three physicians defined the prostate contour on axial scan of PCT and CBCT with T2 weighted MRI on a different computer monitor. The apex of the prostate was confirmed to be superior to the bulb of the penis and urogenital diaphragm. The seminal vesicles, urinary bladder, rectum, and neurovascular bundles were excluded for the definition of the base, anterior, posterior prostate to limit our study to the prostate only. Corresponding axial T2 weighted MRIs were used when the margin between prostate and adjacent organs were indeterminate. A treatment planning system (Eclipse; Varian Medical Systems, Inc., Palo Alto, CA, USA) was used to outline the prostate. Study protocols regarding image magnification, window level, and use of a contouring tool (such as interpolation) were set before delineation of the prostate. On defining the prostate, all clinical information such as physical examination, laboratory findings and pretreatment MRI data were made available to the observers. We did not fuse MRI and CT images for contouring because the fusion is not a daily routine practice performed at the treatment control room in our institution and because it requires a few additional minutes. Only the first set of CBCT was used for analysis of inter-observer variability to avoid the potentially confounding effects of changes in prostate volume and contouring accuracy during the treatment period. To assess the intra-observer variability, observer 2 and 3, blinded with respect to the previous volumes contoured by them, repeated measurements to define the prostate three times in total both on PCT and CBCT scans. There was a delay of at least one week between each outlining of the prostate to eliminate recall of the previous contouring.
Analysis of inter-/intra-observer variability
Data on the volume of each delineated prostate both on PCT and on CBCT were imported from the treatment planning system into MatLab software (The MathWorks, Inc., Natick, MA, USA) and the correspondence in volume determination (inter- and intra-observer variability) was quantified by the use of a maximum variation ratio (MVR) which indicated the ratio maximal to minimal volume of the prostate gland and a conformity index (CI). CI was defined as the ratio of common volume to encompassing volume. As the common volume tends to decrease as the number of delineations increases, we used a generalized CI (CIgen), which is not biased by the number of delineations. The CIgen is defined as:
where k is the number of delineated volumes containing a specific point, K is the total number of delineations, and Vk is the volume contained in k delineations [Citation16]. This expression is simplified into:
with Ai and Aj representing the volumes delineated by the ith and jth observer, respectively. Because neither a MVR nor a CIgen can provides any information on the spatial disagreement of observations, we also reviewed the PCT and CBCT datasets using two further procedures. We computed the center of mass (COM) of each delineated prostate and then overlaid each outlining of the prostate to identify regions that were most discordant. The x (right-left), y (anterior-posterior), and z (superior-inferior) axes of the COM were computed using MatLab software. Positive x, y, and z direction mean right, anterior, and superior direction, respectively. Inter- and intra-observer variability was assessed by calculating differences in three-dimensional distances, defined as ![]() Statistical analyses were performed using the Statistical Package for Social Sciences, version 12.0 K (SPSS, Chicago, IL, USA). The Kruskal-Wallis test and Wilcoxon signed rank test were used to compare measurements of prostate volume and CIgen. All p-values were two-sided and those less than 0.05 were regarded as statistically significant.
Statistical analyses were performed using the Statistical Package for Social Sciences, version 12.0 K (SPSS, Chicago, IL, USA). The Kruskal-Wallis test and Wilcoxon signed rank test were used to compare measurements of prostate volume and CIgen. All p-values were two-sided and those less than 0.05 were regarded as statistically significant.
Results
shows the prostate volume determined by PCT and CBCT for each observer. The prostate volumes determined by CBCT were 26.19–96.81 ml (observer 1), 32.58–85.47 ml (observer 2), and 20.60–66.73 ml (observer 3). The volumes determined by PCT were 23.15–109.16 ml, 23.44–92.78 ml, and 26.02–85.52 ml, respectively. Patient 5 had the largest prostate because of a history of benign prostate hyperplasia. summarizes inter-/intra-observer variability in defining the prostate gland on PCT and CBCT in terms of MVR, CIgen, and COM analysis. For inter-observer variability, more precise delineation of the prostate gland was possible on PCT than CBCT in terms of CIgen (p = 0.013) and COM analysis (p = 0.003). For intra-observer variability, the difference between PCT and CBCT with regard to CI gen for observer 2 only was statistically significant (p = 0.045).
Figure 1. Inter-observer variability the volume of the prostate by CBCT and PCT.
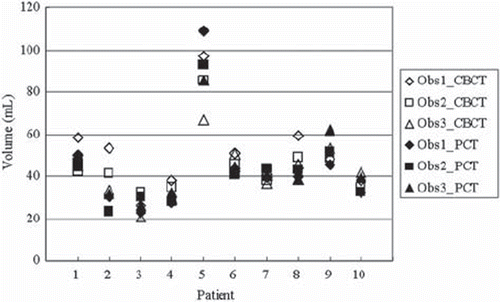
Table II. Summary of the inter-/intra-observer variability in defining the prostate gland.
Prostate volume
Inter-observer variability. There were no significant inter-observer differences in the prostate volume for PCT or for CBCT. summarizes the MVR in the prostate volume on PCT and CBCT as determined by three observers. The mean MVR on PCT and CBCT was 1.21 and 1.31, respectively. There was no statistically significant difference in MVR between PCT and CBCT (p = 0.110). Although inter-observer variability in terms of both prostate volume and MVR was not statistically significant, we computed CIgen to quantify the similarity of delineated volumes. The CIgen values for inter-observer variability in the prostate volume were 0.74 for PCT and 0.69 for CBCT, and this difference was significant (p = 0.013).
Table III. Maximum variation ratio (MVR) and volume (range, cm3) of the prostate gland delineated by three physicians both on planning CT (PCT) and cone beam CT (CBCT).
Intra-observer variability. There were no significant intra-observer differences in the prostate volume for PCT or for CBCT (p = 0.759 for observer 2, and 0.646 for observer 3). summarizes intra-observer variability in defining the prostate gland on PCT and CBCT for observer 2 and 3. For observer 2, the mean values of MVR of 10 patients were 1.11 and 1.11 for PCT and CBCT. For observer 3, the corresponding values were 1.28 and 1.30, respectively. The CIgen values for intra-observer variability in the prostate volume determined by PCT were 0.84 (observer 2) and 0.76 (observer 3), and the corresponding values on CBCT were 0.81 (observer 2) and 0.73 (observer 3). On both PCT and CBCT, the CIgen values were significantly larger for the observer 2 than for the observer 3 (p = 0.005 for PCT and CBCT). The CIgen values tended to be larger on PCT than CBCT for both observers, but these differences were statistically significant only for observer 2 (p = 0.045 for observer 2; p = 0.130 for observer 3).
Spatial analysis
Inter-observer variability. For PCT, the mean differences between the average of the COM and each COM were 0.41 mm for the right-left direction (0.02–0.99 mm), 0.59 mm for the anterior-posterior (0.01–2.19 mm), and 0.89 mm for the superior-inferior (0.05–2.02 mm). For CBCT, the corresponding values were 0.51 mm (range: 0.03–1.42 mm), 0.98 mm (0.66–2.13 mm), and 1.04 mm (0.01–2.65 mm), respectively. Thus, the mean values of the three-dimensional distances of the average COM to each COM were 1.23 mm for PCT, and 1.73 mm for CBCT, with a statistically significant difference (p = 0.003).
Intra-observer variability. For both PCT and CBCT, the COMs obtained by observer 2 were more precise than those of observer 3. For PCT, the mean values of three-dimensional distance were 0.56 mm (observer 2) and 1.07 mm (observer 3); for CBCT, these values were 0.64 mm (observer 2) and 1.34 mm (observer 3). The three-dimensional distance of the observer 2 was significantly smaller than that of the observer 3 on PCT and CBCT (p = 0.001 for PCT, p = 0.001 for CBCT). For both observers, differences in the three-dimensional distances of the two modalities (PCT vs. CBCT) were not statistically significant (p = 0.367 for observer 2 and p = 0.202 for observer 3).
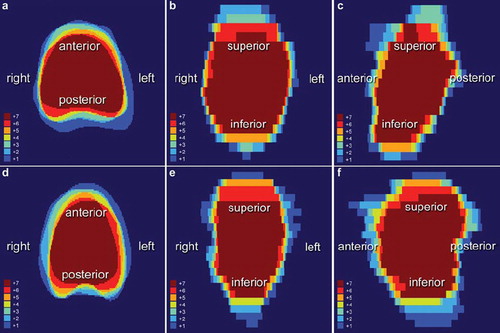
To identify the region of the prostate gland showing the largest inter-/intra-observer variability, seven sets (three sets for the inter-observer study; two- and-two additional sets for the intra-observer study) of CBCT outlined by all three observers, for each patient, were superimposed in rigid registration method using MatLab software. demonstrates the overlaid CBCT images for patient 7 and patient 2, respectively, who showed the smallest (patient 7) and largest (patient 2) maximum variation ratio in their prostate volume. These figures show that the greatest discordance was in the superior-anterior axis, and the least disagreement in the right-left direction.
Figure 2. Superimposed axial, coronal, and sagittal prostate contours from seven CBCT sets outlined by three physicians, in patient 7 (a to c) and 2 (d to f), who showed the minimum and maximum inter- and intra-observer variability in terms of the maximum variation ratio.
Discussion
The results of our study showed no statistically significant inter- and intra-observer difference in prostate volume estimation or MVR based on both PCT and CBCT. However, it should be noted that the number of observers used, and the number of observations made, can affect the level of significance. We, therefore, assessed the uniformity of each contoured volume in terms of CIgen. The CIgen for inter-physician difference was 0.69 for CBCT and 0.74 for PCT, similar to the value of 0.67 measured by Rasch and colleagues [Citation17]. In the present study, with both CBCT and PCT, the CIgen for intra-observer variability was larger than that for inter-observer variability. The ambiguous tissue contrast on CBCT and PCT may partly explain this finding. Observer 1 consistently included uncertain areas and delineated the prostate as being larger; observer 3 consistently excluded uncertain areas and outlined the prostate as being smaller. For inter-observer variability, more precise delineation of the prostate gland was possible on PCT than CBCT in terms of CIgen and COM analysis. For intra-observer variability, better precision of defining the prostate was apparent on PCT than CBCT (observer 2 only). We postulated that the poor outcomes of CBCT may be attributable to the nature of the technique which employs a cone beam and a large field of view. It is expected that image quality of CBCT may be improved with limiting the field of view at the expense of potential risk of systematic error, and with increasing the number of acquired projections at the cost of additional imaging dose to the patients. And it is demonstrated that the use of a grid and a nonlinear scatter correction algorithm has significantly improved both CBCT image uniformity and CBCT number accuracy [Citation18].
The difference between the average COM and the COM of each observer on CBCT was smallest in the right-left axis (mean: 0.51 mm, range: 0.03–1.42 mm). This finding was in accordance with our intra-observer study, in which mean differences in the right-left direction were 0.17 mm (observer 2) and 0.35 mm (observer 3). Differences in the anterior-posterior, and superior-inferior axis on CBCT were at least twice those in the right-left axis on both inter- and intra-observer analysis. shows that measurements of the inferior and superior regions of the prostate tended to be inconsistent. It is well known that MRI is superior to CT and urethrography for localization of the prostatic apex [Citation19,Citation20]. Milosevic and colleagues demonstrated that inter-observer agreement was significantly better with MRI than with CT and that there was 83% agreement between MRI and CT in the identification of patients with a low-lying apex [Citation21]. Previous studies have shown that it is difficult to differentiate the urogenital diaphragm and the Santorini plexus from the prostate, resulting in greater inter-observer variability at the prostate apex [Citation10,Citation17]. A CT study by Cox and co-workers showed that the agreement between two observers was only 30% in definition of the prostatic apex [Citation22]. From a clinical perspective, an overestimation of the size of the prostatic apex could lead to erectile dysfunction and/or anorectal sequelae. Wachter and colleagues showed that supplementary MRI provided improved delineation of the prostate, especially at the apex [Citation11], and Villeirs et al. demonstrated that addition of MRI to CT resulted in decrease of the inter-observer delineation variation, particularly at the apex level [Citation12]. For reduction in the inter-/intra-observer variability in delineation of the prostate gland on both PCT and CBCT, the authors also agree to the need of MRI based on their findings although we did not fuse MRI and CT images in present study for aforementioned reason. Instead of image registration, we allowed all three observers to delineate the prostate using an MRI image on a different computer screen as a guide; nonetheless, the prostatic apex was still one of the most difficult prostatic regions to be correctly defined. In the superior region of the prostate, variability was largest in the anteroposterior direction. One or combination of the following reasons are attributed to the large variation in anteroposterior direction at the prostatic base level: insufficient tissue contrast between the prostate and seminal vesicles, a partial volume effect at the interface with urinary bladder, and filling status of rectum [Citation23,Citation24]. In contrast to MRI image, CT images cannot clearly distinguish the prostate from seminal vesicles containing semen, which have a higher signal intensity material on MRI [Citation23]. Variability in the anteroposterior direction at the base of the prostate might be reduced by a meticulous enema before treatment, or by an endorectal balloon.
Our study has several limitations. First, we did not use a seed knockout process, as described by White and colleagues [Citation14], so metal artifacts may have been present in some images. We considered that identical daily treatment protocols were more important than the good image quality acquired upon seed knockout. Second, we did not use a strict bowel preparation method before PCT or other treatments, and large amounts of rectal gas were thus present in some CBCT images, possibly complicating delineation of the prostate. Smitsmans and colleagues [Citation24] showed that the presence of feces and gas in the rectum significantly decreased CBCT image quality. Apart from the effect of rectal filling on the CBCT image quality, it is well known that biochemical tumor control was significantly decreased in a subgroup of patients with a large rectal volume on the PCT, presumably because of geographic misses [Citation25]. Third, there were limited number of patients and observers to draw concrete evidence. Finally, patient 5 had a much larger prostate than that of other patients because of a history of the benign prostatic hyperplasia. This patient had undergone palliative transurethral resection of the prostate (TURP) several times. A TURP defect and subsequent anatomical distortion might make it more difficult to contour this prostate, resulting in larger inter- and intra-observer variation in volume. Regardless of these limitations, this is the first study of inter- and intra-observer variability in delineating the prostate by kV CBCT under the offline guidance of MRI, and considers both volumetric and spatial variability. The current study also supports the need for future work comparing fiducial markers and soft tissue matching using CBCT for image guidance.
In conclusion, we found good and similar consistency to that of PCT in outlining of the prostate gland on CBCT plus the offline guidance of MRI both among and within physician(s) despite discrepancies in contoured volume, especially in the anteroposterior and superoinferior directions. A well-defined protocol for the prostate delineation by CBCT may help to improve this procedure.
Acknowledgements
This work is supported by the Grant No. KG 2010-9 Basic Research in Medicine, Korean Institute of Medicine & GlaxoSmithKline. Presented in European Society for Therapeutic Radiology and Oncology 29, Barcelona, Spain, 2010.
Declaration of interest: The authors report no conflicts of interest. The authors alone are responsible for the content and writing of the paper.
Related Research Data
References
- Viani GA, Stefano EJ, Afonso SL. Higher-than-conventional radiation doses in localized prostate cancer treatment: A meta-analysis of randomized, controlled trials. Int J Radiat Oncol Biol Phys 2009;74:1405–18.
- Dearnaley DP, Sydes MR, Graham JD, Aird EG, Bottomley D, Cowan RA, . Escalated-dose versus standard-dose conformal radiotherapy in prostate cancer: First results from the MRC RT01 randomised controlled trial. Lancet Oncol 2007;8:475–87.
- Peeters ST, Heemsbergen WD, van Putten WL, Slot A, Tabak H, Mens JW, . Acute and late complications after radiotherapy for prostate cancer: Results of a multicenter randomized trial comparing 68 Gy to 78 Gy. Int J Radiat Oncol Biol Phys 2005;61:1019–34.
- Lips IM, Dehnad H, van Gils CH, Boeken Kruger AE, van der Heide UA, van Vulpen M. High-dose intensity-modulated radiotherapy for prostate cancer using daily fiducial marker-based position verification: Acute and late toxicity in 331 patients. Radiat Oncol 2008;3:15–9.
- Martin JM, Bayley A, Bristow R, Chung P, Gospodarowicz M, Menard C, . Image guided dose escalated prostate radiotherapy: Still room to improve. Radiat Oncol 2009;4:50–9.
- Ciernik IF, Baumert BG, Egli P, Glanzmann C, Lutolf UM. On-line correction of beam portals in the treatment of prostate cancer using an endorectal balloon device. Radiother Oncol 2002;65:39–45.
- Langen KM, Zhang Y, Andrews RD, Hurley ME, Meeks SL, Poole DO, . Initial experience with megavoltage (MV) CT guidance for daily prostate alignments. Int J Radiat Oncol Biol Phys 2005;62:1517–24.
- Moman MR, van der Heide UA, Kotte AN, van Moorselaar RJ, Bol GH, Franken SP, . Long-term experience with transrectal and transperineal implantations of fiducial gold markers in the prostate for position verification in external beam radiotherapy; feasibility, toxicity and quality of life. Radiother Oncol 2010;96:38–42.
- Moseley DJ, White EA, Wiltshire KL, Rosewall T, Sharpe MB, Siewerdsen JH, . Comparison of localization performance with implanted fiducial markers and cone-beam computed tomography for on-line image-guided radiotherapy of the prostate. Int J Radiat Oncol Biol Phys 2007;67:942–53.
- Fiorino C, Reni M, Bolognesi A, Cattaneo GM, Calandrino R. Intra- and inter-observer variability in contouring prostate and seminal vesicles: Implications for conformal treatment planning. Radiother Oncol 1998;47:285–92.
- Wachter S, Wachter-Gerstner N, Bock T, Goldner G, Kovacs G, Fransson A, . Interobserver comparison of CT and MRI-based prostate apex definition. Clinical relevance for conformal radiotherapy treatment planning. Strahlenther Onkol 2002;178:263–8.
- Villeirs GM, Van Vaerenbergh K, Vakaet L, Bral S, Claus F, De Neve WJ, . Interobserver delineation variation using CT versus combined CT + MRI in intensity-modulated radiotherapy for prostate cancer. Strahlenther Onkol 2005; 181:424–30.
- Weiss E, Wu J, Sleeman W, Bryant J, Mitra P, Myers M, . Clinical evaluation of soft tissue organ boundary visualization on cone-beam computed tomographic imaging. Int J Radiat Oncol Biol Phys 2010;78:929–36.
- White EA, Brock KK, Jaffray DA, Catton CN. Inter-observer variability of prostate delineation on cone beam computerised tomography images. Clin Oncol (R Coll Radiol) 2009; 21:32–8.
- Foroudi F, Haworth A, Pangehel A, Wong J, Roxby P, Duchesne G, . Inter-observer variability of clinical target volume delineation for bladder cancer using CT and cone beam CT. J Med Imaging Radiat Oncol 2009;53:100–6.
- Kouwenhoven E, Giezen M, Struikmans H. Measuring the similarity of target volume delineations independent of the number of observers. Phys Med Biol 2009;54:2863–73.
- Rasch C, Barillot I, Remeijer P, Touw A, van Herk M, Lebesque JV. Definition of the prostate in CT and MRI: A multi-observer study. Int J Radiat Oncol Biol Phys 1999;43:57–66.
- Letourneau D, Wong R, Moseley D, Sharpe MB, Ansell S, Gospodarowicz M, . Online planning and delivery technique for radiotherapy of spinal metastases using cone-beam CT: Image quality and system performance. Int J Radiat Oncol Biol Phys 2007;67:1229–37.
- Algan O, Hanks GE, Shaer AH. Localization of the prostatic apex for radiation treatment planning. Int J Radiat Oncol Biol Phys 1995;33:925–30.
- Kagawa K, Lee WR, Schultheiss TE, Hunt MA, Shaer AH, Hanks GE. Initial clinical assessment of CT-MRI image fusion software in localization of the prostate for 3D conformal radiation therapy. Int J Radiat Oncol Biol Phys 1997;38:319–25.
- Milosevic M, Voruganti S, Blend R, Alasti H, Warde P, McLean M, . Magnetic resonance imaging (MRI) for localization of the prostatic apex: Comparison to computed tomography (CT) and urethrography. Radiother Oncol 1998;47: 277–84.
- Cox JA, Zagoria RJ, Raben M. Prostate cancer: Comparison of retrograde urethrography and computed tomography in radiotherapy planning. Int J Radiat Oncol Biol Phys 1994; 29:1119–23.
- Schiebler ML, Schnall MD, Pollack HM, Lenkinski RE, Tomaszewski JE, Wein AJ, . Current role of MR imaging in the staging of adenocarcinoma of the prostate. Radiology 1993;189:339–52.
- Smitsmans MH, Pos FJ, de Bois J, Heemsbergen WD, Sonke JJ, Lebesque JV, . The influence of a dietary protocol on cone beam CT-guided radiotherapy for prostate cancer patients. Int J Radiat Oncol Biol Phys 2008;71:1279–86.
- de Crevoisier R, Tucker SL, Dong L, Mohan R, Cheung R, Cox JD, . Increased risk of biochemical and local failure in patients with distended rectum on the planning CT for prostate cancer radiotherapy. Int J Radiat Oncol Biol Phys 2005;62:965–73.