Abstract
Purpose. Target tracking is a promising method for motion compensation in radiotherapy. For image-based dynamic multileaf collimator (DMLC) tracking, latency has been shown to be the main contributor to geometrical errors in tracking of respiratory motion, specifically due to slow transfer of image data from the image acquisition system to the tracking system via image file storage on a hard disk. The purpose of the current study was to integrate direct image access with a DMLC tracking system and to quantify the tracking latency of the integrated system for both kV and MV image-based tracking. Method. A DMLC tracking system integrated with a linear accelerator was used for tracking of a motion phantom with an embedded tungsten marker. Real-time target localization was based on x-ray images acquired either with a portal imager or a kV imager mounted orthogonal to the treatment beam. Images were processed directly without intermediate disk access. Continuous portal images and system log files were stored during treatment delivery for detailed offline analysis of the tracking latency. Results. The mean tracking system latency for kV and MV image-based tracking as function of the imaging interval ΔTimage increased linearly with ΔTimage as 148 ms + 0.58 * ΔTimage (kV) and 162 ms + 1.1 * ΔTimage (MV). The latency contribution from image acquisition and image transfer for kV image-based tracking was independent on ΔTimage at 103 ± 14 ms. For MV-based tracking, it increased with ΔTimage as 124 ms + 0.44 * ΔTimage. For ΔTimage = 200 ms (5 Hz imaging), the total latency was reduced from 550 ms to 264 ms for kV image-based tracking and from 500 ms to 382 ms for MV image-based tracking as compared to the previously used indirect image transfer via image file storage on a hard disk. Conclusion. kV and MV image-based DMLC tracking was successfully integrated with direct image access. It resulted in substantial tracking latency reductions compared with image-based tracking without direct image access.
An essential requirement for all types of radiotherapy treatments is that the position of the target or tumor is known during treatment delivery. If the target position is uncertain, this will lead to a suboptimal treatment of the patient, and introduce errors in studies attempting to evaluate new methods within radiotherapy. Uncertainty of target position has a number of sources including setup error, tumor migration and motion due to breathing, heartbeat and bowel movement. Tracking of tumors during treatment delivery could prove an effective way of handling these errors, as it would allow the treatment beam to compensate for the motion of the target. A great deal of work has been invested in this field recently [Citation1–8]. Inherent to all real-time tracking systems is the latency between the motion of the target, and the response of the system. To compensate for the latency, prediction is used to estimate the target position with a prediction time equal to the tracking system latency [Citation9]. Prediction is only possible for periodic motion, and will generally be more precise for shorter latencies. Previous studies of image-based dynamic multileaf collimator (DMLC) tracking on a conventional linear accelerator have shown that the main geometrical tracking errors for targets undergoing respiratory motion were caused by target position prediction, which had to be performed with a long look-ahead time because of a large tracking system latency [Citation10]. It is thus of great importance to minimize the latency. A detailed study of the latency components found that the mean latency varied from 450 ms to 1790 ms dependent on the imaging frequency and whether MV portal images or orthogonal kV images were used for tracking [Citation11]. In these previous studies, the imaging system transferred the MV and kV images to the target segmentation program for tracking by writing image files to a hard disk, which were then opened by a segmentation program. This was identified as the largest single contributor to the overall latency. In the current study, the image acquisition has been improved with the implementation of direct image access in order to reduce the total latency of the system. This paper reports latency analysis for the improved system, in particular the latency improvements obtained with direct image access.
Method
DMLC tracking experiments
The design of the image-based DMLC tracking experiment is outlined in . A motion phantom with an embedded spherical tungsten marker (3 mm diameter) performed a sinusoidal motion in the superior-inferior direction. A Trilogy linear accelerator with a 120 leaf Millennium MLC (Varian Medical Systems, Palo Alto) delivered a 6 MV field with a 10 cm circular aperture and the MLC leaves aligned parallel to the phantom motion. The dose rate was 300–600 monitor units per minute. During field delivery, image-based DMLC tracking of the phantom motion was performed based on either MV portal images acquired with a PortalVision AS1000 imager or orthogonal kV images acquired with an On-Board Imager system (Varian Medical Systems).
Figure 1. Data flow of the online tracking system, and generated data logs for offline analysis. The iTools application interface and dual frame grabber is installed in the segmentation computer. The frame grabber can receive MV and kV images simultaneously, but in this study the segmentation computer only received either MV or kV images dependent on tracking type.
For both tracking types (MV or kV), images from the respective imager were acquired with a frame grabber in the segmentation computer, using iTools Capture (Varian Medical Systems, Version 1.0). The iTools Capture is a standalone application for research purposes that provides means to simultaneously grab kV and MV images from the Camera Link output of the imaging system. The iTools Capture application passively receives the images in read-only mode, preventing thus any interference with the clinical operation of the linear accelerator and the imaging systems. This allowed a locally developed segmentation program direct image access without the need for intermediate disk access. The segmentation program identified the tungsten marker position in the images (MV or kV dependent on type of tracking) and sent the segmented pixel position to a prototype DMLC tracking program on a tracking computer. The tracking program estimated the three dimensional (3D) position of the marker by assuming that the marker was 100 cm from the (MV or kV) imager focus, calculated the corresponding MLC positions, and requested the MLC change of the MLC controller [Citation12], see . For both MV and kV image-based tracking, continuous MV images were acquired and stored for later offline analysis along with data log files generated by the segmentation program, the tracking program, and the MLC controller (Dynalog files [Citation13]) as sketched in the lower part of .
MV image-based tracking was performed with image intervals ΔTimage ranging from 133 ms to 1000 ms, corresponding to frame rates between 7.5 Hz and 1 Hz. kV image-based tracking was performed with ΔTimage ranging from 67 ms (15 Hz) to 1000 ms (1 Hz). The marker motion had 20 mm peak-to-peak amplitude and period lengths between 4.3 s and 19 s. The longer periods were used with lower imaging frequencies to minimize motion blur in the MV images.
Average tracking system latency assessed from portal images
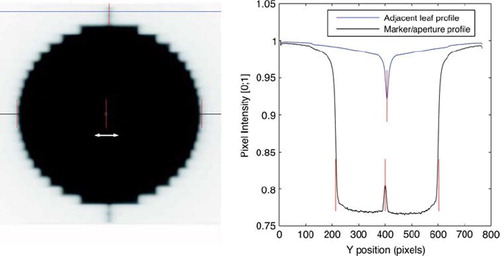
The average tracking system latency τav,MV was estimated from the continuous MV portal images as the time lag between the sinusoidal motion of the marker and the MLC aperture [Citation12,Citation14]. Both the marker position and the MLC aperture position were found from the intensity profile shown with black color in .
Figure 2. Left: example of stored MV portal image for offline analysis. The marker and MLC motion took place in the horizontal direction of the image as indicated by the white arrow. The intensity profile along the horizontal black line in the middle of the MV image was used to segment the marker and the MLC aperture as indicated in the right panel. The intensity profile along the blue line in the upper part of the MV image was used to segment the position of a closed leaf pair adjacent to the MLC aperture.
Individual latency contributions assessed from log file synchronization
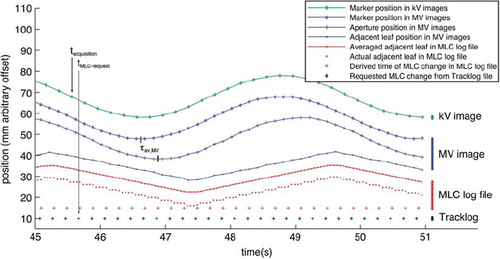
In order to obtain the individual contributions to the tracking latency the logged data streams in the lower part of were synchronized with each other by temporal alignment of the following pair-wise common data in the data streams: kV and MV images both contained the marker position, MV images and MLC log files both contained the actual MLC leaf positions, and MLC log files and Tracklog files both contained requests of new MLC positions during the tracking procedure. illustrates this synchronization for a 5 Hz kV image-based tracking experiment. As a result of the synchronization one obtains the acquisition time (tacquisition) and the corresponding time for request of a new MLC aperture position (tMLC-request) for each image on a common time scale (see ). The elapsed time between these two events is the signal processing time Tsignal, which has contributions from image acquisition (Tacquisition), marker segmentation (Tsegmentation), and MLC position calculation (TMLC-calc) as follows:
Figure 3. Overview of four synchronized data streams each shown in different color for an experiment with 5 Hz kV image based DMLC tracking. The phase shift between the marker position and the MLC aperture in the MV images (two top blue graphs) is the overall average tracking latency of the system as determined from MV images (τav,MV). The synchronization allowed tracing of tracking events for each individual image. For example, the kV image acquired at tacquisition resulted in the MLC request at tMLC-request.

Since both Tsegmentation and TMLC-calc are logged during the experiments, Tacquisition can be found for each image from Equation 1. It is the time from the marker is captured in an image until this image becomes available for marker segmentation. After MLC position calculation the MLC will move to the new position. The duration of this step is denoted TMLC-adjust, and it was calculated based on the MLC motion dynamics, described in the next section. Immediately after completed MLC motion the time lag between the marker position and the MLC aperture position had its minimum value:
Next, the MLC aperture remained in the new position until a new MLC position had been calculated from the next-coming image. At this moment, the time lag between the marker position and the MLC aperture position had its maximum value. Since this occurred at a time ΔTimage later than the previous MLC position calculation this maximum latency was:
To first order, the average tracking latency is the average of Equation 2 and 3, i.e.:
MLC motion dynamics
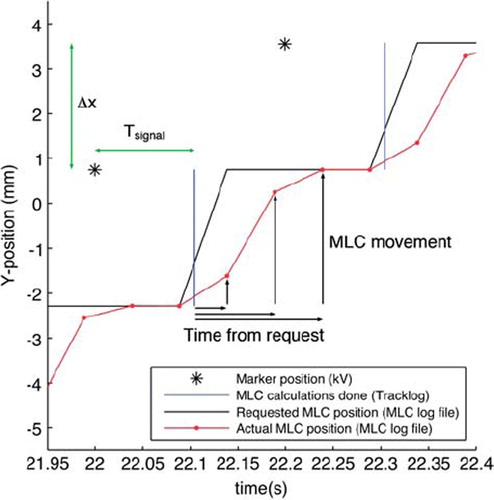
The asterisks in show the marker position captured in two consecutive kV images in the experiment with 5 Hz kV image-based tracking, while the red curve shows the actual MLC aperture motion recorded in the MLC log file. From the data stream synchronization the time for each MLC adjustment request made by the tracking was known (blue vertical lines in ). The horizontal black arrows in indicate the elapsed time from an MLC adjustment request to the subsequent recordings of the actual MLC positions in the MLC log file, while the vertical black arrows indicate the corresponding MLC movement from the MLC log file. These data were binned according to the requested MLC adjustment size Δx, i.e. the height of the black steps in . This binning resulted in the MLC movement as function of time after the MLC adjustment request for each MLC adjustment size Δx on a millisecond time scale.
Figure 4. Detailed timing diagram for a 5 Hz kV image based tracking experiment after log file synchronization. The asterisks show acquisition times for and marker positions captured in the kV images. The vertical blue lines indicate when the tracking program requested new MLC positions of the MLC controller, i.e. the time that the MLC started to adjust to the target position captured in the kV images. The black and red curves show the requested and actual MLC aperture positions, respectively, as recorded in the MLC log file with 50 ms resolution. Small black arrows indicate MLC movement as function of time after the request of a new MLC position.
Results
Average tracking system latency assessed from portal images
The average tracking system latency estimated from portal images τav,MV is shown in the downmost row of . For both MV and kV image-based tracking τav,MV increased with ΔTimage, which is expected due to longer mean waiting time from occurrence of a marker motion to detection of the motion in the next-coming x-ray image (cf Equation 4).
Table I. Components of tracking delay for kV and MV image based tracking.
Individual latency contributions assessed from log file synchronization
shows the average system tracking latency τav and its contribution from image acquisition Tacquisition as function of imaging interval ΔTimage. For kV image-based tracking, τav increased linearly with ΔTimage as 148 ms + 0.58 * ΔTimage, while the latency contribution from image acquisition was independent on ΔTimage at 103 ± 14 ms. For MV image-based tracking, the mean tracking latency was 162 ms + 1.1 * ΔTimage, with image acquisition increasing with ΔTimage as 124 ms + 0.44 * ΔTimage.
Figure 5. Latency for MV and kV image based tracking with varying imaging frequency. The topmost graph shows the average tracking system latency. The downmost graph shows the latency contribution from image acquisition alone.
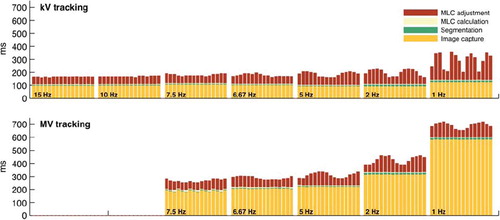
summarizes all individual tracking latency components for the seven kV image frequencies and the five MV image frequencies analyzed, and shows these contributions for 16 consecutive images used for image-based tracking. For 1 Hz and 2 Hz imaging frequencies there was a larger contribution from image segmentation, as a larger search area was used for template matching. This was necessary due to the larger marker motion between consecutive images. For low frequent imaging, cyclic variations in the marker motion magnitude between consecutive images (i.e. in the marker speed) caused corresponding variations in the MLC adjustment size and thus in the MLC adjustment duration (see ). At 1 Hz imaging frequency, the MLC adjustment duration was smaller for MV image-based tracking than for kV-based tracking because a slower phantom motion was used in order to reduce motion blur in the MV images. The MLC calculation time was independent of the MLC adjustment size. shows that the average latency determined from the MV images, τav,MV, was close to the calculated average latency, and well within the bounds of minimum and maximum calculated latency.
Figure 6. Each group shows the individual latency contributions for 16 consecutive images used for DMLC tracking based on kV images (top panel) or MV images (bottom panel) with different imaging frequencies. The total height of each column indicates the duration from image acquisition to completed MLC adjustment, i.e. the minimum latency τmin.
MLC motion dynamics
The synchronization of data streams allowed detailed analysis of the MLC motion dynamics for various requested MLC adjustment sizes as illustrated in . The graphs in were generated by binning together MLC adjustment requests of similar sizes Δx. Each graph shows the movement of the MLC leaves following an adjustment request of a given size.
Figure 7. A. MLC leaf position as function of time after requested MLC adjustment for four different requested MLC adjustment sizes Δx. B. Estimated duration time for 33 requested MLC adjustment sizes ranging from 0.216 mm to 7.60 mm. The four movements indicated with colored lines correspond to the four movements in the left panel.
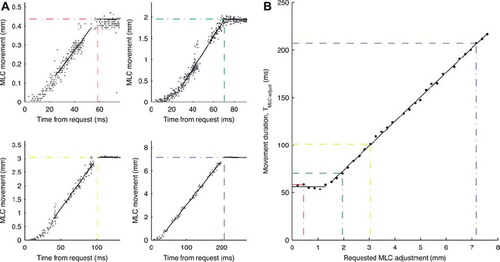
In general, the MLC leaves had an initial period of acceleration followed by a period of constant speed and ending in a deceleration that was typically faster than the initial acceleration. The time for the MLCs to move the requested distance Δx was calculated by fitting the period of constant speed with a line, and determining its intercept with the requested distance, dashed lines in . shows the combined results for all the discrete motion requests. The following relationship between requested MLC adjustments, Δx, and duration was identified by applying a linear fit for Δx > = 1.3 and assuming a constant duration for Δx < 1.3.

This relationship was used in the data analysis of the individual latency contributions to calculate TMLC-adjust for the requested movements registered in the MLC log file.
Discussion
The introduction of direct image access reduced the time for image acquisition Tacquisition considerably for both kV and MV-based tracking as compared to the use of image transfer via image file writing to a hard disk [Citation11]. Furthermore, direct image access allowed tracking with higher kV imaging frequencies than previously reported because disk access limited the imaging frequency of the previous system to around 10 Hz [Citation11]. For MV image-based tracking, the previously reported Tacquisition was 197 ms + 0.63 * ΔTimage which has now been reduced to 124 ms + 0.44 * ΔTimage. For kV image-based tracking, the reduction of Tacquisition was more pronounced with a reduction from 201 ms + 0.96 * ΔTimage to a constant 103 ± 14 ms independent of ΔTimage. For MV image-based tracking, Tacquisition depends on ΔTimage, because the MV images are exposed over a prolonged duration approximately equal to ΔTimage. That is, a newly acquired MV image will contain information that is on average half an exposure duration old, and there will therefore be an inherent delay of approximately 0.5*ΔTimage for MV tracking. This explains the observed value of 0.44 * ΔTimage for MV image-based tracking.
With the introduction of direct image access the overall DMLC tracking system latency τav was reduced for both kV and MV image-based tracking. The reduction was most pronounced for higher frame rates. For a frame rate of 5 Hz, the total latency was reduced from 550 ms to 264 ms for kV image-based tracking and from 500 ms to 382 ms for MV image-based tracking as compared to indirect image transfer via image file storage on a hard disk [Citation11]. In simulations it has been shown that halving the latency from 570 ms to 285 ms in kV image-based tracking would reduce the rms tracking error by 20–30%, dependent on tumor site [Citation15]. Since this error include target position estimation errors stemming from the use of a single imager perpendicular to the treatment beam, the accuracy improvement would be more pronounced for MV image-based tracking or for combined kV/MV image-based tracking, where the tracking accuracy is not limited by this position estimation error. As tracking errors relate to dose errors, the latency reduction obtained in the current study will be of direct dosimetric benefit for image-based DMLC tracking.
illustrates the time lag between image acquisition and completed MLC adjustment, i.e. the minimum latency τmin for the investigated imaging frequencies. As seen in the figure, image capture and MLC adjustments were the two main contributors. The MLC adjustment duration depended on the MLC leaf speed and the distance the leaves had to travel between subsequent images. The former is a property of the MLC system, while the contribution from the requested travel distance can be minimized by tracking at higher frequencies. In the clinical scenario this will be a tradeoff between fast tracking, and hence good accuracy with respect to hitting the target, and limiting the excess dose delivered at higher imaging frequencies. Also with this detailed description of latency contributions, it is possible to implement better prediction algorithms, e.g. prediction algorithms that account for the different latency, and thus look-ahead time, for different images.
The use of a spherical marker in a foam phantom with a regular motion pattern represents the simplest possible tracking situation. In a clinical setting, cylindrical or arbitrarily shaped markers would typically be used, and more elaborate marker segmentation methods would be needed [Citation16], leading to increased latency contribution from marker segmentation.
In this study, image-based tracking was investigated for a wide range of imaging frequencies up to the maximum achievable with the imaging systems. For prostate, simulations indicate that the imaging frequency could be reduced to 1 Hz with only a modest loss in localization accuracy [Citation17]. For thoracic or abdominal tumors, the imaging frequency can be reduced by supplementing the imaging systems with external optical monitoring of the breathing motion [Citation18,Citation19].
In conclusion, kV and MV image-based DMLC tracking was successfully integrated with direct image access. It resulted in substantial tracking latency reductions compared with image-based tracking without direct image access.
Acknowledgements
This work was supported by US NIH/NCI CA93626 and research grants from Varian Medical Systems, Palo Alto, CA, The Danish Cancer Society, and CIRRO – The Lundbeck Foundation Center for Interventional Research in Radiation.
Conflicts of interest: Daniel Morf and Stefan Scheib are employees of Varian Medical Systems.
References
- Dieterich S, Cleary K, D'Souza W, Murphy M, Wong KH, Keall P. Locating and targeting moving tumors with radiation beams. Med Phys 2008;35:5684–94.
- Falk M, af Rosenschöld PM, Keall P, Cattell H, Cho BC, Poulsen P, . Real-time dynamic MLC tracking for inversely optimized arc radiotherapy. Radiother Oncol 2010; 94:218–23.
- Guckenberger M, Krieger T, Richter A, Baier K, Wilbert J, Sweeney RA, . Potential of image-guidance, gating and real-time tracking to improve accuracy in pulmonary stereotactic body radiotherapy. Radiother Oncol 2009;91: 288–95.
- Katoh N, Onimaru R, Sakuhara Y, Abo D, Shimizu S, Taguchi H, . Real-time tumor-tracking radiotherapy for adrenal tumors. Radiother Oncol 2008;87:418–24.
- Nuyttens JJ, Prévost J-B, Praag J, Hoogeman M, Van Klaveren RJ, Levendag PC, . Lung tumor tracking during stereotactic radiotherapy treatment with the CyberKnife: Marker placement and early results. Acta Oncol 2006;45:961–5.
- Casamassima F, Cavedon C, Francescon P, Stancanello J, Avanzo M, Cora S, . Use of motion tracking in stereotactic body radiotherapy: Evaluation of uncertainty in off-target dose distribution and optimization strategies. Acta Oncol 2006;45:943–7.
- Zimmerman J, Korreman S, Persson G, Cattell H, Svatos M, Sawant A, . DMLC motion tracking of moving targets for intensity modulated arc therapy treatment: A feasibility study. Acta Oncol 2009;48:245–50.
- af Rosenschöld PM, Aznar MC, Nygaard DE, Persson GF, Korreman SS, Engelholm SA, . A treatment planning study of the potential of geometrical tracking for intensity modulated proton therapy of lung cancer. Acta Oncol 2010; 49:1141–8.
- Ruan D. Kernel density estimation-based real-time prediction for respiratory motion. Phys Med Biol 2010;55:1311–26.
- Poulsen PR, Cho B, Ruan D, Sawant A, Keall PJ. Dynamic multileaf collimator tracking of respiratory target motion based on a single kilovoltage imager during arc radiotherapy. Int J Radiat Oncol Biol Phys 2010;77:600–7.
- Poulsen PR, Cho B, Sawant A, Ruan D, Keall PJ. Detailed analysis of latencies in image-based dynamic MLC tracking. Med Phys 2010;37:4998–5005.
- Sawant A, Venkat R, Srivastava V, Carlson D, Povzner S, Cattell H, . Management of three-dimensional intrafraction motion through real-time DMLC tracking. Med Phys 2008;35:2050–61.
- Litzenberg DW, Moran JM, Fraass BA. Verification of dynamic and segmental IMRT delivery by dynamic log file analysis. J Appl Clin Med Phys 2002;3:63–72.
- Cho B, Poulsen PR, Sloutsky A, Sawant A, Keall PJ. First demonstration of combined kV/MV image-guided real-time dynamic multileaf-collimator target tracking. Int J Radiat Oncol Biol Phys 2009;74:859–67.
- Poulsen PR, Cho B, Sawant A, Ruan D, Keall PJ. Dynamic MLC tracking of moving targets with a single kV imager for 3D conformal and IMRT treatments. Acta Oncol 2010;49:1092–100.
- Poulsen PR, Fledelius W, Keall PJ, Weiss E, Lu J, Brackbill E, . A method for robust segmentation of arbitrarily shaped radiopaque structures in cone-beam CT projections. Med Phys 2011;38:2151.
- Poulsen PR, Cho B, Keall PJ. Real-time prostate trajectory estimation with a single imager in arc radiotherapy: A simulation study. Phys Med Biol 2009;54:4019–35.
- Cho B, Poulsen PR, Keall PJ. Real-time tumor tracking using sequential kV imaging combined with respiratory monitoring: A general framework applicable to commonly used IGRT systems. Phys Med Biol 2010;55:3299–316.
- Cho B, Poulsen PR, Sawant A, Ruan D, Keall PJ. Real-time target position estimation using stereoscopic kilovoltage/megavoltage imaging and external respiratory monitoring for dynamic multileaf collimator tracking. Int J Radiat Oncol Biol Phys 2011;79:269–78.