Abstract
Background. 18FDG-PET/CT imaging is well established for diagnosis and staging of lung tumors. However, more detailed information regarding the distribution of FDG within the tumor, also as a function of time after injection may be relevant. In this study we explore the feasibility of a combined dynamic and respiratory gated (DR) PET protocol. Material and methods. A DR FDG-PET protocol for a Siemens Biograph 16 PET/CT scanner was set up, allowing data acquisition from the time of FDG injection. Breath-hold (BH) respiratory gating was performed at four intervals over a total acquisition time of 50 minutes. Thus, the PET protocol provides both motion-free images and a spatiotemporal characterization of the glucose distribution in lung tumors. Software tools were developed in-house for tentative tumor segmentation and for extracting standard uptake values (SUVs) voxel by voxel, tumor volumes and SUV gradients in all directions. Results. Four pilot patients have been investigated with the DR PET protocol. The procedure was well tolerated by the patients. The BH images appeared sharper, and SUVmax/SUVmean was higher, compared to free breathing (FB) images. Also, SUV gradients in the periphery of the tumor in the BH images were in general greater than or equal to the gradients in the FB PET images. Conclusion. The DR FDG-PET protocol is feasible and the BH images have a superior quality compared to the FB images. The protocol may also provide information of relevance for radiotherapy planning and follow-up. A patient trial is needed for assessing the clinical value of the imaging protocol.
Lung cancer is one of the most frequent cancer types worldwide. Inoperable lung cancer patients have a poor prognosis, with a overall five year survival rate of 15% [Citation1]. Early diagnosed cases may be treated by operation, while the remaining group is normally offered radiotherapy, chemotherapy or a combination of both [Citation2]. In light of the poor prognosis, development of new diagnostic and therapeutic strategies for this group of patients is imperative for improving the treatment outcome.
Positron emission tomography (PET) is a non-invasive nuclear medicine imaging technique where the accumulation of a positron-emitting biomarker within the body may be visualized. The most common biomarker in clinical use today is 18-fluorodeoxyglucose (18FDG). 18FDG accumulates in most cancerous tissues due to the upregulation of both glucose transporters and hexokinase activity. FDG-PET is routinely used for diagnosis and staging of several types of cancers, including non-small cell lung cancer (NSCLC) [Citation3]. Promising applications of PET in oncology is radiotherapy planning, early response assessment and prediction of tumor response to therapy [Citation3–6].
Using FDG-PET, changes in metabolism during radiotherapy have been shown to correlate with treatment outcome and overall survival in lung cancers [Citation7]. Radiotherapy dose escalation in patients, who, based on their metabolic response during early therapy, are predicted to respond poorly to radiotherapy, is therefore highly relevant.
Respiratory motion of lung tumors during PET image acquisition causes artefacts which affect both quantification of FDG uptake and determination of tumor size. First, this may have direct consequences for diagnosis and staging [Citation8]. Second, the use of PET for monitoring response to therapy may require high spatial resolution of the FDG distribution in the tumor. Third, respiratory motion will also affect the planning target volume in radiotherapy if PET images are used for tumor delineation [Citation9]. With the use of respiratory gated data acquisition these artefacts can be reduced, allowing both better delineation of target volumes and improved detection [Citation8,Citation9]. Several studies report increased uptake values and reduced target volumes using respiratory gating for imaging of lung tumors, but its impact on clinical diagnosis remains to be proven [Citation8,Citation10–14].
PET, in addition to being a valuable qualitative diagnostic tool, is a quantitative imaging method. That is, the concentration of the biomarker within the body is accurately determined by the scanner and is provided in the PET images. In this way, absolute changes in metabolic activity following, for instance, radiotherapy, may be assessed directly from the images taken pre- and post treatment. In dynamic FDG-PET, the tumor uptake is monitored in space and time after injection, reflecting both the passive distribution of FDG via the vascular network and the active uptake of tracer in metabolically active cells. Thus, dynamic PET images may reflect metabolic as well as vascular status, which together may correlate more closely with tumor aggressiveness, resistance to therapy and patient outcome. Monitoring changes in such properties may be of great benefit as patient treatment become more tailored to the individual, based on response to treatment so far [Citation5,Citation15].
The current feasibility study aims at evaluating a respiratory gated and dynamic PET protocol of patients with inoperable lung tumors. The purpose was twofold. First, we wanted to investigate whether an in-house developed respiratory gating technique may be used to minimize respiratory tumor motion. The second aim was to provide data acquired in gated intervals following injection of the tracer, thus reflecting the spatiotemporal distribution of FDG within the tumor.
Material and methods
Patient selection
Four patients with inoperable NSCLC were included in the current quality assurance study. The study was approved by the local data inspectorate. Written informed consent was obtained from each patient. Minimum 4 h of fasting prior to injection of FDG was required. provides a summary of the patient characteristics and their tumor localization.
Table I. Summary of patient characteristics and localization of the tumors included in the study.
Image acquisition
The study was performed on a Siemens Biograph 16 PET/CT scanner. The dynamic and respiratory gated (DR) FDG-PET protocol included a two dimensional (2D) x-ray scan (topogram), an attenuation correction (AC) computed tomography (CT) scan and the combined respiratory gated and dynamic PET examination, starting at the time of injection and lasting 50 minutes. After the DR PET study, a conventional whole body PET/CT examination was performed. Data from the conventional examination were not included in the current work. For the DR PET study, the coverage in the patient's longitudinal direction is restricted to the length of the PET detector system, in this case 16.2 cm. Guided by the topogram and, if available, previous CT examinations, the position of the AC CT and DR PET scan was set to cover the part of the lungs where the primary tumor was situated.
During conventional PET data acquisition, sinograms are built continuously during the scan. The Siemens Biograph 16 PET/CT also has list mode (LM) data acquisition available, enabling four dimensional (4D) data acquisition, that is, gated or dynamic studies. Events are registered in a data file in chronological order. An in-house developed electronic circuit for respiratory gating was used to instruct the patient and to send trigger signals to the scanner. The trigger signal inserts time stamps into the list mode file generated on the PET/CT scanner [Citation16]. The circuit issues numbers to a display that is positioned so that it can easily be seen by the patient. The numbers count down from a preset value to 0 at a pace of one new number per second. Red numbers are displayed while the patients are supposed to hold their breath in inspiration and green numbers are shown when free breathing is allowed. The trigger signal is sent to the scanner each time the first red number is shown. A duration of 9 s for red lights and 8 s for green lights was chosen in the current study. The list mode data are rebinned into two sinograms extracted from all the breath-hold and free-breathing intervals of the study. That is, one of the sinograms consists of data acquired during 8.5 s of the breath hold (BH) period and the other consists of data acquired during the 8 s of free breathing (FB) period and 0.5 s of the BH period. Thus, the image volume that is based on the BH periods represents 50% of the events (true coincidences registered by the scanner).
PET data acquisition started at the time of injection of FDG. All PET data were acquired in list mode. The patients were instructed to perform BH at normal inspiration in the intervals provided by the display box in the four time intervals 0–5 min, 10–15 min, 25–30 min and 40–50 min. For intervals in between (5–10 min, 15–25 min and 30–40 min) the patient was allowed to breathe normally. Reconstruction of the list mode files was performed on the PET/CT scanner using the manufacturer's “LM Replay” option, which provides dynamic, static and gated processing of the list mode files. The PET images were reconstructed using a 256 × 256 matrix, providing a pixel size of 2.7 mm. The slice thickness in the longitudinal direction was 2.0 mm. The available three dimensional (3D) iterative reconstruction technique OSEM (four iterations, eight subsets) technique was employed with a Gaussian filter with full width half maximum of 3.0 mm. PET data acquired in the periods 5–10 min, 15–25 min and 30–40 min were reconstructed dynamically with time frames down to 15 s, but these images have not been investigated in the current work. The attenuation correction CT was also performed at normal inspiration and acquired in helical scan mode at 120 kV and with use of CareDose4D, where the effective mAs was set to 50. The CT images were automatically reconstructed on the scanner using a 512 × 512 matrix, pixel size 1.4 mm, slice thickness of 5.0 mm and a smooth reconstruction filter (B31f).
Image analysis
The complete PET/CT image series were transferred to an external computer. Image analysis was performed using software developed in IDL version 6.2 (Interactive Data Language, ITT Visual Information Solutions). Both the PET and CT images were resampled to arrays with dimensions equal to the original CT images in the transaxial plane (512 × 512 matrix, pixel size 1.4 mm) and to the original the PET images in the longitudinal plane (81 slices, 2.0 mm slice resolution) by extracting relevant parameters from the DICOM image headers.
The voxel values in the PET images represent FDG activity in Bq/ml. We have used the standardized uptake value (SUV) to report the magnitude of FDG uptake. The SUV is a semi-quantitative measure given by:
AVOI is the measured specific activity (kBq/ml) in a voxel or a volume of interest, Ainj the injected dose (MBq) to the patient and W the patient's bodyweight (kg) [Citation4].
For each patient the tumor was tentatively segmented by region growing in the PET images. Here, following a user-defined seed location, the growing procedure finds all pixels within the 3D images series which are connected neighbors and that fall within provided thresholds. The minimum threshold was set to a user-defined minimum SUV value, while the maximum threshold was set arbitrarily high. Hence, the defined tumor volume contains all neighboring pixels above a certain SUV value. Region growing was done in BH and FB images obtained during the 40–50 min time interval. The SUV threshold value was adjusted for each patient/tumor, but the same value was employed in corresponding BH and FB images. The lower SUV threshold was adjusted to avoid including other tissues with high FDG uptake in the segmentation, for example the heart. The ratio between the tumor volumes found in BH and FB images were extracted. Furthermore, the median SUV gradient at the tumor boundary was estimated. Here, at each voxel defining the boundary, a multiple linear regression covering all SUV values on 3 × 3 × 3 coordinate grid was performed, with the resulting slopes of the regression providing measures of the gradients in the mediolateral (x), dorsoventral (y) and caudocranial (z) directions. The median SUV gradients, calculated for both BH and FB images, thus provide a quantitative measure of the sharpness in the PET images.
The BH images acquired over the four gated time intervals 0–5 min, 10–15 min, 25–30 min and 40–50 min were employed to provide an estimate of the temporal distribution of FDG in the tumor. For this, voxel intensity values within the tumor volume were extracted for each of the four gated time intervals. From the distribution of voxel intensities, median values and upper and lower quartiles were calculated.
Results
All four patients completed the DR PET study and neither had any problems following the gating instructions nor holding their breath for the required amount of time. For display, one representative set of transaxial PET/CT images were selected for each patient, with the exception of patient 1, which had a primary tumor and a positive lymph node at two different locations. The representative PET/CT images were chosen based on a visual assessment of the images acquired in the time interval of 40–50 min. The effect of the respiratory gating was analyzed based on the images acquired in the 40–50 min time interval, while image sets from the time intervals 0–5 min, 10–15 min, 25–30 min and 40–50 min were used for the dynamic analysis.
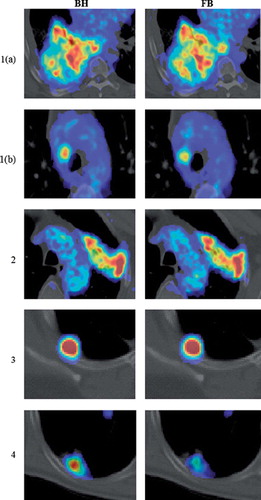
Representative BH and FB PET/CT images for all patients are shown in . For patient 1, the PET/CT scan showed intense uptake in a large primary tumor in the right lung. In addition, a positive lymph node with increased FDG uptake was also identified. For both BH and FB images, it is obvious that FDG is heterogeneously distributed within the tumor. However, the BH image shows higher FDG uptake in certain regions. In addition, the positive lymph node is clearly visible and shows a more homogeneous intensity distribution in both BH and FB images. However, the maximum FDG uptake appears to be higher in the BH image. For patient 2, the PET/CT scan showed a tumor situated apical in the left lung. This tumor also shows a large degree of heterogeneity in FDG uptake in both BH and FB images. There is a clear visual difference between the two images and it appears the activity concentration in some regions of the tumor in the BH image is slightly higher. For patient 3, a tumor situated in the upper lobe of the right lung with high FDG uptake was evident. There is no significant visual difference between BH and FB images. For patient 4, the PET/CT scan showed increased FDG uptake in a dorsal lesion in the right lower lobe. An increased FDG uptake in the BH image compared to the FB image is clearly evident.
Figure 1. Fused transaxial PET/CT images of patients 1–4, with patient 1 presenting two lesions (a and b). The display range of SUV values was manually adjusted for each patient. Images obtained following breath hold (BH, left) and free breathing (FB, right) are shown.
The segmented tumors following region growing in BH and FB images are displayed in , with individual SUV-thresholds used in the growing and resulting tumor volumes given in . The segmented tumors in the FB images are smaller or of the same size as in the BH images. Differences in BH/FB tumor volumes range from 0.5 to approximately unity.
Figure 2. Segmented tumors in patients 1–4 using region growing. Patient 1 presented two lesions (a and b). Segmentation was performed in images obtained both during breath hold (BH blue) and free breathing (FB, green). The intersection of the regions is given in red.
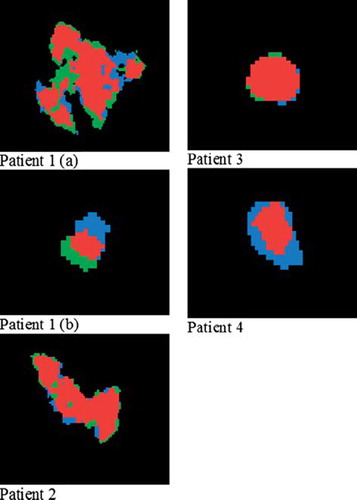
Table II. Ratio between tumor volumes for breath hold (BH) and free breathing (FB) images. Threshold represents the SUV value chosen as lower threshold for the region growing of tumor volumes. Tv corresponds to the resulting tumor volume.
shows the SUVmax, SUVmean, and standard deviations within the defined tumor volumes for both BH and FB images. For all tumors SUVmax and SUVmean is higher in the BH images. However, the effect of the respiratory gating on SUV-values is variable. When comparing SUV gradients in the tumor periphery (), the gradients in BH images are in general higher than or equal to the gradients in the FB images.
Table III. Standard uptake values (SUVmax/mean) and standard deviations (S. D.) in defined tumor regions.
Table IV. Median gradients in the mediolateral (x), dorsoventral (y) and caudocranial (z) directions for tumor volumes in breath hold (BH) and free breathing (FB) images.
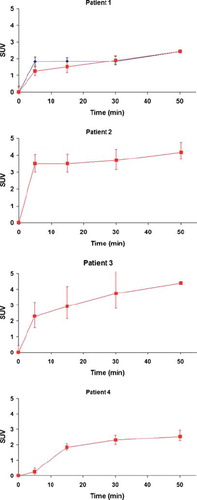
shows the median SUV in each tumor as a function of time post injection. The FDG uptake increases abruptly in the first 30 min before leveling out between 30 min and 50 min. For patient 3 and 4 there is an increasing heterogeneity in the tumor as a function of time, represented by the expanding interval between the upper and lower quartiles.
Figure 3. Median SUV within the tumor volume as a function of time for patients 1–4. For patient 1, two lesions (a, red squares and b, blue squares) were evaluated. The error bars indicate the upper and lower quartile of the SUV distribution within the tumor.
Discussion
This study demonstrates the feasibility of an in-house developed respiratory gating equipment and an accompanying dynamic PET/CT protocol for a more accurate assessment of FDG uptake in lung tumors. The equipment can easily be applied in the clinic as it is easy to install, seems to be well tolerated by the patients and a 10 minute interval is sufficient to produce images of acceptable quality. SUV values were found to increase as a result of respiratory gating, thus improving quantification of FDG uptake. Also, the PET/CT protocol opens for imaging of the tumor uptake from the time of injection, which may be valuable in studies addressing treatment response prediction and monitoring.
Respiratory movement during PET/CT examinations may result in misalignment of the fused PET/CT images, leading to attenuation correction errors and mislocalization of FDG uptake. Also, SUV measurements and volume determination in the PET images are affected by respiratory movement. Altogether, these artefacts may prevent accurate localization, diagnosis and staging of tumors [Citation8]. Several approaches to reduce respiratory artefacts in PET/CT examinations have been proposed [Citation10–14,Citation17–20]. Respiratory gated, or 4D PET, applies respiratory tracking systems to monitor the respiratory motion during the PET scan. The PET data are sorted into discrete bins corresponding to certain time intervals in the respiratory cycle. The PET images reconstructed from each of the bins correspond to a phase of the cycle. Furthermore, 4D PET can be performed together with 4D CT [Citation8]. Nehmeh and coworkers have reported increased SUV-values and reduced volumes of lung tumors using 4D PET, compared to PET images acquired during the entire respiration phase [Citation17,Citation18]. An alternative to respiratory phase gating is respiratory amplitude gating, where the PET data are sorted into bins according to respiratory amplitude ranges [Citation21]. This gating procedure is not yet clinically available, but different approaches have been suggested by Buther et al. [Citation11], van Elmpt et al. [Citation14] and Chang et al. [Citation10]. All of them resulted in images with increased SUV values compared to conventional PET images.
Breath hold techniques may also be used to reduce respiratory artefacts in PET/CT of patients with lung tumors. In this case, patients are required to hold their breath in several intervals and data from these intervals are used for constructing the PET images [Citation8]. Nehmeh et al. [Citation19] have suggested a deep inspiration breath hold (DIBH) technique where the patients are verbally coached to hold their breath in intervals up to 20 s and to breathe normally in between. Here, a respiratory tracking system was used to ensure reproducibility. Kawano et al. [Citation12,Citation21] used an alternative BH technique, where the data were acquired during a single interval, corresponding to the maximum amount of time the patients managed to hold their breath. In their first study [Citation12], 108 lung cancer patients were included, and a significant increase in SUVmax for BH images compared to conventional PET images was found. Furthermore, small lesions showed a significantly higher relative difference in SUVmax between BH/FB images than large lesions. Their second study [Citation21], including 95 lung cancer patients, showed similar results. However, a drawback with this technique is the poor signal to noise (SNR) ratio due to short data acquisition time.
Like the DIBH techniques, the currently applied respiratory gating technique has the advantage of increased SNR or decreased acquisition time as compared to 4D PET. The 10 min gating interval at 40–50 min post injection provided images of good quality (). A disadvantage of this technique is that the patient must be capable of receiving and understanding instructions on how to adjust his/her breathing. Also, patients with severely diminished lung capacity, which may often be the case with lung cancer patients, may have trouble holding their breath for the required amount of time. On the other hand, none of the patients participating in this study reported that this was a problem.
All patients in the current study had a higher SUVmax in the BH compared to the FB images, with the mean difference being 13% (). About the same difference was found for SUVmean. However, the gating procedure had a variable effect on the PET images. Patient 3 had a tumor situated in a part of the lungs which is expected to move only slightly during the respiratory cycle. In addition, the tumor was relatively large and had a high FDG uptake. Also, the primary tumors of patients 1 and 2 are both large and have heterogeneous activity distributions. Furthermore, there is no clear trend regarding the standard deviations in SUV, with the tumors of patients 1 and 2 having smaller standard deviations in the BH images, whereas the tumors of patient 3 and 4 show the opposite. There is no reason to believe that the BH images will result in smaller standard deviation, since the breathing motion is likely to smear out differences in activity between voxels of a heterogeneous region. However, due to such motion, SUV gradients in the tumor periphery are expected to be consistently smaller in FB images compared to BH images, as was shown for all cases (except for patient 3 in the mediolateral direction) ().
In this work, the tumors in the BH and FB images were tentatively segmented by region growing (). In some cases, the segmented regions almost totally overlapped (patient 2 and 3), while in other cases both the extension and the center of mass differed considerably (patient 1 and 4). Individual SUV thresholds were used in the segmentation (), but a common threshold was used for growing in the BH and FB images for each patient. Thus, as tumor motion degrade the spatial uptake pattern, smaller tumor volumes in the FB images resulted using the current segmentation procedure (). In a study comparing volume delineations using absolute and relative SUV values compared to the tumor volume as appearing on CT [Citation22], Biehl and coworkers concluded that the threshold value for tumor delineation should be individualized, taking into account parameters as tumor size, localization and heterogeneous FDG uptake within the tumor. In a recent study, it was shown that the gross tumor volume of NSCLC, as determined from surgical specimens, was best reproduced using an automatic gradient-based method [Citation23]. We aim at implementing such a method for tumor segmentation in the near future.
The currently proposed DR PET protocol includes breath hold images acquired from the time of injection. Thus, sharp images of the ‘wash-in’, or perfusion, phase of FDG was also obtained. These images largely reflect vascular, rather than metabolic, characteristics, and may well be of importance in both target volume delineation, response prediction and response monitoring [Citation15]. The tumors investigated in the current study had quite different temporal uptake characteristics (). Whereas patient 2 and 3 had a very rapid wash-in, slower initial uptake was found for patient 1 (tumor) and 4. Thus, patient 2 and 3 possibly presented more vascularized tumors. As abnormal vasculature is a marker of tumor malignancy [Citation24], these may potentially have a more aggressive phenotype. However, this should be verified by correlation analysis with pathological indices, and more studies are certainly needed to assess the added value of early uptake FDG-PET images.
The proposed DR PET protocol applied in the current study has some limitations, as it demands a high level of patient cooperation and long data acquisition time. Also, it is time consuming with respect to reconstruction of the list mode data files, as each of the intervals 0–5, 5–10, 10–15, 15–25, 25–30, 30–40 and 40–50 must be reconstructed separately. A compromise with regard to the reconstruction time while still obtaining temporally resolved images, would be to acquire dynamic PET images during normal breathing from the time of injection to 40 min after injection and then perform a respiratory gated interval in the period 40–50 min. This protocol, however, would suffer from reduced spatial resolution in the dynamic image series (0–40 min) as they are not corrected for respiratory movement. Alternatively, one may use a combined dynamic contrast enhanced CT (DCECT) and a conventional or BH FDG-PET protocol for assessing both tumor perfusion and metabolism, as the kinetic wash-in characteristics of contrast agent and FDG is expected to be similar [Citation25]. However, this must be further investigated in clinical studies.
At our hospital, patients with medically inoperable lung cancer are offered stereotactic body radiation therapy (SBRT) [Citation26]. SBRT has been proposed as the treatment-of-choice for patients with inoperable stage I non-small cell lung cancer [Citation27]. During planning and treatment, the patient is immobilized in a stereotactic body frame. In addition, at treatment, a cone beam CT is used for patient position verification. In this way, the radiation beams may be delivered with a high precision to the patient. Thus, SBRT, as performed at our hospital, is a highly conformal treatment and results in lower doses to the healthy tissue surrounding the tumor compared to conventional radiotherapy. Therefore, SBRT may be delivered hypofractionated with large fraction doses in order to maximize the probability of eradicating the tumor. By comparing BH and FB images from the current DR PET protocol, one may obtain an indication of whether the patient should be immobilized in order to reduce tumor motion. Furthermore, one may also consider additional treatment margins around hyperintense regions within the tumor in order reduce the risk of missing these regions with the treatment beams. In addition, if such radioresistant tumor regions could be identified before the start of therapy, strategies intended to overcome such radioresistance could be employed [Citation28]. A relevant strategy is biological image-guided dose escalation. Here, PET images of the tumor may be used to guide focal dose escalation to radio resistant regions within the tumor. However, further investigations are necessary to achieve complete understanding of factors affecting the FDG uptake in different tumors and to enable development of individualized treatment regimes [Citation28].
In conclusion, we have shown that the dynamic respiratory gated PET protocol is feasible and well tolerated by the patients. The derived image series may prove valuable in radiotherapy, but clinical trials are needed to assess the value of the protocol.
Acknowledgements
We would like to thank the personnel at the Nuclear Medicine Department, the Norwegian Radium Hospital for providing their assistance and participating in carrying out the PET/CT examinations that were a part of this study.
Declaration of interest: The authors report no conflicts of interest. The authors alone are responsible for the content and writing of the paper.
References
- Pao W, Girard N. New driver mutations in non-small-cell lung cancer. Lancet Oncol 2011;12:175–80.
- Nathional Cancer Institute: Non-small cell lung cancer treatment. [cited 2011 Apr 13]. Available from: http://www.cancer.gov/cancertopics/pdq/treatment/non-small-cell-lung/healthprofessional.
- Baum RP, Swietaszczyk C, Prasad V. FDG-PET/CT in l ung cancer: An update. Front Radiat Ther Oncol 2010; 42:15–45.
- Boellaard R, O'Doherty MJ, Weber WA, Mottaghy FM, Lonsdale MN, Stroobants SG, . FDG PET and PET/CT: EANM procedure guidelines for tumour PET imaging: version 1.0. Eur J Nucl Med Mol Imaging 2010;37:181–200.
- Castell F, Cook GJ. Quantitative techniques in 18FDG PET scanning in oncology. Br J Cancer 2008;98:1597–601.
- Fuss M. Strategies of assessing and quantifying radiation treatment metabolic tumor response using F18 FDG P ositron Emission Tomography (PET). Acta Oncol 2010;49: 948–55.
- Harry VN, Semple SI, Parkin DE, Gilbert FJ. Use of new imaging techniques to predict tumour response to therapy. Lancet Oncol 2010;11:92–102.
- Nehmeh SA, Erdi YE. Respiratory motion in positron emission tomography/computed tomography: A review. Semin Nucl Med 2008;38:167–76.
- Gamez C, Rosell R, Fernandez A, Andia E, Arnaiz MD, Cardenal F, . PET/CT fusion scan in lung cancer: Current recommendations and innovations. J Thorac Oncol 2006;1:74–7.
- Chang G, Chang T, Pan T, Clark JW, Jr, Mawlawi OR. Implementation of an automated respiratory amplitude gating technique for PET/CT: Clinical evaluation. J Nucl Med 2010;51:16–24.
- Buther F, Ernst I, Dawood M, Kraxner P, Schafers M, Schober O, . Detection of respiratory tumour motion using intrinsic list mode-driven gating in positron emission tomography. Eur J Nucl Med Mol Imaging 2010;37:2315–27.
- Kawano T, Ohtake E, Inoue T. Deep-inspiration breath-hold PET/CT of lung cancer: Maximum standardized uptake value analysis of 108 patients. J Nucl Med 2008;49:1223–31.
- Werner MK, Parker JA, Kolodny GM, English JR, Palmer MR. Respiratory gating enhances imaging of pulmonary nodules and measurement of tracer uptake in FDG PET/CT. AJR Am J Roentgenol 2009;193:1640–5.
- van Elmpt W, Hamill J, Jones J, De Ruysscher D, Lambin P, Ollers M. Optimal gating compared to 3D and 4D PET reconstruction for characterization of lung tumours. Eur J Nucl Med Mol Imaging. Epub 2011 Jan 11.
- Roe K, Aleksandersen TB, Kristian A, Nilsen LB, Seierstad T, Qu H, . Preclinical dynamic 18F-FDG PET-tumor characterization and radiotherapy response assessment by kinetic compartment analysis. Acta Oncol 2010; 49:914–21.
- Skretting A. Efficient breath hold data acquistion in PET. 2011 (in prep.).
- Nehmeh SA, Erdi YE, Ling CC, Rosenzweig KE, Schoder H, Larson SM, . Effect of respiratory gating on quantifying PET images of lung cancer. J Nucl Med 2002;43: 876–81.
- Nehmeh SA, Erdi YE, Ling CC, Rosenzweig KE, Squire OD, Braban LE, . Effect of respiratory gating on reducing lung motion artifacts in PET imaging of lung cancer. Med Phys 2002;29:366–71.
- Nehmeh SA, Erdi YE, Meirelles GS, Squire O, Larson SM, Humm JL, . Deep-inspiration breath-hold PET/CT of the thorax. J Nucl Med 2007;48:22–6.
- Nehmeh SA, Erdi YE, Pan T, Pevsner A, Rosenzweig KE, Yorke E, . Four-dimensional (4D) PET/CT imaging of the thorax. Med Phys 2004;31:3179–86.
- Kawano T, Ohtake E, Inoue T. Deep-inspiration breath-hold PET/CT versus free breathing PET/CT and respiratory gating PET for reference: Evaluation in 95 patients with lung cancer. Ann Nucl Med 2011;25:109–16.
- Biehl KJ, Kong FM, Dehdashti F, Jin JY, Mutic S, El Naqa I, . 18F-FDG PET definition of gross tumor volume for radiotherapy of non-small cell lung cancer: Is a single standardized uptake value threshold approach appropriate? J Nucl Med 2006;47:1808–12.
- Wanet M, Lee JA, Weynand B, De Bast M, Poncelet A, Lacroix V, . Gradient-based delineation of the primary GTV on FDG-PET in non-small cell lung cancer: A comparison with threshold-based approaches, CT and surgical specimens. Radiother Oncol 2011;98: 117–25.
- Miles KA, Griffiths MR. Perfusion CT: A worthwhile enhancement? Br J Radiol 2003;76:220–31.
- Abramyuk A, Wolf G, Shakirin G, Haberland U, Tokalov S, Koch A, . Preliminary assessment of dynamic contrast-enhanced CT implementation in pretreatment FDG-PET/CT for outcome prediction in head and neck tumors. Acta Radiol 2010;51:793–9.
- Lo SS, Fakiris AJ, Chang EL, Mayr NA, Wang JZ, Papiez L, . Stereotactic body radiation therapy: A novel treatment modality. Nat Rev Clin Oncol 2010;7: 44–54.
- Baumann P, Nyman J, Hoyer M, Wennberg B, Gagliardi G, Lax I, . Outcome in a prospective phase II trial of medically inoperable stage I non-small-cell lung cancer patients treated with stereotactic body radiotherapy. J Clin Oncol 2009;27:3290–6.
- Sovik A, Malinen E, Olsen DR. Strategies for biologic image-guided dose escalation: A review. Int J Radiat Oncol Biol Phys 2009;73:650–8.