Abstract
Background. Since the impact of fractionation in SBRT has not been systematically investigated, this modelling study was performed to see how the therapeutic window is affected for a range of fractions at target doses commonly administered in SBRT. Material and methods. Isoeffective tumour-doses (constant cell survival) were calculated with the linear quadratic (LQ) and the universal survival curve (USC) models for 2–20 fractions. The isoeffective tumour-regimes (with α/β = 10 Gy) were used to calculate the sparing of normal tissues (with α/β = 3 Gy) for an increasing number of fractions. Sparing was calculated as an increase in cell survival and decrease in normal tissue complication probability (NTCP) as compared to a common scheme with 3 fractions of 22 Gy to the centre of the target [(15 Gy to the periphery of the planning target volume (PTV)]. Results. At a high dose per fraction, above about 15 Gy, the USC model predicted much lower fractionation sensitivity than the LQ model. This holds true for both tumour and normal tissues. The USC model also predicted greater sparing of normal tissues outside the PTV as compared to the LQ model. Especially at dose levels of the order of 30–50% to that in the centre of the target. The decrease in NTCP predicted by the USC model was of the order of 30% for 10 fractions as compared to the NTCP for 3 fractions. With the LQ model the corresponding decrease was of the order of 10%. Conclusion. The USC model generally predicts a larger therapeutic window than the LQ model for an increasing number of fractions than today's practice in SBRT.
Based on the experience from intracranial stereotactic radiation therapy pioneered by the neurosurgeon Lars Leksell and the physicist Börje Larsson, a stereotactic method for extracranial stereotactic radiotherapy in the body (SBRT) was developed at Karolinska University Hospital and introduced into clinical practice in 1991 [Citation1,Citation2]. Empirically based, about 3 fractions with an inhomogeneous dose distribution within the planning target volume (PTV) with typical central doses of the order of 20 Gy (often 22 Gy at Karolinska) have been the usual schemes. This proved to correspond with a high biological dose to the tumour with acceptable side effects for tumours in the lungs and in the liver [Citation3,Citation4]. Generally 3 to 5 fractions, with a range from 1 to 10 have been used in SBRT. However, no systematic investigation has been done of the impact on the therapeutic window by fractionation in SBRT. Therefore, to optimise the treatment and possibly broaden the indications for SBRT, we addressed this issue.
Today, the linear quadratic model (LQ) is well accepted for calculating biologically equivalent fractionation schemes at conventional doses per fraction. However, the validity of the LQ model has been questioned when large doses per fraction are used as in SBRT [Citation5,Citation6]. A hybridised model, the universal survival curve (USC), combining the LQ model in the low dose range and the single hit multitarget model (SHMT) in the high dose range was proposed by Park et al. [Citation5] for hypofractionation in SBRT. At high doses the SHMT model predicts a linear relation between the logarithm of the cell survival and dose, as opposed to a continuously bending curve with the LQ model.
In clinical use, the different models (LQ and USC) are intended to describe biologically equivalent fractionation schemes. The biological effect is often local control for tumours and clinically relevant toxicity for normal tissues. At conventional fractionation the effect is mainly thought to be mediated by direct death of parenchymal cells. However, for hypofractionation as in SBRT, vascular effects are thought to be of importance especially in tumours. It has been hypothesised that the mechanism is a combination of direct parenchymal- and at high doses endothelial cell death leading to parenchymal cell death [Citation6]. Another factor of importance for the biological effect on the tumour is hypoxia and reoxygenation for different fractionation schemes [Citation7]. The relative importance of these effects as explanations for the clinical results seen after SBRT is unclear.
In the present modelling study, it is assumed that isoeffective fractionation schemes may be determined with cell survival models of relevant target cells, be it parenchymal or endothelial. Isoeffective tumour doses (constant cell survival) are calculated with the LQ and USC models for a range of regimes of 2–20 fractions at target doses common in SBRT. From the isoeffective tumour doses, cell survival in normal tissues as well as normal tissue complication probability (NTCP), were calculated to seek improvement of the therapeutic window by increasing the number of fractions.
Material and methods
The LQ model describes clonogenic survival, SLQ after ![]() fractions with a dose of d Gy per fraction by:
fractions with a dose of d Gy per fraction by:
For the SHMT model, the survival SSHMT after ![]() fractions with a dose of d Gy per fraction is given by:
fractions with a dose of d Gy per fraction is given by:
where D0 and ![]() describe the slope and the extrapolation number, respectively, of the linear part in a plot of the logarithm of survival versus dose. At high doses the SHMT model asymptotically approaches the line:
describe the slope and the extrapolation number, respectively, of the linear part in a plot of the logarithm of survival versus dose. At high doses the SHMT model asymptotically approaches the line:
The USC model uses the LQ model up to the transition dose dT, which is determined from D0, ![]() and α [Citation5,Citation8]. For a higher dose, SHMT (Equation 3) is used to calculate cell survival.
and α [Citation5,Citation8]. For a higher dose, SHMT (Equation 3) is used to calculate cell survival.
Parameter values used in this study for the two models are given in . In the USC model, those published by Park et al. for NSCLC [Citation5] were used for tumour. For normal tissue, those published by Wennberg et al., [Citation8] for radiation pneumonitis grade 2 or more (RP2+) were used.
Table I. Parameter values used in the USC model.
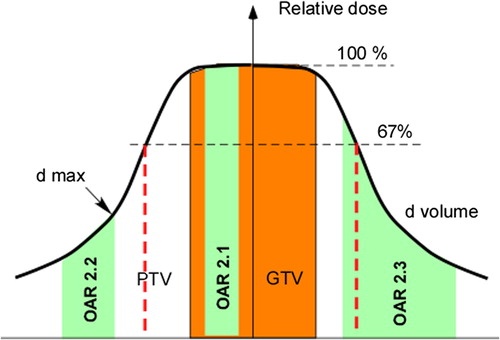
In , an inhomogeneous dose distribution typically used in SBRT is diagrammed. The dose, normalised to the centre of the gross tumour volume (GTV), and the surrounding dose of typically about 67% to the periphery of the PTV are depicted. Three organs at risk (OARs) are illustrated to depict the three representative clinical situations described in the sections below and evaluated in this study.
Figure 1. Typical inhomogeneous dose distribution within the PTV as used in SBRT. Numbers in the OARs refer to the different cases described in the three sections of the Material and methods.
Calculated isoeffect curves for tumour and normal tissue
In the first scenario both tumour (GTV) and normal tissue (marked OAR 2.1 in ) received the same dose. This could, for example be the case with bronchi surrounded by tumour. With the USC and LQ models, isoeffective doses were calculated for a constant cell survival in both tumour (early responding) and normal tissue (late responding) at different doses per fraction.
The reference situation was chosen as the survival fraction in the tumour calculated with the USC model for 3 × 22 Gy. This yielded the same survival fraction as 3 × 17.2 Gy calculated with the LQ model. Total dose as a function of the dose per fraction (similar to the classical plot, of Thames et al. [Citation9]) as well as a function of number of fractions are presented for both tumour and normal tissues, in the comparison between the LQ and USC models.
A sensitivity analysis was done to see the effect on the resulting isoeffect curves for a range of parameter values for the USC model. The values of the parameters D0 and ![]() were chosen so as the transition dose dT were 4 Gy and 10 Gy besides the values given in . The analysis was done both for tumour and normal tissue.
were chosen so as the transition dose dT were 4 Gy and 10 Gy besides the values given in . The analysis was done both for tumour and normal tissue.
Calculated cell survival for normal tissue with serial structure at isoeffective tumour doses
In the second scenario the normal tissue (OAR 2.2 in ) received a fraction of the dose given to the GTV and the tissue's response was proportional to the maximal dose. The latter assumption is valid for so called serial organs, i.e. the response is modelled by inactivation of serially organised subunits. Cell survival in the point of maximum dose in an OAR was calculated with the USC and LQ models for a constant cell survival in the tumour for different numbers of fractions and doses per fraction. The same isoeffective tumour doses as calculated in the previous section were also used in this section.
Further, cell survival in the OAR was calculated at specific doses relative to the prescribed dose. These were 100% (22 Gy), 80% (17.6 Gy), 60% (13.2 Gy), 40% (8.8 Gy), and 30% (6.6 Gy). The lower levels are comparable to dose constraints for radiation-sensitive organs when treating with 3 fractions. In RTOG protocol 0618 [Citation10] the following maximal dose constraints were used: spinal cord 3 × 6 Gy, oesophagus 3 × 9 Gy, heart and trachea 3 × 10 Gy. Additionally, the calculated survival fractions in the normal tissue were used to calculate the potential “gain” in normal tissue-tolerance dose with increasing numbers of fractions. The latter is of interest in case it is difficult to fulfil the dose constraints during the dose planning process. The question is thus, what gain do the models predict with an increased fractionation? Alternatively is the gain of interest to predict if dose escalation is desirable.
Calculated probability of complications for normal tissue with parallel structure at isoeffective tumour doses
In the third scenario the normal tissue (OAR 2.3 in ) received a fraction of the dose given to the GTV but its response was proportional to the complete dose distribution, in this case close to the mean dose. This assumption is valid for so called parallel organs. However, instead of calculating cell survival in OAR as in the preceding section, NTCP in lung tissue was calculated for a constant cell survival in the tumour for three patients with lung tumours.
In our department, the most common fractionation in SBRT is three times 22 Gy (central dose to the GTV) and a dose/fraction to the periphery of the PTV of 15 Gy, but both higher and lower doses are in use. For this reason central doses/fraction of 29.3 Gy and 15 Gy, resulting in periphery doses of 20 Gy and 10 Gy, were also applied. In correspondence to the two previous sections, reference situations were chosen as the survival fractions in the tumour calculated with the USC model for 3 × 15 Gy, 3 × 22 Gy and 3 × 29.3 Gy.
Lung toxicity after SBRT has previously been modelled with the Lyman-Kutcher-Burman (LKB) NTCP model [Citation11,Citation12]. Using NTCP parameters from this modelling, we investigated how the NTCP changes with different tumour isoeffective fractionation regimes.
The LKB model parameters used, describing RP2+ in SBRT, were ![]() = 0.71, m = 0.40 and D50 = 30 Gy for the USC model and
= 0.71, m = 0.40 and D50 = 30 Gy for the USC model and ![]() = 0.87, m = 0.4 and D50 = 30 Gy for the LQ model [Citation8]. Each bin of the lung-DVH was corrected for fractionation with the LQ or the USC models in 0.5 Gy steps. The sensitivity to the value of
= 0.87, m = 0.4 and D50 = 30 Gy for the LQ model [Citation8]. Each bin of the lung-DVH was corrected for fractionation with the LQ or the USC models in 0.5 Gy steps. The sensitivity to the value of ![]() was also tested using
was also tested using ![]() = 0.87 for the USC model.
= 0.87 for the USC model.
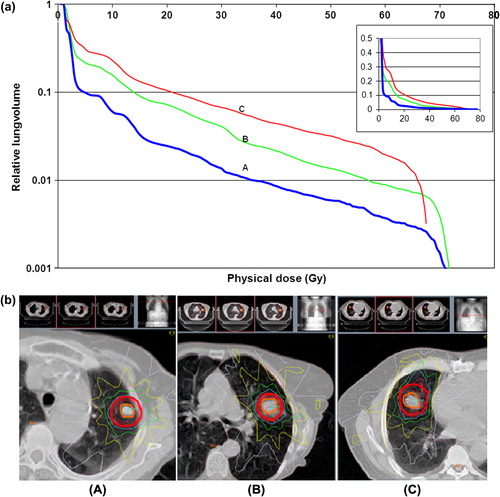
In order to have relevant lung DVH-data, those from three patients with a low (A), medium (B) and high (C) mean lung dose were used as depicted in a. The physical mean dose to the ipsilateral lung for an isocentredose of 22 Gy was for patient A, 2.6 Gy; for patient B, 5.1 Gy; and for patient C 7.1 Gy. The differences among these patients were tumour size and conformity to PTV because of proximity to the heart, as shown in b.
Figure 2. a. Dose volume histograms for ipsilateral lung-GTV with a low (A), medium (B), and high (C) mean lung dose. To better distinguish the lines at small relative lung volumes, they are shown in logarithmic scale, with an insert in linear scale. b. Dose distributions for three patients with a low (A), medium (B), and high (C) mean lung dose. Blue isodose is the prescription isodose (15 Gy at 65%) at the periphery of the PTV, green is 50%, yellow 32%, and grey 16%. Red isodoses are 80%, 87%, and 93% of 22 Gy. PTV and GTV are shown by red and orange lines.
The result is presented as NTCP versus number of fractions. Also, relative NTCP is presented with 3 fractions as the reference situation, i.e. NTCPn fractions/NTCP3 fractions. All calculations were made for isoeffective tumour doses.
Results
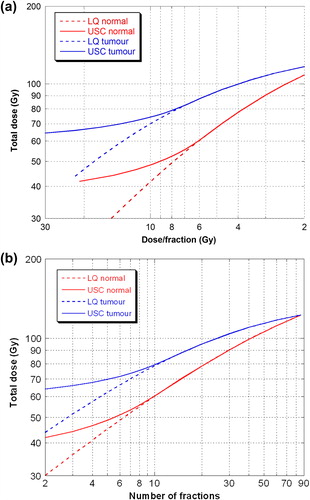
shows isoeffect curves (constant cell survival) calculated with both the LQ model and the USC model for tumour and normal tissues. a and b contain essentially the same results, but for convenience both are presented. a for comparison to the classical plot of Thames et al. in which the independent parameter was dose/fraction and b in consistency to the results presented in the following two sections with number of fractions as the independent parameter. The steepness of the curves differs considerably for the two models at a dose per fraction above dT (about 6 Gy). The USC model implies less fractionation sensitivity compared to the LQ model for both tumour and normal tissues at high fraction doses and few fractions with a relatively small dependence on dose per fraction at fraction-doses of 12–30 Gy where the isoeffective dose is primarily dependent on the total dose.
Figure 3. Isoeffect curves calculated for tumour and normal tissue using LQ (dotted lines) and USC (full lines) for fractionation correction. In figure a) with dose/fraction and in figure b) with number of fractions as independent variable.
The results of the sensitivity analysis of the calculated isoeffect curves for a range of parameter values in the USC model are presented in Supplementary Appendix.
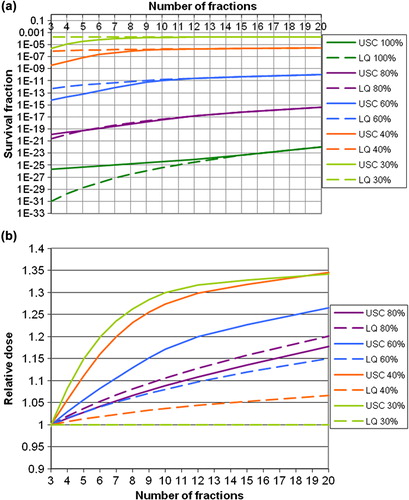
a shows the calculated cell survival in normal tissue keeping cell survival in the tumour constant for different numbers of fractions. From the figure one can see that the largest gain (increase in cell survival in OAR for a constant cell survival in the tumour) predicted by the USC model with increasing numbers of fractions is at the lowest relative dose levels (30%, 40%, and 60%). A sparing of normal tissues, outside the PTV, of two to three orders of magnitude in cell survival is predicted by the USC model when increasing the number of fractions from 3 up to about 10. This result corresponds to a possible increase in dose of about 20–30%, as shown in b. For more than 10 fractions, the sparing-effect levels off. For the LQ model, the result is opposite to that of the USC model, in the sense that the largest gain with increasing numbers of fractions was at the highest dose levels, i.e. when the OAR is located within the PTV.
Figure 4. a. Cell survival calculated for normal tissue, for constant cell survival in the tumour. The left panel gives the results in absolute numbers, and the right panel gives the cell survival relative to that at 3 fractions, at which the prescribed central dose is 22 Gy. The different lines give the result for different maximum doses to the OAR relative to the dose to GTV. The USC model is shown by full lines and the LQ model with dotted lines. b. Gain in tolerance dose to OAR, with numbers of fractions relative to that for 3 fractions. The different lines give the results for different maximal doses to the OAR relative to the prescribed central dose. The USC model is represented by full lines and LQ model with dotted lines.
shows NTCP calculated for the ipsilateral lung versus number of fractions for three different patients. Cell survival in the tumour was constant and calculated for three reference situations using 3 × 15 Gy, 3 × 22 Gy and 3 × 29.3 Gy at the isocentre. To the right, NTCP is given relative to that for 3 fractions. The NTCP, as calculated with the USC correction for fractionation, clearly decreases more rapidly up to about 10 fractions and then levels off. For the curves with LQ correction for fractionation, there is also a gain predicted with increasing number of fractions, however smaller than for the USC corrected curves.
Figure 5. NTCP versus number of fractions, for RP2+ for a constant cell survival in the tumour for three different prescribed central tumour doses (3 × 29.3 Gy, 3 × 22 Gy and 3 × 15 Gy). Three patients are used in the calculations: one with a low (PT A), one with a medium (PT B), and one with a high (PT C) mean lung dose. The USC model is shown by full lines and the LQ model by dotted lines. Note the different scales on y-axes for NTCP.
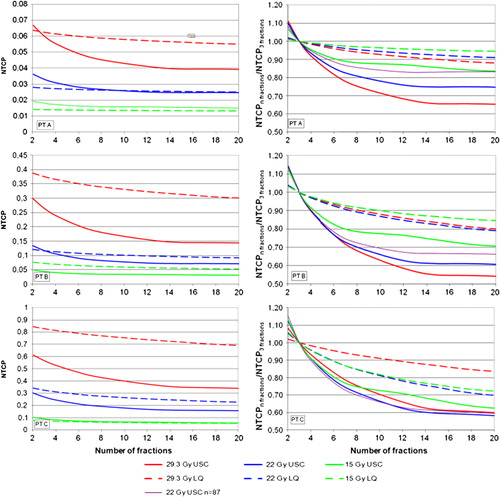
The calculated NTCP depends, as expected, on the isocentre dose. The gain in NTCP with more than 3 fractions is generally largest for the scheme with 3 × 29.3 Gy as reference. Also the relative dose distribution for the specific patient has an impact on the gain in NTCP with fractionation. It is however difficult to make general conclusions about this from the three patients in this study.
The sensitivity of the calculated NTCP with parameter n, that describe the volume dependence in the NTCP model, was evaluated by changing from ![]() = 0.71 to
= 0.71 to ![]() = 0.87 on all three patients using a central dose of 22 Gy as reference and USC corrected DVH data. As presented in the right panel of , the influence was greatest on patient A, who received the lowest lung dose (a). For patient C, there was hardly any difference. From this test, we conclude that a change in
= 0.87 on all three patients using a central dose of 22 Gy as reference and USC corrected DVH data. As presented in the right panel of , the influence was greatest on patient A, who received the lowest lung dose (a). For patient C, there was hardly any difference. From this test, we conclude that a change in ![]() from 0.71 to 0.87 has a relatively low impact on NTCP (, right panel).
from 0.71 to 0.87 has a relatively low impact on NTCP (, right panel).
Discussion
In the classical plot by Thames et al., late-responding tissues were shown to have higher fractionation sensitivity than early-responding tissues, findings that were later modelled with the LQ model. This is illustrated in a. In the comparison of the LQ vs. USC models, identical fractionation sensitivities at doses per fraction below dT (about 6 Gy) was given by the fact that USC is identical to LQ below dT. However, at high doses per fraction, above about 15 Gy, the USC model predicted much lower fractionation sensitivity, compared to the LQ model, for both tumour and normal tissues. This report is the first to compare these two models in such detail and to predict that of the order of 8 to 10 fractions (cf and ) could be advantageous choices of fractionation for patients in which OAR get a dose of the order of 30–50% of the central dose to the target.
Generally, toxicity in the lungs after SBRT of pulmonary tumours is reported to be low [Citation8]. This is probably a reason why the importance of fractionation on the therapeutic window is rarely investigated; that is, the early experience in SBRT of about 2 to 5 fractions has been successful, with high tumour control and few side effects [Citation2].
The same holds true for SBRT of tumours in the liver [Citation4] and kidneys [Citation13]. However, for large tumours in the lungs, liver or kidneys, greater volumes of the normal parenchyma become irradiated. For such situations, fractionation increased above that in current practice is important to explore. Also for SBRT of central lung tumours or other situations with radiation sensitive organs close to the target, fractionation aspects are important.
To optimise the treatment, the differential effect on tumour and normal tissues (therapeutic window) have to be maximised. Thus, the impact of the effect on the tumour with increased fractionation is important. Here, improved reoxygenation of potentially hypoxic tumours has been an argument for an increasing number of fractions [Citation7]. However, there are also arguments for a possible reduced effect by a decrease in microvascular response to radiation at lower doses per fraction [Citation6]. For the microvascular response there might be a threshold dose/fraction at 8–10 Gy and a maximal response at 20–25 Gy [Citation14].
In the current modelling study, we used commonly accepted α/β ratios in the LQ model. For the USC model, no commonly accepted parameter values exist. Here the values by Park et al. [Citation5] describing the in vitro response of NSCLC cells were used as representing tumours in general and parameter values by Wennberg et al. [Citation8] describing the response of lung tissue (radiation pneumonitis grade 2 or more) were used to represent late responding normal tissue in general. The validity of these values depends on the background data, which today are sparse. However, the resulting isoeffect curves were not very sensitive to the parameter values used in terms of this study's conclusions, according to the sensitivity analysis done. The conclusions are instead primarily dependent on the fact that the cell survival curve (logarithm of cell survival) continuously bends in the LQ model, but is linear at doses above the transition dose dT in the USC model. Thus the important question that remains is the value of dT. If the transition dose dT is of the order of 10 Gy or more, the decrease in fractionation sensitivity at high doses is of minor importance. If, however, the transition dose is of the order of 6 Gy or less, the decrease in fractionation sensitivity at high doses is important to consider.
In order to determine if the LQ or the USC model is more accurate for modelling of fractionation effects in SBRT, clinical data with a range of fractionations (1 to more than 10) and doses needs to be investigated both for tumour response and toxicity. Data from in vitro irradiation of NSCLC-cells indicates that LQ is an inferior model at high doses/fraction [Citation5]. From the irradiation of murine tumours in vivo, the same conclusion emerged [Citation15]. From those data, a best-fit β/α ratio of about 70 Gy can be calculated and yields an almost linear relationship between the logarithm of cell survival and dose. Some information is also available from risk-adapted fractionated stereotactic radiotherapy, in which the total dose was kept constant with fractionation schemes of 3 × 20 Gy, 5 × 12 Gy, and 8 × 7.5 Gy [Citation16]. It was reported that treatment was well tolerated and provided similar local control for all three schemes. This outcome is more consistent with the results with the USC model of this study, indicating low fractionation sensitivity at high doses/fraction compared to the prediction with the LQ model. Similarly, Astrahan [Citation17] modelled data for lung toxicity with the linear-quadratic-linear model and predicted decreasing fractionation sensitivity at very high dose/fraction. From an ongoing randomised RTOG-trial 0915 [Citation18], in which 4 × 12 Gy is compared to 1 × 34 Gy, further conclusions may be drawn. In the Nordic countries, a phase II trial on centrally located tumours given 8 × 7 Gy is under way and may add information on this issue.
In this modelling study it was shown that at doses of about 15 Gy or higher, well above the dose dT, the USC model predicted much lower fractionation sensitivity, compared to the LQ model, for both tumour and normal tissues.
For schedules with isoeffective tumour doses the cell survival in normal tissues outside the tumour will increase and the NTCP will decrease with more than 3 fractions, as predicted by the LQ and USC models. In general, a clearly larger gain was predicted with the USC model. Specifically, the USC model forecasted the largest gain compared to the LQ model in volumes of the OAR receiving less than full dose. Confirmation of the importance of fractionation in SBRT will accrue as more clinical data become available. Potentially, the current results will broaden the indications for SBRT.
Appendix
Download PDF (1.2 MB)Declaration of interest: The authors report no conflicts of interest. The authors alone are responsible for the content and writing of the paper.
This study was supported by grants from the Swedish Cancer Society.
References
- Lax I, Blomgren H, Näslund I, Svanström R. Stereotactic radiotherapy of malignancies in the abdomen. Methodological aspects. Acta Oncol 1994;33:677–83.
- Blomgren H, Lax I, Näslund I, Svanström R. Stereotactic high dose fraction radiation therapy of extracranial tumors using an accelerator. Clinical experience of the first thirty-one patients. Acta Oncol 1995;34:861–70.
- Baumann P, Nyman J, Hoyer M, Wennberg B, Gagliardi G, Lax I, et al. Outcome in a prospective phase II trial of medically inoperable stage I non-small-cell lung cancer patients treated with stereotactic body radiotherapy. J Clin Oncol 2009; 27:3290–6.
- Tse RV, Hawkins M, Lockwood G, Kim JJ, Cummings B, Knox J, et al. Phase I study of individualized stereotactic body radiotherapy for hepatocellular carcinoma and intrahepatic cholangiocarcinoma. J Clin Oncol 2008;26:657–64.
- Park C, Papiez L, Zhang S, Story M, Timmerman RD. Universal survival curve and single fraction equivalent dose: Useful tools in understanding potency of ablative radiotherapy. Int J Radiat Oncol Biol Phys 2008;70:847–52.
- Park HJ, Griffin RJ, Hui S, Levitt SH, Song CW. Radiation-induced vascular damage in tumours: Implications of vascular damage in ablative hypofractionated radiotherapy (SBRT and SRS). Radiat Res 2012;177:311–27.
- Carlson DJ, Keall PJ, Loo BW, Chen ZJ, Brown JM. Hypofractionation results in reduced cell kill compared to conventional fractionation for tumours with regions of hypoxia. Int J Radiat Oncol Biol Phys 2011;79:1188–95.
- Wennberg BM, Baumann P, Gagliardi G, Nyman J, Drugge N, Hoyer M, et al. NTCP modelling of lung toxicity after SBRT comparing the universal survival curve and the linear quadratic model for fractionation correction. Acta Oncol 2011;50:518–27.
- Thames HD, Withers HR, Peters LJ, Fletcher GH. Changes in early and late radiation responses with altered dose fractionation: Implications for dose-survival relationships. Int J Radiat Oncol Biol Phys 1982;8:219–26.
- RTOG 0618 A phase II trial of stereotactic body radiation therapy (SBRT) in the treatment of patients with operable stage I/II non-small cell lung cancer. Available from: http://www.rtog.org/ClinicalTrials/ProtocolTable/StudyDetails.aspx?study = 0618 [cited August 2012].
- Kutcher GJ, Burman C. Calculation of complication probability factors for non-uniform normal tissue irradiation: The effective volume method. Int J Radiat Oncol Biol Phys 1989;16:1623–30.
- Lyman JT. Complication probability as assessed from dose-volume histograms. Radiat Res Suppl 1985;8:13–9.
- Svedman C, Sandström P, Pisa P, Blomgren H, Lax I, Kälkner KM, et al. A prospective Phase II trial of using extracranial stereotactic radiotherapy in primary and metastatic renal cell carcinoma. Acta Oncol 2006;45:870–5.
- Fuks Z, Kolesnick R. Engaging the vascular component of the tumor response. Cancer Cell 2005;8:89–91.
- Otsuka S, Shibamoto Y, Iwata H, Murata R, Sugie C, Ito M, et al. Compatibility of the linear-quadratic formalism and biologically effective dose concept to high-dose-pre-fraction irradiation in a murine tumor. Int J Radiat Oncol Biol Phys 2011;81:1538–43.
- Haasbeek CJ, Lagerwaard FJ, Slotman BJ, Senen S. Outcomes of stereotactic ablative radiotherapy for centrally located early-stage lung cancer. J Thorac Oncol 2011;6:2036–43.
- Astrahan M. Some implications of linear-quadratic-linear radiation dose-response with regard to hypofractionation. Med Phys 2008;35:4161–72.
- RTOG 0915 (NCCTG N0927). A randomized phase II study comparing 2 stereotactic body radiation therapy (SBRT) schedules for medically inoperable patients with stage I peripheral non-small cell lung cancer. Available from: http://www.rtog.org/ClinicalTrials/ProtocolTable/StudyDetails.aspx?study = 0915 [cited August 2012].