Abstract
Background. For patients treated with stereotactic ablative radiotherapy (SABR) for early-stage non-small cell lung cancer, benign computed tomography (CT) changes due to radiation-induced lung injury (RILI) can be difficult to differentiate from recurrence. We measured the utility of CT image feature analysis in differentiating RILI from recurrence, compared to Response Evaluation Criteria In Solid Tumours (RECIST). Materials and methods. Twenty-two patients with 24 lesions treated with SABR were selected (11 with recurrence, 13 with substantial RILI). On each follow-up CT, consolidative changes and ground glass opacities (GGO) were contoured. For each lesion, contoured regions were analysed for mean and variation in Hounsfield units (HU), 3D volume, and RECIST size during follow-up. Results. One hundred and thirty-six CT scans were reviewed, with a median imaging follow-up of 26 months. The 3D volume and RECIST measures of consolidative changes could significantly distinguish recurrence from RILI, but not until 15 months post-SABR; mean volume at 15 months [all values ± 95% confidence interval (CI)] of 30.1 ± 19.3 cm3 vs. 5.1 ± 3.6 cm3 (p = 0.030) and mean RECIST size at 15 months of 4.34 ± 1.13 cm vs. 2.63 ± 0.84 cm (p = 0.028) respectively for recurrence vs. RILI. At nine months post-SABR, patients with recurrence had significantly higher-density consolidative changes (mean at nine months of −96.4 ± 32.7 HU vs. −143.2 ± 28.4 HU for RILI; p = 0.046). They also had increased variability of HU, an image texture metric, measured as the standard deviation (SD) of HU, in the GGO areas (SD at nine months of 210.6 ± 14.5 HU vs. 175.1 ± 18.7 HU for RILI; p = 0.0078). Conclusions. Quantitative changes in mean HU and GGO textural analysis have the potential to distinguish RILI from recurrence as early as nine months post-SABR, compared to 15 months with RECIST and 3D volume. If validated, this approach could allow for earlier detection and salvage of recurrence, and result in fewer unnecessary investigations of benign RILI.
Stereotactic ablative radiotherapy (SABR), also known as stereotactic body radiotherapy (SBRT), employs image guidance and precise treatment delivery to deliver a high dose of radiation to tumours while sparing surrounding normal tissue [Citation1]. Treatments are typically delivered with high doses per fraction, over 3–8 fractions [Citation2]. SABR is becoming a standard treatment option for stage I non-small cell lung cancer (NSCLC) patients who are medically inoperable or refuse surgery [Citation2,Citation3]. Following lung radiotherapy, radiation-induced lung injury (RILI) can occur in the acute phase (within six months) as radiation pneumonitis and in the late phase (after six months) as fibrosis [Citation4]. With SABR, the incidence of acute- and late-onset RILI is high: 54–79% of patients develop acute benign computed tomography (CT) changes, and 80–100% of patients develop late changes [Citation5].
With older radiotherapy techniques, benign CT changes typically follow the edges of the treatment fields, consisting of straight borders and allowing for easier diagnosis of RILI [Citation4]. Due to the high doses delivered and steep dose gradients with SABR, as well as the 3D conformity of the treated region to the morphology of the target, benign CT changes are common and can mimic tumour recurrence, especially when they develop as mass-like patterns [Citation5,Citation6]. Therefore, distinguishing between benign fibrosis and recurrence becomes of major importance in identifying patients who are candidates for salvage treatment [Citation7]. Misclassification of injury as recurrence can cause patients to undergo unnecessary investigations and interventions for no oncologic benefit. Conversely, misclassification of recurrence as injury can result in a missed opportunity for salvage [Citation6].
18F-fluorodeoxyglucose positron emission tomography (FDG-PET) imaging has been investigated to detect recurrence, but has several limitations: hypermetabolic activity has been observed in benign SABR-treated lesions [Citation8], optimal SUV cut-offs have not been defined, and repeated PET scanning of all SABR patients would be costly. A biopsy can be considered for a definite diagnosis of recurrence; however, high risks of complications such as pneumonthorax (˜20%) and haemoptysis (5–10%) prevent it from being a first line tool for differentiating fibrosis from recurrence [Citation9]. As a result, better methods are needed to aid in distinguishing RILI from recurrence. A reliable measure of recurrence on CT imaging would be a valuable clinical tool, as the utilisation of SABR for early stage lung cancer is increasing [Citation10], and CT scanning is the standard measure of imaging follow-up for SABR patients [Citation11].
The goal of this study is to measure the utility of CT image feature analysis in differentiating RILI from recurrence, when compared to Response Evaluation Criteria in Solid Tumours (RECIST) measurements, which is the standard method used for response assessment in trials of oncology [Citation12]. Specifically, this study compares the imaging characteristics of CT density, texture and 3D volume of contoured regions of interest: consolidative regions (increased density with no visibility of vessels) and ground glass opacity (GGO: an increase in normal lung parenchyma density but with visibility of vessels). Analysis was completed on planning and follow-up CT images, to determine which measures may provide the earliest differentiation of local recurrence from injury.
Methods and materials
Patient selection and treatment
A total of 22 patients with 24 tumours treated with SABR for Stage I NSCLC at the VU University Medical Center between February 2004 and February 2010 were selected for this study. Patients without recurrence were selected from a previous study [Citation13] based on presence of CT findings of moderate/severe fibrosis that were ultimately found to be benign. Of the 24 lesions, 13 developed only benign RILI, and 11 developed recurrence. Of the latter, pathological evidence of recurrence was available in eight of 11 lesions; the other three were deemed to be recurrences based on sequential imaging findings and multidisciplinary group consensus, as biopsy was not feasible. One patient had two treated lesions in close proximity; these were considered as a single lesion for analysis as the post-SABR CT changes spanned the location of both lesions.
All patients were treated with SABR using a risk-adapted fractionation scheme as previously described [Citation13–15]. Briefly, patients were treated with one of three fractionation regimens: 60 Gy in 3 fractions for T1 tumours surrounded by lung parenchyma; 60 Gy in 5 fractions for T2 tumours or those in broad contact with the chest wall; and 60 Gy in 8 fractions for tumours within 2 cm of the mediastinum or close to the brachial plexus. For 3D-conformal treatments, done using 9–11 fixed beams, planning was completed using BrainLab software (Brainscan version 5.2; BrainLab Inc., Feldkirchen, Germany) and a pencil beam dose calculation algorithm. For those patients treated with volumetric modulated arc therapy (VMAT) using RapidArc (Varian Medical Systems, Palo Alto, USA), the anisotropic analytical algorithm (AAA) was used for dose calculations. With the latter, the prescribed doses for the 3- and 5- fraction regimens were 54 Gy and 55 Gy, respectively, due to differences in dose calculation with the more advanced algorithm. Follow-up was routinely conducted with a diagnostic CT scan approximately three, six, and 12 months post-treatment and every 6–12 months thereafter.
Table I. Baseline patient and treatment variables.
Contours
All pre-treatment and follow-up scans were manually contoured on every axial slice using a lung window setting (window width of 1500 HU and window level of −600 HU). For tumours or fibrosis abutting the mediastinum, a mediastinal window setting (window width of 350 HU and window level of 40 HU) was also used. All contours were completed using ITK-SNAP [Citation16] (Version 2.2.0). Two regions were contoured in the follow-up scans based on the patterns of post-SABR CT changes which have been well described [Citation13,Citation15,Citation17]. The first, containing consolidative changes around the treatment site, was defined as a region of increased density with no visibility of vessels. The second, containing GGO, was defined as an increase in normal lung parenchyma density but with visibility of vessels [Citation18]. shows an example of the contours created for a single subject throughout the course of follow-up post-SABR. All contours were completed by a single investigator (SAM) and subsequently edited and approved by a thoracic radiation oncologist (DAP). Further details pertaining to image acquisition and analysis are outlined in Supplementary Appendix 1, available online at http//informahealthcare.com/doi/abs/10.3109/0284186X.2012.731525.
Figure 1. Manual contours throughout a course of follow-up for a patient whose cancer recurred. The solid lines represent consolidative changes, and the dashed lines represent ground glass opacity (GGO).
Inter- and intra-observer variability has been reported in contouring of lung tumours [Citation19]. To simulate the effect of contouring variability, we implemented computer software to expand and contract the contour borders by 1 mm in the axial plane, and determined the effect of the expansion and contraction on the mean differences measured between patients with RILI and recurrence. At the earliest significant time point for both the consolidative and GGO regions, we expanded and contracted the borders by 1 mm and recalculated our results.
Data analysis
Four measures were calculated for the contoured regions: 1) mean 3D volume; 2) mean CT density; 3) standard deviation of CT density; and 4) mean RECIST measurements. RECIST measurements were taken for only the solid consolidative areas according to RECIST 1.1. MATLAB 7.13 (The MathWorks Inc., Natick, MA, USA) was used in the calculation of the 3D volume and CT densities of the contoured regions. The standard deviation (SD) of CT density was used as a basic texture metric, where larger standard deviations correspond to more variegated image textures within the contoured regions. shows an example of this image texture measure for three sample image regions containing increasingly variegated texture, with the corresponding standard deviations shown in HU.
Figure 2. The standard deviation (SD) of CT density was used as a basic texture measure. Three examples from ground glass opacity of patients in this study, showing the differences in texture with the varying SDs: a) 50.1 HU, b) 85.8 HU, c) 123.4 HU.
For each lesion, the measures were analysed cumulatively throughout the course of follow-up up to a specified time point. This resulted in a mean RECIST size, mean 3D volume, mean CT density, and standard deviation of CT density for each lesion over each specified follow-up time interval. The time points we used for analysis were every three months up to two years, then yearly thereafter. These time points were more frequent than the regular follow-up scan intervals as there is occasionally some variability in CT scan timing due to individual patient scheduling and potentially due to clinical indications. The end date of treatment was considered day 0 of follow-up. Differences between groups were assessed using an independent samples t-test with unequal variances in MATLAB 7.13 (The MathWorks Inc., Natick, MA, USA). All statistical tests were two-sided with p≤ 0.05 indicative of statistical significance.
Results
A total of 136 CT scans were reviewed with a median imaging follow-up of 26 months (range 6–44 months). The mean number of scans per patient was 6 (range 2–8); patients with recurrence had a mean of four follow-up scans, and patients without recurrence had a mean of six follow-up scans. Baseline patient and treatment variables are shown in . We observed that over 50% of tumours were found in the upper lobe, which is consistent with epidemiologic studies of lung cancer [Citation20]. Three patients developed clinical grade 3 pneumonitis, and no grade 4 or 5 thoracic clinical toxicity was observed in this patient cohort. All patients without recurrence had a minimum follow-up of two years.
Pre-treatment lesions
shows the baseline pre-treatment imaging characteristics for patients with recurrence and RILI. No significant differences were observed at baseline in mean CT density, volume, or RECIST size, comparing lesions of patients whom would later develop recurrence vs. those with RILI. Since GGO was not contoured on the pre-treatment scan, the standard deviation of CT density was not included in the aforementioned table.
Table II. Baseline pre-treatment imaging characteristics.
Post-SABR measures of size
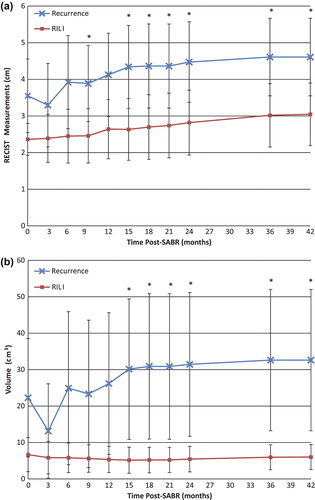
A significant difference in RECIST measurements was detected between patients with recurrence vs. those with RILI as early as 15 months post-treatment (p = 0.028). Patients with recurrence had a mean cumulative RECIST [± 95% CI] of the consolidative changes at 15 months of 4.34 ± 1.13 cm vs. 2.63 ± 0.84 cm for patients with benign RILI.
Patients with recurrence had significantly larger solid consolidative changes as measured with 3D volume, detected as early as 15 months post-treatment compared to patients with RILI [mean at 15 months (± 95% CI) of 30.1 ± 19.3 cm3 vs. 5.1 ± 3.6 cm3, respectively; p = 0.030]. No significant difference was observed in the 3D volumes of the GGO regions. shows the significant measures of size (both RECIST and 3D volume measurements) of the consolidative regions for patients with recurrence and RILI, during the course of follow-up post-SABR.
Figure 3. Cumulative size measures of the consolidative regions throughout follow-up post-SABR; all values are the mean ± 95% CI. a) RECIST and b) 3D volume. *Indicates statistical significance at p ≤ 0.05.
Post-SABR appearance measures
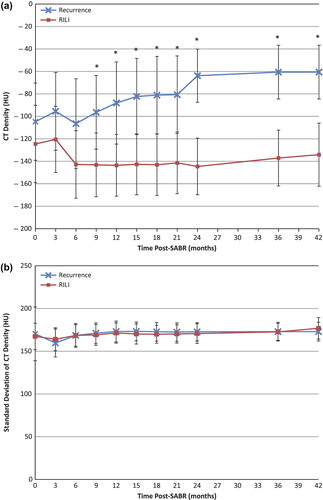
Patients with recurrence had significantly denser mean [± 95% CI] solid consolidative changes of −96.4 ± 32.7 HU vs. −143.2 ± 28.4 HU for patients with RILI, and this was detected as early as nine months post-treatment (p = 0.046). No significant difference was observed in the CT density of the GGO at any point in follow-up.
Significantly increased variability of CT densities in the GGO areas was detected at nine months post-treatment (p = 0.0078). Patients with recurrence had a standard deviation of CT density at nine months (± 95% CI) of 210.6 ± 14.5 HU vs. 175.1 ± 18.7 HU for patients with RILI. This is indicative of larger variability in the HU of the GGO, or more variegated texture, in patients with recurrence. No significant difference was observed in the variation of CT densities within the consolidative regions. and show the cumulative appearance measures (CT density and standard deviation of CT density), in the GGO and consolidative regions respectively, during post-SABR follow-up for patients with recurrence and RILI.
Figure 4. Cumulative appearance measures of the ground glass opacity regions throughout follow-up post-SABR; a) Mean (± 95% CI) CT density, and b) standard deviation (± 95% CI) of CT density. *Indicates statistical significance at p ≤ 0.05.
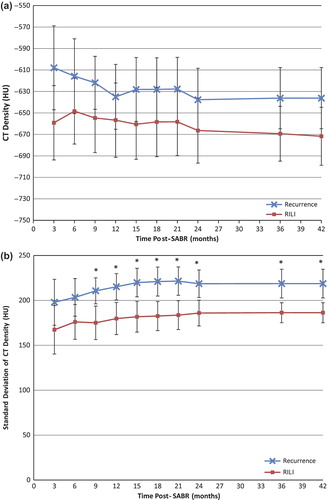
Figure 5. Cumulative appearance measures of the consolidative regions throughout follow-up post-SABR; a) Mean (± 95% CI) CT density, and b) standard deviation (± 95% CI) of CT density. Indicates statistical significance at p ≤ 0.05.
Contouring variability
In the consolidative regions at nine months, we expanded and contracted the borders by 1 mm and recalculated our results. In all cases, including the original results, the differences between the two groups remained between 36 and 59 HU, with the patients with recurrence having higher HU density than patients with only RILI: [1 mm expansion: RILI = −220.02 ± 35.70 HU, recurrence = −161.67 ± 36.26 HU; 1 mm contraction: RILI = −95.43 ± 28.48 HU, recurrence = −59.58 ± 33.06 HU].
Similarly, for the GGO texture measure at nine months, patients with recurrence had a higher standard deviation of CT density compared to those with RILI, and the difference between the two groups remained between 35 and 39 HU: [1 mm expansion: RILI = 194.77 ± 14.99 HU, recurrence = 229.97 ± 10.85 HU; 1 mm contraction: RILI = 167.86 ± 21.71 HU, recurrence = 206.60 ± 17.16 HU].
Discussion
CT density changes are common after SABR and distinguishing recurrence from RILI is becoming increasingly important. As SABR utilisation increases, ambiguous CT findings will become a more common clinical problem. A technique for early and accurate diagnosis of post-SABR recurrence could allow for early salvage of recurrence, and avoid unnecessary imaging and intervention in patients with RILI only. This study suggests that changes in the cumulative mean density of consolidative regions and textural analysis have the potential to distinguish RILI from cancer recurrence as early as nine months post-SABR, compared to 3D volume and RECIST at 15 months. For RECIST of the consolidation and texture analysis of the GGO, we acknowledge the possibility that they may be inferior predictors as there does not appear to be an increase in separation between the groups over time. To our knowledge, this is the largest series of recurrences analysed for post-SABR radiological changes in the literature.
We observed a significant difference in mean HU for the consolidative regions, but not in the GGO regions, and conversely we observed a significant difference in the standard deviation of HU in the GGO regions, but not in the consolidative regions. A more detailed investigation is required in order to more fully understand the reasons behind this observation. Since the consolidative regions are relatively opaque and homogeneous in appearance on CT imaging, the standard deviation of HU in these regions may be a less sensitive measure of difference between the groups, and the significant difference in mean HU could potentially be due to changes in tissue composition of the recurrent tumour (such as microvasculature and soft tissue) compared to fibrotic tissue within RILI.
The GGO regions contained a relatively greater amount of variation in the CT densities as some areas have lower density lung tissue, and others have higher density vessels; this may have rendered the standard deviation of the HU measure a relatively more sensitive measure of difference between the groups in the GGO regions. We surmise that RILI results in a more uniform GGO density within these regions, whereas recurrences seemed to have a more variegated appearance, potentially representing tumour nodularity or increased vascularity in areas of tumour recurrence. Further work is required to gain an understanding of the exact reasons behind the association of our significant measures with the consolidation or GGO regions for patients with recurrence and RILI.
The findings of this study are consistent with previously published literature but extend these previous findings in several important ways. Previous studies have shown that an enlarging opaque region after 12 months is indicative of recurrence [Citation21,Citation22], consistent with the RECIST findings reported herein. We hypothesise that the decrease in RECIST and volume of the consolidative regions for the recurrence groups at three months is indicative of a partial response to treatment, and following this time point the rise we see may possibly be a sign of progressive disease. However, an enlarging mass may not be specific for recurrence: based on biopsy and further imaging, only a few patients with enlarging masses are deemed to ultimately have recurrence [Citation6]. Most previous studies of radiological features of post-SABR recurrence are limited due to small sample size (of ≤ 5 recurrences) and mainly focused on the type and qualitative appearance of these changes [Citation6,Citation21,Citation22]. Our study extends these findings by quantifying changes in density, texture, and 3D volume for patients, and suggests that these measurements may allow for the earlier detection of recurrence.
A systematic review by Huang et al. identified several predictive factors of recurrence [Citation5]. Since the primary imaging modality for follow-up post-SABR is CT, RECIST is traditionally used to determine a patient's response to treatment. An enlarging mass with 20% increase in size, or an absolute increase in size of at least 5 mm from baseline, as described by RECIST 1.1, is suspicious for recurrence and warrants FDG-PET for further investigation. Other high-risk features on CT include an enlarging mass-like lesion, opacity enlargement after 12 months, bulging margin, disappearance of air bronchograms, linear margin disappearance, ipsilateral pleural effusion, or lymph node enlargement [Citation5]. In terms of metabolic findings of recurrence, a SUVmax ≥ 5 using FDG-PET is highly suspicious of recurrence. In these cases, it is suggested a biopsy and/or resection should occur if feasible. Validation of the findings presented herein may improve this algorithm for imaging follow-up after SABR.
The conclusions of this study must be considered in the context of its strengths and limitations. Although the number of recurrent lesions analysed is more than in previous studies, and the length of follow-up is long, the sample size remains small, which may limit the power to detect small differences between groups. The patients included are not completely reflective of the overall SABR population, in that both the proportion of patients with recurrence, and the severity of benign RILI are higher than in a general SABR population. This sample was selected in order to determine if image feature analysis could differentiate recurrence from difficult RILI cases, but these findings require validation in a large, separate dataset. Inter- and intra-observer variability can exist in contouring of lung tumours [Citation19], and further research is required to refine these metrics so they are invariant to individual contouring practices. As a result, it appears that even in the presence of contouring variability, the differences between the RILI and recurrence group appear consistent. Furthermore, data analysis was completed through cumulative analysis of measures up to a time point (0–3, 0–6, 0–9 months etc.), rather than using smaller time ranges (0–3, 3–6, 6–9 months etc.). Future studies will evaluate the relative benefits of using a cumulative analysis vs. using smaller time ranges. Furthermore, lung density can vary with regional blood flow, respiration, as well as co-morbid illnesses such as COPD [Citation23,Citation24], and these factors were not considered in this study. Further work must be completed on the effect of any co-morbidities on the measures analysed in this study.
In conclusion, our study suggests that the use of CT density of consolidative changes as well as basic textural analysis of GGO may allow for early differentiation between RILI and recurrence. With further validation of our results on a larger sample size, and more detailed analysis of the features and changes observed throughout the course of SABR follow-up, there is the potential for an earlier detection of recurrence compared with traditional measures. This could potentially allow for earlier salvage of patients with recurrence, and result in fewer investigations for patients exhibiting only benign RILI.
Supplementary Appendix 1
Download PDF (646 KB)Declaration of interest: The authors report no conflicts of interest. The authors alone are responsible for the content and writing of the paper.
Dr. Palma is a recipient of research funding from the Ontario Institute for Cancer Research. Dr. Ward is a recipient of research funding from Cancer Care Ontario. This work was funded by the Lawson Health Research Institute Internal Research Fund. The VU University Medical Center has a research agreement with Varian Medical Systems, Inc.
References
- Uematsu M, Shioda A, Tahara K, Fukui T, Yamamoto F, Tsumatori G, et al. Focal, high dose, and fractionated modified stereotactic radiation therapy for lung carcinoma patients: A preliminary experience. Cancer 1998;82:1062–70.
- Lagerwaard FJ, Haasbeek CJ, Smit EF, Slotman BJ, Senan S. Outcomes of risk-adapted fractionated stereotactic radiotherapy for stage I non-small-cell lung cancer. Int J Radiat Oncol Biol Phys 2008;70:685–92.
- Lagerwaard FJ, Verstegen NE, Haasbeek CJ, Slotman BJ, Paul MA, Smit EF, et al. Outcomes of stereotactic ablative radiotherapy in patients with potentially operable stage I non-small cell lung cancer. Int J Radiat Oncol Biol Phys 2012;83:348–53.
- Park KJ, Chung JY, Chun MS, Suh JH. Radiation-induced lung disease and the impact of radiation methods on imaging features. Radiographics 2000;20:83–98.
- Huang K, Dahele M, Senan S, Guckenberger M, Rodrigues GB, Ward A, et al. Radiographic changes after lung stereotactic ablative radiotherapy (SABR) – Can we distinguish recurrence from fibrosis?A systematic review of the literature. Radiother Oncol 2012;102:335–42.
- Takeda A, Kunieda E, Takeda T, Tanaka M, Sanuki N, Fujii H, et al. Possible misinterpretation of demarcated solid patterns of radiation fibrosis on CT scans as tumor recurrence in patients receiving hypofractionated stereotactic radiotherapy for lung cancer. Int J Radiat Oncol Biol Phys 2008;70:1057–65.
- Neri S, Takahashi Y, Terashi T, Hamakawa H, Tomii K, Katakami N, et al. Surgical treatment of local recurrence after stereotactic body radiotherapy for primary and metastatic lung cancers. J Thorac Oncol 2010;5:2003–7.
- Hoopes DJ, Tann M, Fletcher JW, Forquer JA, Lin PF, Lo SS, et al. FDG-PET and stereotactic body radiotherapy (SBRT) for stage I non-small-cell lung cancer. Lung Cancer 2007;56:229–34.
- Laurent F, Montaudon M, Latrabe V, Begueret H. Percutaneous biopsy in lung cancer. Eur J Radiol 2003;45: 60–8.
- Palma D, Visser O, Lagerwaard FJ, Belderbos J, Slotman BJ, Senan S. Impact of introducing stereotactic lung radiotherapy for elderly patients with stage I non-small-cell lung cancer: A population-based time-trend analysis. J Clin Oncol 2010;28:5153–9.
- Partridge M, Yamamoto T, Grau C, Hoyer M, Muren LP. Imaging of normal lung, liver and parotid gland function for radiotherapy. Acta Oncol 2010;49:997–1011.
- Eisenhauer EA, Therasse P, Bogaerts J, Schwartz LH, Sargent D, Ford R, et al. New response evaluation criteria in solid tumours: Revised RECIST guideline (version 1.1). Eur J Cancer 2009;45:228–47.
- Dahele M, Palma D, Lagerwaard F, Slotman B, Senan S. Radiological changes after stereotactic radiotherapy for stage I lung cancer. J Thorac Oncol 2011;6:1221–8.
- Palma DA, van Sornsen de Koste J, Verbakel WF, Vincent A, Senan S. Lung density changes after stereotactic radiotherapy: A quantitative analysis in 50 patients. Int J Radiat Oncol Biol Phys 2011;81:974–8.
- Palma DA, Senan S, Haasbeek CJ, Verbakel WF, Vincent A, Lagerwaard F. Radiological and clinical pneumonitis after stereotactic lung radiotherapy: A matched analysis of three-dimensional conformal and volumetric-modulated arc therapy techniques. Int J Radiat Oncol Biol Phys 2011;80: 506–13.
- Yushkevich PA, Piven J, Hazlett HC, Smith RG, Ho S, Gee JC, et al. User-guided 3D active contour segmentation of anatomical structures: Significantly improved efficiency and reliability. Neuroimage 2006;31:1116–28.
- Takeda T, Takeda A, Kunieda E, Ishizaka A, Takemasa K, Shimada K, et al. Radiation injury after hypofractionated stereotactic radiotherapy for peripheral small lung tumors: Serial changes on CT. AJR Am J Roentgenol 2004;182: 1123–8.
- Hansell DM, Bankier AA, MacMahon H, McLoud TC, Muller NL, Remy J. Fleischner Society: Glossary of terms for thoracic imaging. Radiology 2008;246:697–722.
- Louie AV, Rodrigues G, Olsthoorn J, Palma D, Yu E, Yaremko B, et al. Inter-observer and intra-observer reliability for lung cancer target volume delineation in the 4D-CT era. Radiother Oncol 2010;95:166–71.
- Byers TE, Vena JE, Rzepka TF. Predilection of lung cancer for the upper lobes: An epidemiologic inquiry. J Natl Cancer Inst 1984;72:1271–5.
- Kato S, Nambu A, Onishi H, Saito A, Kuriyama K, Komiyama T, et al. Computed tomography appearances of local recurrence after stereotactic body radiation therapy for stage I non-small-cell lung carcinoma. Jpn J Radiol 2010;28: 259–65.
- Matsuo Y, Nagata Y, Mizowaki T, Takayama K, Sakamoto T, Sakamoto M, et al. Evaluation of mass-like consolidation after stereotactic body radiation therapy for lung tumors. Int J Clin Oncol 2007;12:356–62.
- Lamers RJ, Kemerink GJ, Drent M, van Engelshoven JM. Reproducibility of spirometrically controlled CT lung densitometry in a clinical setting. Eur Respir J 1998;11: 942–5.
- Palma DA, van Sornsen de Koste JR, Verbakel WF, Senan S. A new approach to quantifying lung damage after stereotactic body radiation therapy. Acta Oncol 2011;50: 509–17.