Abstract
Background. Large international differences in colorectal cancer survival exist, even between countries with similar healthcare. We investigate the extent to which stage at diagnosis explains these differences. Methods. Data from population-based cancer registries in Australia, Canada, Denmark, Norway, Sweden and the UK were analysed for 313 852 patients diagnosed with colon or rectal cancer during 2000–2007. We compared the distributions of stage at diagnosis. We estimated both stage-specific net survival and the excess hazard of death up to three years after diagnosis, using flexible parametric models on the log-cumulative excess hazard scale. Results. International differences in colon and rectal cancer stage distributions were wide: Denmark showed a distribution skewed towards later-stage disease, while Australia, Norway and the UK showed high proportions of ‘regional’ disease. One-year colon cancer survival was 67% in the UK and ranged between 71% (Denmark) and 80% (Australia and Sweden) elsewhere. For rectal cancer, one-year survival was also low in the UK (75%), compared to 79% in Denmark and 82–84% elsewhere. International survival differences were also evident for each stage of disease, with the UK showing consistently lowest survival at one and three years. Conclusion. Differences in stage at diagnosis partly explain international differences in colorectal cancer survival, with a more adverse stage distribution contributing to comparatively low survival in Denmark. Differences in stage distribution could arise because of differences in diagnostic delay and awareness of symptoms, or in the thoroughness of staging procedures. Nevertheless, survival differences also exist for each stage of disease, suggesting unequal access to optimal treatment, particularly in the UK.
Colorectal cancer is the third most common cancer and cause of cancer death worldwide [Citation1,Citation2]. There are large differences in survival globally [Citation3], between European countries [Citation4,Citation5] and between Europe and the US [Citation6]. The International Cancer Benchmarking Partnership (ICBP) is a consortium of epidemiologists, clinicians and policy-makers seeking to explain colorectal cancer survival differences between six high-income countries with similar health systems. Predicted five-year survival was 12% higher in Australia than in the UK for patients diagnosed during 2005–2007; survival was low in Denmark, intermediate in Norway, and high in Canada and Sweden [Citation7]. Understanding the reasons behind these differences should help improve cancer control strategies [Citation8]. We have reported the impact of stage at diagnosis, a crucial prognostic factor, on ovarian cancer survival [Citation9]. Here, we consider whether stage at diagnosis could explain the international differences in overall colorectal survival in 2000–2007, by comparing the distribution of stage at diagnosis in each country. Survival may also differ for each stage of disease: this would suggest differences in treatment, the quality of staging procedures, or levels of co-morbidity.
We used population-based data from regional (Australia, Canada, Sweden, UK) and national (Denmark, Norway) cancer registries. In contrast to clinical trials, which routinely exclude older, more frail or marginalised patients, these data include all cancer patients in each region or country, thus enabling public health comparisons of the overall effectiveness of health systems. Stage at diagnosis is not routinely or consistently recorded by all cancer registries. Population-based studies of stage-specific survival have usually adopted a ‘high-resolution’ approach, in which investigators abstract detailed clinical data on stage directly from the medical records of large, random samples of patients derived from the cancer registry [Citation6,Citation10,Citation11]. Here, we used data on stage held by the registries for all cancer patients in their territory. The data on stage were coded to a variety of classification systems. We therefore defined a repeatable process to consolidate these data into a common classification, in order to facilitate robust international comparisons of stage-specific survival [Citation12]. We compared the distributions of stage at diagnosis in the six countries and overall and stage-specific survival at one and three years after diagnosis. Using routine data on stage at diagnosis in international cancer survival comparisons should enable future cancer survival surveillance worldwide.
Material and methods
Data
The International Cancer Benchmarking Partnership (ICBP) collected data on 788 311 patients diagnosed with colorectal cancer during 1995–2007 in Australia (Victoria; New South Wales), Canada (Alberta, British Columbia, Manitoba, Ontario), Denmark, Norway, Sweden (Uppsala-Örebro and Stockholm-Gotland health regions), and the UK (England, Northern Ireland, Wales). Overall, these registries covered 80.5% of the combined population of these six countries: details have been published [Citation7].
Data were cleaned and analysed centrally to a common protocol. We collected data on primary, invasive, malignant cancers of the colon (ICD-10 C18.0-C18.9), rectosigmoid junction (C19) and rectum (C20), but not cancers of the anus or anal canal (C21). We excluded patients whose tumour was benign (behaviour code 0), of uncertain behaviour (1) or in situ (2). Patients were excluded if their vital status was unknown or if their cancer was only registered from a death certificate. Full details of quality control have been published [Citation7].
We restricted attention to the 468 258 patients diagnosed during 2000–2007, when stage data were more complete. We excluded registries that had recorded stage data for less than 50% of patients in this period: thus Victoria (Australia), British Columbia and Ontario (Canada) and Wales (UK) were excluded from the analyses for colon cancer, while Victoria (Australia), Ontario (Canada), Thames (England, UK) and Wales (UK) were excluded from the analyses for rectal cancer. For Canada and Denmark, the availability of stage data increased markedly from 2004, following changes in policy, so we further excluded patients diagnosed during 2000–2003 in those two countries. The final analyses included 208 281 colon cancer patients and 105 571 patients with rectal cancer.
The ICBP study protocol required both pathological and clinical T, N and M values, and/or Dukes’ stage where available. We defined a standard procedure [Citation12] to determine which stage variables to use where the registry supplied more than one, prioritising individual T, N and M data over Dukes’ stage, and preferring pathological T and N over clinically-based values. The New South Wales registry uses a locally-specified coding system wherein tumours are classified as ‘localised, regional, distant’. Norway also uses its own coding system for colon cancer. Both systems could be translated to the US Surveillance, Epidemiology and End Results program's Summary Stage 2000 (SEER SS2000); this is similar to the New South Wales system, but better documented and more widely known. By additionally mapping both TNM and Dukes’ systems to SEER SS2000, we were able to include all countries in comparative analyses. The analyses we present using SEER SS2000 therefore include all six countries; but where possible, we also present the results using the Dukes’ system, which is more familiar to clinicians.
We present survival estimates for colon and rectal cancers separately, because they differ in stage distribution, treatment options and clinical behaviour. We consider three age groups: 15–49, 50–69 and 70–99 years at diagnosis. For simplicity, we will use stages A–D when referring to Dukes’ stage, and ‘localised’, ‘regional’ or ‘distant’ when referring to SEER SS2000.
Statistical analyses
A major difficulty in international comparisons of cancer survival is that data on the cause of death may be incomplete, and death certification may not record cancer as the underlying cause of death with comparable accuracy between countries or over time [Citation13]. Relative survival techniques have been used for many years to estimate net survival, which is the probability of survival for cancer patients in the hypothetical situation where cancer is the only cause of death. These techniques have recently been shown to incorporate bias in longer-term survival estimation due to ‘informative censoring’ [Citation14]. To estimate net survival by stage at diagnosis, age and country whilst avoiding this bias, we used flexible parametric excess hazard models on the log-cumulative excess hazard scale, implemented with the stpm2 command [Citation15] in Stata version 12.0 (StataCorp LP, College Station, Texas, USA). The expected risk of death (background mortality) by sex and single year of age at death was estimated from life tables specific to the population of each registry's territory and each calendar year [Citation7]. Net survival for a given group of patients is then the mean of the individual net survival probabilities predicted by the model at a given point in time since diagnosis. We also estimated the mortality counterpart of net survival, the excess hazard of death, which is the instantaneous risk of dying from cancer, over and above the expected risk of dying from all other causes, for up to three years after diagnosis.
Stage-specific analyses were conducted with stage categorised either to Dukes’ or SEER SS2000. Patients with no data on stage were initially treated as a distinct category. Age was modelled as a continuous variable. We used polynomial functions (splines) to allow for the non-linear effects of time since diagnosis and the potentially non-linear effects of age on the excess hazard. We fitted interactions with time since diagnosis to allow for potentially non-proportional effects of age and country. The final models were selected using various measures of goodness of fit, including the Akaike Information Criterion (AIC) and the Schwarz Bayesian Information Criterion (BIC) [Citation16]. We used a likelihood ratio test to test for the interaction between age and country, allowing a 20% probability of type I error. Final models were compared with slightly more flexible models to reveal any excessive constraints, such as proportional effects or lack of flexibility, but the survival estimates were not changed by this increased flexibility. We examined plots of the Martingale residuals to ensure correct specification of the functional form used to model the effect of age. In order to assess the validity of our final models, we also modelled the data from each country separately, and obtained very similar results; therefore, we present only the results from the final models that include country. The availability of follow-up data beyond the last boundary for which we want to estimate survival is important for the stability of the model, so we present survival estimates up to three years, even though we had longer follow-up for some patients [Citation17].
To determine the probable stage for patients with missing data we performed multiple imputation by chained equations, using the ice command [Citation18] in Stata 12. For each country in turn, we specified an ordered logistic regression model including vital status, the non-linear effect of the log-cumulative excess hazard, and the non-linear effect of age, as well as all covariables that significantly predicted stage for patients in that country with known stage, or that predicted the absence of stage (potentially: sub-site, sex, year of diagnosis and any interactions between these covariables and the excess hazard) [Citation19,Citation20]. We ran the imputation procedure 15 times on each data set and combined the results under Rubin's rules [Citation21].
We used the same modelling strategy to estimate stage-specific net survival in each of the 15 imputed datasets and compared the range of estimates to the survival estimates obtained for patients for whom stage had been reported in the original data.
For each category of stage, all-ages survival estimates were standardised with weights derived from the distribution of patients in the age categories 15–44, 45–54, 55–64, 65–74, 75–84 and 85–99 years in all jurisdictions combined (Supplementary Tables I and II to be found online at http://informahealthcare.com/doi/abs/10.3109/0284186X.2013.764008).
Table I. Number and mean age at diagnosis of colon and rectal cancer patients diagnosed during 2000–2007: country and stage at diagnosis (Dukes’ stage and SEER Summary Stage 2000).
Differences between paired survival estimates, and overall ranges, are given as the simple arithmetic value, e.g. 12% would be 2% (and not 20%) higher than 10%. Survival estimates are rounded to integer values in the text, but differences and ranges are based on the exact underlying values. The statistical significance of differences in survival was assessed at the 5% level on the basis of the excess hazard ratios derived from the models; we present 95% confidence intervals for most estimates.
Results
Stage and age distributions
The proportion of patients for whom data on stage at diagnosis were missing was highest in the UK (colon: 27.8%; rectum: 30.6%) and lowest in Sweden for colon cancer (3.4%) and Norway for rectal cancer (7.1%) (). The proportion increased with age (Supplementary Figure 1 to be found online at http://informahealthcare.com/doi/abs/10.3109/0284186X.2013.764008). For colon cancer, the mean age at diagnosis was slightly higher in Norway and Sweden (72.6 years) than in Canada or Australia (70.5 years), while for rectal cancer the range was from 67.7 years (Australia) to 70.6 years (Sweden) ().
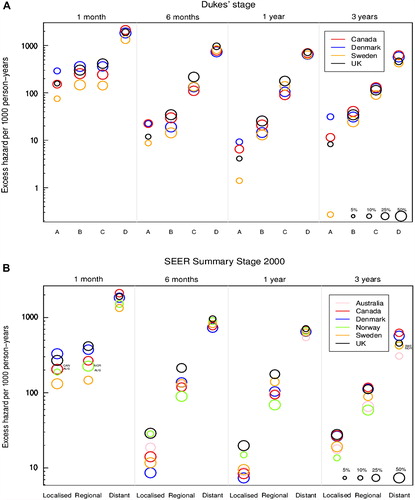
Figure 1. Age-standardised excess hazard of death (per 1000 person-years, log scale) from colon cancer, by stage, country and time since diagnosis: Dukes’ stage (A: upper graphic) and SEER Summary Stage 2000 (B: lower graphic). 1. National data are used for Denmark and Norway. Other countries are represented by regional registries: Australia: New South Wales; Canada: Alberta and Manitoba; Sweden: Uppsala-Örebro and Stockholm-Gotland health regions; UK: England and Northern Ireland. In Canada and Denmark we analysed data for patients diagnosed in 2004–2007. 2. For each country, the size of the ‘bubble’ represents the proportion of cancers in each stage at diagnosis (see legend at bottom right of graphic). The relative size of the bubbles is therefore the same at each time since diagnosis.
Imputation of stage where it was missing did not substantially alter the stage distributions, either for colon or rectal cancer.
Colon cancer was more commonly diagnosed at an early stage (A) in Canada, at intermediate stages (B and C) in Sweden and the UK, and at an advanced stage (D) in Denmark (). The proportion with advanced disease was low in the UK (20% vs. 24–31% elsewhere), but the proportion in stage C was high (36% vs. 26–29% elsewhere). The distribution of stage in SEER SS2000 varied more widely: the proportion of patients with ‘regional’ disease was 54% in Norway and 46% in Australia, but 30–37% elsewhere. In Denmark, 31% of patients had ‘distant’ disease, compared with 19–27% in the other five countries.
The stage distributions for rectal cancer were similar in Canada, Norway and Sweden, for both Dukes’ and SEER SS2000 categorisations. The distribution was more heavily skewed towards later stage in Denmark than in other countries, again with both classifications. The proportion of patients diagnosed in stage D was lower in the UK (19%) and Australia (17%) than elsewhere (23–29%), and the proportion in stage C was much higher (35%), whereas these proportions were more similar in other countries. The proportion of patients with ‘regional’ tumours ranged from 40–42% in Australia and Denmark to 30–36% elsewhere.
Net survival
Overall, one-year age-standardised net survival from colon cancer was lowest in the UK (67.4%), followed by Denmark (71.3%) (). Survival was intermediate in Norway (75.5%) and Canada (76.2%) and highest in Sweden (79.9%) and Australia (80.2%). Similarly, survival from rectal cancer was lowest in the UK (75.2%) and Denmark (79.0%), intermediate in Norway (82.3%) and highest in Canada (84.0%), Sweden (84.4%) and Australia (83.6%) (). For both colon and rectal cancers, the same patterns of survival by country were found three years after diagnosis (Supplementary Tables III and IV to be found online at http://informahealthcare.com/doi/abs/10.3109/0284186X.2013.764008).
Table II. All-ages, age-specific and age-standardised one-year net survival (%) by stage at diagnosis and country for colon cancer patients diagnosed during 2000–2007.
Table III. All-ages, age-specific and age-standardised one-year net survival (%) by stage at diagnosis and country for rectal cancer patients diagnosed during 2000–2007.
One-year net survival from both colon and rectal cancer was statistically significantly lower for each age group in the UK than in all other countries (except compared to the youngest age group in Denmark), and the differences were widest for patients aged 70–99 years (5–15%, and ). For both cancers, the largest between-country difference in one-year net survival was twice as wide for 70–99 year olds as it was for 15–49 year olds.
International differences in age-standardised net survival at one year were wider for patients with more advanced stage of disease at diagnosis. Thus in the UK, survival for colon cancer patients with stage A disease was similar to that in other countries, but up to 5% lower than elsewhere for stage B, while the deficits with respect to Denmark, Canada and Sweden for more advanced stages of disease were large and statistically significant (7–11% for stage C and 5–8% for stage D) (). The Dukes’ stage-specific age-standardised one-year net survival estimates were also low in Denmark, but the differences with other countries were not generally statistically significant. A similar pattern of wider international differences for patients with more advanced disease was also observed with SEER SS2000 stage () and three years after diagnosis in both stage classifications (Supplementary Table III to be found online at http://informahealthcare.com/doi/abs/10.3109/0284186X.2013.764008).
For rectal cancer, international differences in net survival at one and three years were also wider for patients with more advanced stage at diagnosis (; Supplementary Table IV to be found online at http://informahealthcare.com/doi/abs/10.3109/0284186X.2013.764008). Age-standardised one-year net survival for ‘localised’ disease was up to 5% lower in the UK than elsewhere, but 7–14% lower for patients with ‘distant’ disease ().
Among patients for whom SEER SS2000 stage data were not available, the international range in one-year net survival was as wide as 30% for colon cancer and 21% for rectal cancer, with the lowest values in the UK and the highest in Australia ( and ). The international range in survival was also wide among patients for whom Dukes’ stage was not available. For colon cancer, survival for patients missing SEER SS2000 in Canada was low, as was survival among rectal cancer patients with missing stage in Sweden.
Excess hazard
The excess hazard of death at one month after diagnosis was approximately 10 times higher for patients with advanced disease than those with early-stage disease ( and ). There was a noticeable decrease in the excess hazard of death between one and six months after diagnosis, particularly for patients diagnosed at an early stage. As a result, the difference in the excess hazard of death between early and advanced disease widened to almost 100-fold by three years after diagnosis. This pattern was observed for both colon and rectal cancer, and in each country.
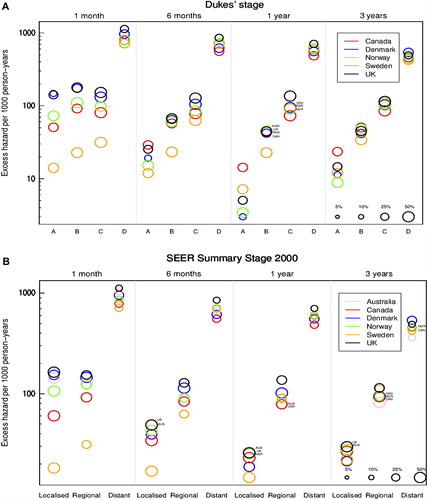
Figure 2. Age-standardised excess hazard of death (per 1000 person-years, log scale) from rectal cancer, by stage, country and time since diagnosis: Dukes’ stage (A: upper graphic) and SEER Summary Stage 2000 (B: lower graphic) 1. National data are used for Denmark and Norway. Other countries are represented by regional registries: Australia: New South Wales; Canada: Alberta, British Columbia and Manitoba; Sweden: Uppsala-Örebro and Stockholm-Gotland health regions; UK: Northern Ireland and all cancer registries in England except the Thames Cancer Registry. In Canada and Denmark we analysed data for patients diagnosed in 2004–2007. 2. For each country, the size of the ‘bubble’ represents the proportion of cancers in each stage at diagnosis (see legend at bottom right of graphic). The relative size of the bubbles is therefore the same at each time since diagnosis.
For each stage at diagnosis, international differences in the excess hazard of death diminished with time since diagnosis. An exception was seen for patients with stage A colon cancer, where the excess hazard in Sweden declined continuously with time, resulting in a particularly low excess hazard three years after diagnosis.
For colon cancer, the excess hazard of death was relatively stable from six months to three years after diagnosis, in each country and within each stage category.
For rectal cancer, the excess hazard of death at one month was similar for stage B and C () in all countries except Sweden. From six months onwards, the excess hazard of death was higher for patients in each successive category of stage at diagnosis.
Net survival following imputation
After imputation of stage where it was missing from the original record, net survival estimates were generally similar to, or lower than, the estimates for patients with known stage, for both colon and rectal cancer. The only exception was survival for patients with stage D in Norway. However, the international range in stage-specific survival became wider ( and ). Imputation had an especially large effect on one-year net survival in the UK, where the estimates were reduced by as much as 15.5% for stage C colon cancer and 9.6% for stage C rectal cancer. Similar findings were observed at three years (Supplementary Figures 2 and 3 to be found online at http://informahealthcare.com/doi/abs/10.3109/0284186X.2013.764008).
Figure 3. Colon cancer: age-standardised one-year net survival for patients diagnosed 2000–2007, by stage at diagnosis and country, Dukes’ stage (A: upper graphic) and SEER Summary Stage 2000 (B: lower graphic). X – survival estimate derived from those patients for whom the stage was recorded at diagnosis. I – range of survival estimates for all patients, both those with known stage and those for whom it was imputed, derived from 15 data sets after imputation (see text for details). 1. National data are used for Denmark and Norway. Other countries are represented by regional registries: Australia: New South Wales; Canada: Alberta and Manitoba; Sweden: Uppsala-Örebro and Stockholm-Gotland health regions; UK: England and Northern Ireland. In Canada and Denmark, data are for patients diagnosed in 2004–2007.
Figure 4. Rectal cancer: age-standardised one-year net survival for patients diagnosed 2000–2007, by stage at diagnosis and country, Dukes’ stage (A: upper graphic) and SEER Summary Stage 2000 (B: lower graphic). X – survival estimate derived from those patients for whom the stage was recorded at diagnosis. I – range of survival estimates for all patients, both those with known stage and those for whom it was imputed, derived from 15 data sets after imputation (see text for details) 1. National data are used for Denmark and Norway. Other countries are represented by regional registries: Australia: New South Wales; Canada: Alberta, British Columbia and Manitoba; Sweden: Uppsala-Örebro and Stockholm-Gotland health regions; UK: Northern Ireland and all cancer registries in England except the Thames Cancer Registry. In Canada and Denmark, data are for patients diagnosed in 2004–2007.
Discussion
Cancer survival varied widely between these six countries. For colon cancer, age-standardised one-year net survival was highest in Australia and Sweden, intermediate in Canada and Norway, lower in Denmark and lowest in the UK, with a range of 13%. For rectal cancer, survival was lowest in the UK, intermediate in Denmark and Norway, and highest in Australia, Canada and Sweden, with a range of 9%. These international differences in survival are partly explained by differences in the distribution of stage at diagnosis. For each stage at diagnosis, however, international variation in survival was also wide, particularly for patients with more advanced disease.
Before considering the implications of these findings, we describe how we have addressed three aspects of data quality: the lack of comparability between the various classifications of stage at diagnosis, differences in clinical staging procedures, and incompleteness of data on stage.
Data on stage were provided in four different classifications. We developed an algorithm to translate these to a common standard before survival analysis [Citation12]. For a few categories of stage, a small degree of misclassification was unavoidable. For example, in mapping Dukes’ stage to SEER Summary Stage 2000, it is unavoidable that about 2–3% of colorectal patients are misclassified as ‘localised’ rather than ‘regional’, because it is not possible to distinguish between T3 and T4 among tumours assigned to Dukes’ B if the component T, N and M codes are not available. This may partly explain why Australia and Norway have higher proportions of patients with ‘regional’ tumours. Incomplete documentation on the categories of stage used for colon cancer in Norway may have increased this type of misclassification and contributed to the unusual stage distribution.
The thoroughness of clinical investigation to determine the stage at diagnosis may also differ between countries. This can affect the observed distribution of stage, and both stage-specific and overall survival. For example, it is possible that sub-optimal staging in the UK (leading to misclassification of some Dukes’ stage D tumours as stage C) explains both the particularly low proportion of metastatic tumours (Dukes’ D), and the unusually high proportion of Dukes’ C. This may be why patients in both stage categories had substantially lower survival than elsewhere (stage migration [Citation22]). Sub-optimal staging of colorectal cancer in England has been identified in an international study of clinical records, which showed that fewer lymph nodes were examined pathologically than elsewhere in Europe, and liver imaging was performed less often [Citation10]. More accurate staging would be expected to result in treatment that is more appropriate for stage, and thus higher survival. Concern about the consistency of staging quality in England has also been noted by a parliamentary committee [Citation8]. Cancer registries should routinely record the investigations that were performed to ascertain the stage at diagnosis (as has been done in Sweden since 2007). At the very least, registries should record whether stage was defined before or after histological investigation. This would improve comparability in international studies of stage at diagnosis and stage-specific survival.
We restricted the inclusion of data in these analyses to registries in which at least 50% of all patients were staged, in order to improve the generalisability of the results. In these data sets, stage was missing for 3–31% of patients. We imputed stage where it was missing, in order to reduce potential bias in stage-specific survival. Imputation is the most robust method for dealing with missing data, even when there are few variables with which to predict the missing values [Citation20]. Patients with missing data on stage tended to be older, and to have lower survival, which is why survival is lower in all stage categories after the inclusion of patients whose stage data were imputed.
Standard methods were used to deal with other issues of comparability and consistency that affect any population-based comparisons of cancer survival. Potential confounding by age was handled by age-standardisation. Consistent exclusion criteria were applied to cancer registrations from all countries and quality control was conducted centrally according to a common protocol. The completeness of registration of incident cancers is high in all these registries, but small differences could still contribute to differences in survival. In Sweden, cancer registrations are not initiated from death certificates, as elsewhere: some patients with poor survival could be missed as a result, but the completeness of the Swedish data is very high [Citation23], and the effect on overall survival will be minimal [Citation24]. A more serious issue for the survival comparisons was that sufficient information on stage was only available in the Canadian registries and Denmark for patients diagnosed during 2004–2007, compared to 2000–2007 in the other jurisdictions. Since survival was improving over time [Citation7], we would expect this to confer a slight advantage to Canada and Denmark in the survival comparisons, but a comparison of one-year survival for patients diagnosed during 2004–2007 in all jurisdictions did not change the international pattern of survival reported here (results available on request).
International differences in clinical staging procedures and data comparability may contribute marginally to international differences in stage distribution and survival, but they cannot fully explain the large international inequalities in survival and the pattern of those inequalities by stage. The stage distributions that we describe using these routinely collected cancer registry data are consistent with those found previously in population-based studies in the same countries [Citation25–28]. The survival estimates are clinically coherent in terms of age, stage and time since diagnosis, and they echo previous findings where available [Citation10,Citation29,Citation30]. Particularly high excess mortality at one month after diagnosis has also been reported before [Citation31–33]. The observation that older patients generally have a more favourable stage distribution than younger patients, even after the imputation of missing stage, is also consistent with previous studies [Citation34–36]. Therefore, while it is important that consistency in staging is improved for future population-based studies of colorectal cancer survival, this study shows overwhelming evidence of survival inequalities by stage of disease, as well as in the stage distribution. Both inequalities require policy attention.
During 2000–2007, no country had implemented a national screening programme using the faecal occult blood test (FOBT), but most were running pilot programmes in selected regions, e.g. in Odense (Denmark), since 1985 and in Nottingham (UK), since 1981. Gradual implementation of a national FOBT screening programme began in England from mid-2006, but the impact on national distributions of stage and overall survival during the overall period 2000–2007 is likely to have been small [Citation37].
Age-standardised one-year net survival ranged by 13% between the UK and Australia for colon cancer and by 9% between the UK and Sweden for rectal cancer, and patients in the UK consistently had the lowest survival at one and three years. The difference between the UK and the other five countries was statistically significant for each age group, except compared to the youngest age group in Denmark. The low survival in the UK cannot be fully explained by a more adverse stage distribution; survival in the UK was significantly lower than elsewhere for Dukes’ stage C and D cancers and survival was also statistically significantly lower for each category of SEER SS2000, except for the comparison with ‘localised’ rectal cancer in Denmark. We have alluded to the possible contribution of sub-optimal staging, but problems with access to optimal treatment may also contribute to the low survival in the UK.
Improvement in colorectal cancer survival has been attributed to three main factors: rising resection rates, falling post-operative mortality and the increased use of adjuvant chemotherapy [Citation27,Citation38]. Variation in these factors may help to explain international differences in stage-specific survival, particularly the low survival observed in the UK. EUROCARE data from the early 1990s have shown that resection rates in the UK were lower than in other European countries [Citation10], and post-operative mortality in the UK remains relatively high [Citation28]. Current treatment guidelines are similar in the UK [Citation39] and in countries with higher stage-specific survival like Canada [Citation40], but research is needed on their implementation.
In Denmark, age-standardised one-year net survival for colon cancer was statistically significantly lower by 4–9% than in the other countries except the UK, and 3–6% lower for rectal cancer. Stage-specific survival was also often slightly lower than elsewhere, but not consistently, and differences were only statistically significant for one-year survival from colon cancer. Denmark had the most adverse stage distribution for both colon and rectal cancer. A more advanced stage distribution has been noted previously in Denmark for colorectal cancer [Citation41] and other cancers [Citation42]. The reorganisation of cancer services in Denmark, which began in 2007, may improve this situation [Citation43].
Age-specific one-year net survival was higher for colon cancer in Australia and Sweden than elsewhere, and for rectal cancer in Canada and Sweden. Sweden and Canada had an unremarkable stage distribution, but high stage-specific survival, suggesting that other countries should aim for the stage-specific outcomes achieved in those countries.
In conclusion, there are wide international inequalities in survival from colorectal cancer, even between economically developed countries. Stage at diagnosis is crucial to prognosis. International surveillance of cancer survival by stage would be greatly improved by global consensus on a single cancer staging classification, and by consistent recording in cancer registries of stage at diagnosis and the procedures used to determine it.
Stage at diagnosis is an important contributing factor to low overall survival in Denmark. Elsewhere, the international differences in overall survival are also reflected within each category of stage, and this is more likely to be attributable to differences in the quality of staging and treatment. The UK, in particular, should consider its performance in this regard.
Supplementary Figures 1–3
Download PDF (667.8 KB)Acknowledgements
We thank the cancer registry staff in all jurisdictions, whose sustained efforts in data collection and quality control over many years have enabled colorectal cancer survival to be compared by stage at diagnosis. The authors would like to thank Martine Bomb, Catherine Foot and Donia Sadik at Cancer Research UK for their logistical support. This work was supported by the Department of Health, England. Cancer Research UK supports the Cancer Survival Group (C1336/A11700). The Northern Ireland Cancer Registry is funded by the Northern Ireland Public Health Agency. Sir Michael A Richards is the National Cancer Director (England), funded by the Department of Health. Other authors declare that they have no conflicts of interest.
Declaration of interest: The authors report no conflicts of interest. The authors alone are responsible for the content and writing of the paper.
References
- Parkin DM. Global cancer statistics in the year 2000. Lancet Oncol 2001;2:533–43.
- Jemal A, Bray F, Center MM, Ferlay J, Ward E, Forman D. Global cancer statistics. CA: A cancer journal for clinicians 2011;61:69–90.
- Coleman MP, Quaresma M, Berrino F, Lutz J-M, De Angelis R, Capocaccia R, et al. Cancer survival in five continents: A worldwide population-based study (CONCORD). Lancet Oncol 2008;9:730–56.
- Berrino F, Capocaccia R, Coleman MP, Estève J, Gatta G, Hakulinen T, et al. EUROCARE-3: The survival of cancer patients diagnosed in Europe during 1990–94. Ann Oncol 2003;14(Suppl. 5):1–155.
- Brenner H, Bouvier AM, Foschi R, Hackl M, Larsen IK, Lemmens V, et al. Progress in colorectal cancer survival in Europe from the late 1980s to the early 21st century: The EUROCARE study. Int J Cancer 2012;131:1649–58.
- Gatta G, Ciccolallo L, Capocaccia R, Coleman MP, Hakulinen T, Moller H, et al. Differences in colorectal cancer survival between European and US populations: The importance of sub-site and morphology. Eur J Cancer 2003;39:2214–22.
- Coleman MP, Forman D, Bryant H, Butler J, Rachet B, Maringe C, et al. Cancer survival in Australia, Canada, Denmark, Norway, Sweden, and the UK, 1995–2007 (the International Cancer Benchmarking Partnership): An analysis of population-based cancer registry data. Lancet 2011;377: 127–38.
- House of Commons Committee of Public Accounts. Delivering the Cancer Reform Strategy. [cited 2012 Mar 30]. Available from: http://www.publications.parliament.uk/pa/cm201011/cmselect/cmpubacc/667/667 pdf 2011 March 1; HC667, Session 2010–11.
- Maringe C, Walters S, Butler J, Coleman MP, Hacker N, Hanna L, et al. Stage at diagnosis and ovarian cancer survival: Evidence from the International Cancer Benchmarking Partnership. Gynecol Oncol 2012;127:75–82.
- Gatta G, Capocaccia R, Sant M, Bell CM, Coebergh JW, Damhuis RA, et al. Understanding variations in survival for colorectal cancer in Europe: A EUROCARE high resolution study. Gut 2000;47:533–8.
- Ciccolallo L, Capocaccia R, Coleman MP, Berrino F, Coebergh JW, Damhuis RA, et al. Survival differences between European and US patients with colorectal cancer: Role of stage at diagnosis and surgery. Gut 2005;54:268–73.
- Walters S, Maringe C, Butler J, Brierley JD, Rachet B, Coleman MP. Comparability of stage data in cancer registries in six countries: Lessons from the International Cancer Benchmarking Partnership. Int J Cancer 2013;132:676–85.
- Laurenti R, Coleman MP, Aylin P. Accuracy of statements of the cause of death on death certificates and the international comparability of mortality statistics. In: Coleman MP, Aylin P, editors. Death certification and mortality statistics: An international perspective. London: Office for National Statistics; 2000.
- Pohar-Perme M, Stare J, Estève J. On estimation in relative survival. Biometrics 2011;68:113–20.
- Lambert PC, Royston P. Further development of flexible parametric models for survival analysis. The Stata Journal 2009;9:265–90.
- Royston P, Lambert PC. Flexible parametric survival analysis using stata: Beyond the Cox Model. College Station, Texas: Stata Press; 2011.
- Remontet L, Bossard N, Belot A, Estève J, FRANCIM. An overall strategy based on regression models to estimate relative survival and models to estimate relative survival and model the effects of prognostic factors in cancer survival studies. Stat Med 2007;26:2214–28.
- Royston P. Multiple imputation of missing values: Update of ice. The Stata Journal 2005;5:527–36.
- White IR, Royston P, Wood AM. Multiple imputation using chained equations: Issues and guidance for practice. Stat Med 2011;30:377–99.
- Nur U, Shack LG, Rachet B, Carpenter JR, Coleman MP. Modelling relative survival in the presence of incomplete data: A tutorial. Int J Epidemiol 2010;39:118–28.
- Rubin DB. Multiple imputation for nonresponse in surveys. New York: John Wiley and Sons; 1987.
- Feinstein AR, Sosin DM, Wells CK. The Will Rogers phenomenon. Stage migration and new diagnostic techniques as a source of misleading statistics for survival in cancer. N Engl J Med 1985;312:1604–8.
- Talbäck M. Cancer patient survival in Sweden – theory and application. PhD thesis Karolinska Institutet, Sweden; 2011.
- Woods LM, Coleman MP, Lawrence G, Rashbass J, Berrino F, Rachet B. Evidence against the proposition that ‘UK cancer survival statistics are misleading’: Simulation study with national cancer registry data. BMJ 2011;342:d3399.
- Folkesson J, Engholm G, Ehrnrooth E, Kejs AM, Påhlman L, Harling H, et al. Rectal cancer survival in the Nordic countries and Scotland. Int J Cancer 2009;125:2406–12.
- Canadian Partnership Against Cancer. Colorectal cancer staging and survival. [cited 2012 Mar 30]. Available from: http://www cancerview ca/idc/groups/public/documents/webcontent/rl_crc_snapshot_three_en pdf 2010 November.
- Angell-Andersen E, Tretli S, Coleman MP, Langmark F, Grotmol T. Colorectal cancer survival trends in Norway 1958–1997. Eur J Cancer 2004;40:734–42.
- Morris EJ, Taylor EF, Thomas JD, Quirke P, Finan PJ, Coleman MP, et al. Thirty-day postoperative mortality after colorectal cancer surgery in England. Gut 2011;60:806–13.
- Birgisson H, Talbäck M, Gunnarsson U, Påhlman L, Glimelius B. Improved survival in cancer of the colon and rectum in Sweden. Eur J Surg Oncol 2005;31:845–53.
- Monnet E, Faivre J, Raymond L, Garau I. Influence of stage at diagnosis on survival differences for rectal cancer in three European populations. Br J Cancer 1999;81:463–8.
- Engholm G, Kejs AM, Brewster DH, Gaard M, Holmberg L, Hartley R, et al. Colorectal cancer survival in the Nordic countries and the United Kingdom: Excess mortality risk analysis of 5 year relative period survival in the period 1999 to 2000. Int J Cancer 2007;121:1115–22.
- Morris EJ, Sandin F, Lambert PC, Bray F, Klint A, Linklater K, et al. A population-based comparison of the survival of patients with colorectal cancer in England, Norway and Sweden between 1996 and 2004. Gut 2011;60:1087–93.
- Klint A, Engholm G, Storm HH, Tryggvadóttir L, Gislum M, Hakulinen T, et al. Trends in survival of patients diagnosed with cancer of the digestive organs in the Nordic countries 1964 - 2003 followed up to the end of 2006. Acta Oncol 2010;49:578–607.
- Zafar SY, Abernethy AP, Abbott DH, Grambow SC, Marcello JE, Herndon JE, et al. Comorbidity, age, race and stage at diagnosis in colorectal cancer: A retrospective, parallel analysis of two health systems. BMC Cancer 2008;8:345.
- Mandelblatt J, Andrews H, Kao R, Wallace R, Kerner J. The late-stage diagnosis of colorectal cancer: Demographic and socioeconomic factors. Am J Publ Health 1996;86:1794–7.
- Rudy DR, Zdon MJ. Update on colorectal cancer. Am Fam Physician 2000;61:1759–74.
- National Cancer Institute. International Screening Network: Inventory of colorectal cancer screening activities in ICSN Countries. 2009.
- Mitry E, Bouvier AM, Esteve J, Faivre J. Improvement in colorectal cancer survival: A population-based study. Eur J Cancer 2005;41:2297–303.
- National Institute for Clinical Excellence. Guidance on cancer services: Improving outcomes in colorectal cancers. [cited 2012 Mar 30]. Available from: http://www.nice.org.uk/nicemedia/live/10895/28832/28832.pdf 2004
- Canadian Partnership Against Cancer. Cancer Practice Guidelines Status Report: Colorectal Cancer. [cited 2012 Mar 30]. Available from: http://www.cancerview.ca/idc/groups/public/documents/webcontent/cep_colorec_guid_stsrpt.pdf 2010 July
- Korsgaard M, Pedersen L, Laurberg S. Delay of diagnosis and treatment of colorectal cancer – a population-based Danish study. Cancer Det Prev 2008;32:45–51.
- Christensen LH, Engholm G, Ceberg J, Hein S, Perfekt R, Tange UB, et al. Can the survival difference between breast cancer patients in Denmark and Sweden 1989 and 1994 be explained by patho-anatomical variables? – A population-based study. Eur J Cancer 2004;40:1233–43.
- Olesen F, Hansen RP, Vedsted P. Delay in diagnosis: The experience in Denmark. Br J Cancer 2009;101(Suppl 2):5–8.