Abstract
Background. Acquired resistance to imatinib is frequently caused by secondary KIT mutations. We have investigated the effects of imatinib in mice with human gastrointestinal stromal tumour (GIST) xenograft which harbours a primary exon 11 deletion mutation and a secondary imatinib resistance mutation D816H in exon 17. Such mutations are commonly present in imatinib-resistant GIST in humans. Material and methods. The mice were randomly allocated to receive imatinib either continuously or intermittently. Dynamic 18F-FDG PET was performed and blood volume fraction (vB), rate transfer constants (k1, k2, k3) and metabolic rate of 18F-FDG (MRFDG) were computed using a three-compartment model. Tumours were evaluated for the mitotic rate and the expression of HIF-1α , caspase-3 and glucose transporters (GLUTs). Results. Both intermittent and continuous imatinib delayed tumour growth significantly compared to controls, significantly in favour of the latter. k1 (representing perfusion, vascular permeability and binding of 18F-FDG to the GLUTs) was significantly higher in the intermittent group compared to the continuous group, as was tumour GLUT-3 expression. k3 (representing internalisation of 18F-FDG to the cells) and MRFDG were significantly lower. Conclusion. Imatinib delays GIST xenograft growth despite the presence of the D816H resistance mutation. The schedule of imatinib administration may influence tumour glucose uptake rate and metabolic rate.
Gastrointestinal stromal tumour (GIST) is the most common sarcoma of the digestive tract [Citation1]. Approximately 95% of GISTs express KIT, the receptor for the stem cell factor [Citation2]. KIT mutations frequently result in KIT phosphorylation and constitutive activation. In a few GISTs (5–10%) a mutation is found in the gene encoding the platelet-derived growth factor receptor alpha (PDGFRA). Both KIT and PDGFRA receptors are tyrosine kinases and key players in GIST tumourigenesis [Citation3]. By the introduction of the tyrosine kinase inhibitor (TKI) imatinib, a selective inhibitor of KIT, PDGFRA and a few other kinases, a new era in the management of GIST began [Citation4,Citation5]. Most patients with advanced GIST respond to imatinib, the standard first-line treatment, but the majority eventually progress with the median time to imatinib resistance being approximately two years [Citation5]. In acquired imatinib resistance secondary mutations in KIT exons 13 and 17 are common resulting in a kinase conformation that prohibits imatinib from binding to the kinase [Citation6].
A metabolic response to imatinib in GIST may be observed early with 2-deoxy-2-[18F]fluoro-D-glucose (18F-FDG) positron emission tomography (PET) [Citation4], sometimes even within a few hours after starting imatinib [Citation7,Citation8]. Dynamic 18F-FDG PET enables assessment of tissue uptake of the tracer in space and time following injection and may offer valuable information about tumour vascularisation and its metabolic characteristics [Citation9].
Human tumour xenografts are useful for evaluating novel therapeutic agents, since tumour vascular and stromal components cannot be addressed in vitro. The GIST human xenograft model AHAX [Citation10] originates from a patient with a clinically imatinib-resistant GIST harbouring a primary KIT exon 11 mutation (sensitive to imatinib) and a secondary KIT exon 17 mutation (likely treatment-induced mutation). Since KIT exon 11 is the most common site of mutation in primary GIST and KIT exon 17 is the most frequent site of a secondary resistance mutation [Citation11], this model reflects the most common clinical scenario in imatinib-resistant GIST.
Imatinib, administered usually continuously at a dose of 400 mg/day, is generally well tolerated and despite prior tumour progression during first-line imatinib it is often considered as the last-line palliative systemic treatment for patients with advanced GIST [Citation12]. This practice is, however, controversial in the absence of other than anecdotal supportive clinical experiences. A randomised clinical trial is currently comparing imatinib plus the best supportive care to the latter alone as palliative treatment of advanced GIST (ClinicalTrials.gov identifier NCT1151852). Somewhat unexpectedly withdrawal of imatinib in responding patients and reinstitution of imatinib at the time of metastatic progression, did not affect survival in a large randomised clinical trial [Citation13,Citation14].
The aim of the present study was to evaluate the potential benefits of continuous and intermittent imatinib administration in an experimental human GIST xenograft model harbouring imatinib resistance mutation. This was evaluated by tumour growth measurements and assessment of tumour metabolic activity (with dynamic 18F-FDG PET), mitotic rate, and expression of HIF-1α, caspase-3 and GLUTs.
Material and methods
Animals and xenografts
Human GIST AHAX xenografts with a mutation in KIT exon 11 (c.1673_1687del, p.Lys558_Glu562del) and KIT exon 17 (c.2446G> C, p.Asp816His) [Citation10] were established by subcutaneous implantation of tumour tissue fragments (˜2 × 2× 2 mm3) bilaterally into NCR athymic mice. The mice were kept under specific pathogen-free conditions at a constant temperature (22–24°C) and humidity (55–60%), and were given sterilised food and tap water ad libitum.
Six weeks after implantation 37 mice were randomly allocated into a control group (n = 12) or to one of two imatinib treatment groups, where imatinib was administrated either continuously (n = 13) or intermittently (n = 12, one week on and one week off). The study was approved by the Institutional Committee on Research on Animal Care and was performed according to Interdisciplinary Principles and Guidelines for the Use of Animals in Research, Marketing and Education (New York Academy of Science, New York, NY, USA).
Tumour volume measurements
Tumour size was measured by a caliper twice weekly from the date of implantation. Tumour volume was calculated using the modified ellipsoid formula [Citation15], where the volume V(mm3) = (л/6)× a(mm)× b2(mm2), a and b being the longest and the perpendicular tumour diameters, respectively. The measurements were normalised to individual pre-treatment (day 0) tumour volumes. Estimated tumour volume doubling time was calculated using linear regression on ln-transformed normalised tumour volumes.
Imatinib administration
Imatinib (Glivec®, Novartis Pharma GmbH, Basel, Switzerland) was dissolved in distilled water and given by oral gavage: either 100 mg/kg once daily (the continuous treatment group) or in two-week cycles, with imatinib given daily for seven days followed by placebo (water) for seven days (the intermittent treatment group). The control group received water only by oral gavage. The duration of the experiment was 91 days.
Dynamic 18F-FDG PET imaging
Four mice from each of the three groups underwent dynamic 18F-FDG PET one day prior to sacrifice, using a small animal PET scanner (microPET Focus 120, Siemens Medical Solutions, Erlangen, Germany). Following overnight fasting the mice were anesthetised and given an i.v. bolus injection of 7–10 MBq 18F-FDG (GE Healthcare AS, Oslo, Norway) diluted in heparinised saline [Citation7]. Acquisition of list-mode data started prior to 18F-FDG injection and lasted for 50 minutes post-injection. The dynamic PET images were reconstructed using OSEM-MAP [Citation16,Citation17] producing images with a voxel size of 0.87 × 0.87 × 0.80 mm3. The reconstructed time frames were 10 seconds during the initial 1.5 minutes followed by reduced temporal resolution for the remaining frames. Kinetic modeling of the DICOM-images was performed using in-house written IDL-programs (Interactive Data Language, v6.2, Research Systems Inc., Boulder, CO, USA). Briefly, the mean time activity curves (TACs) for each tumour were calculated and normalised to individual arterial input functions (AIFs) to account for differences in the injected 18F-FDG activity between the animals [Citation9].
A three-compartment model consisting of a blood compartment and two sequential tissue compartments was used to evaluate the 18F-FDG kinetics. The concentration in tissue (CT) is assumed to be separated into a free (non-metabolised) and a bound (metabolised) compartment with tracer concentrations of CF and CB, respectively (). The exchange of 18F-FDG between the two tissue compartments is described by the rate constants k1, k2, k3, and k4 [min−1], where k1 includes perfusion, vascular permeability and the binding of 18F-FDG to the GLUT receptors, k2 the clearance of 18F-FDG back into the blood, k3 the cellular internalisation, and k4 the cellular externalisation. The kinetic parameters were estimated by fitting the TAC to this model and non-linear least squares minimisation. k4 was assumed to be low, and was set to zero in the calculations. The blood volume fraction (vB) was estimated as described previously [Citation18]. The metabolic rate of 18F-FDG (MRFDG) was defined as (k1∙k3)/(k2 + k3). The fit between the measured TACs and the curves obtained from modeling were evaluated by calculating correction coefficients (r2) for each tumour voxel.
Figure 1. The three-compartment model used for extracting pharmacokinetic information from dynamic 18F-FDG PET. CP is the concentration of 18F-FDG in plasma, and the tissue concentration CT is composed of non-metabolized, or free, 18F-FDG CF, and metabolized, or bound, 18F-FDG, CB. CT is further separated into not metabolised or free 18F-FDG, CF, and metabolised or bound 18F-FDG, CB. The kinetic parameters k1 (min−1) and k2 (min−1) describe the forward and backward 18F-FDG diffusion, respectively. The k3 (min−1) and k4 (min−1) parameters signify the rates of 18F-FDG phosphorylation and dephosphorylation, respectively, i.e., reflecting protein binding or glucose metabolism.
Histopathology and immunohistochemistry
At the end of the experiment the mice were sacrificed by neck dislocation and tumour sites were matched with the in vivo imaging slices. The xenografts were excised and divided in two; one half was snap-frozen in liquid nitrogen and stored at °80°C, while the second half was formalin-fixed and paraffin-embedded.
The paraffin-embedded sections were stained using a standard method (Dako EnVisionTM+ System, Peroxidase (DAB) (K4011, Dako, Glostrup, Denmark) and a Dako Autostainer). The primary antibodies, dilutions, pH retrieval solution and the positive controls are listed in . The proportion of positively staining tumour cells was assessed semiquantitatively as absent (0, no immunostaining), slight (1, < 10% of tumour cells were stained), moderate (2, 10–50% of cells showed staining), or strong (3, > 50% of cells were stained). The intensity of staining was recorded as absent (0), weak (1), moderate (2) or strong (3). A staining score was obtained by multiplying these two values. The mitotic index was counted per 20 high power fields (HPFs) using a Leica DM2500 microscope (Leica Microsystems CMS, Germany) with an objective × 40 giving an area of 0.31 mm2 for a single HPF.
Table I. The primary antibodies used for immunohistochemistry.
KIT and PDGFRA mutation analysis
Genomic DNA was extracted from 10 AHAX xenografts. Thirty nanograms of DNA was amplified using Phusion® Hot Start DNA polymerase and Phusion GC buffer (Finnzymes, Espoo, Finland). The thermal cycling conditions were DNA denaturation at 98°C for 30 seconds, five cycles at 98°C for 10 seconds, 65°C for 15 seconds and 72°C for 10 seconds, followed by 35 similar cycles where the annealing temperature was reduced to 60°C. Final extension was allowed at 72°C for 1 minute (The forward and reverse PCR primer pairs used can be provided upon request). The sequencing reactions were performed in two directions using the BigDye® Terminator v1.1 Cycle Sequencing Kit (Life Technologies, Carlsbad, CA, USA). The sequencing products were run on an automatic capillary sequencer (3130xl Genetic Analyzer, Life Technologies, Paisley, UK).
Statistical analysis
Statistical analyses were performed using Excel® (Microsoft Corporation, Redmond, WA, USA) and SPSS version 18.0 (SPSS Science, Chicago, IL, USA). Non-Gaussian distributions were compared using the non-parametric Mann-Whitney U-test. Two-sided t-test was used to compare the first order least-square linear regression estimated tumour doubling times. Significance was set to 5%.
Results
Tumour growth
Tumour growth was observed in 70 (95%) of the 74 implants in the 37 mice. One mouse was sacrificed prematurely because of oesophageal perforation and was excluded from the study. The tumour volumes did not differ significantly between the three groups prior to therapy, with a median pretreatment tumour volume of 120 mm3 (range; 22–340 mm3, SE; ± 73 mm3). The normalised tumour volume growth curves are shown in . The tumour volume doubling time in the control group was 24.7 days (95% CI 21.9–28.4 days). The tumour doubling time was significantly shorter in the intermittent imatinib group (47.4 days; 95% CI 40.6–56.9 days) compared to the continuous group (130.9 days; 95% CI 84.2–293.5 days; p < 0.001). Both treatment groups showed significantly longer tumour volume doubling times compared to the untreated tumours (p < 0.001).
Figure 2. Normalised tumour volume growth of the human GIST AHAX xenograft in mice receiving either imatinib (100 mg/kg/day) continuously, intermittently (one week on, one week off) or placebo (water). At the end of experiment, mice with particularly large tumours were scarified, causing a dip in tumour volume growth (the light grey symbols). The data are given as means and standard errors of the means.

Dynamic 18F-FDG PET
18F-FDG PET of the treated animals was performed after 88 days of treatment, at a time point where both treatment groups were receiving imatinib. shows a series of 18F-FDG PET images demonstrating tracer uptake in a flank tumour in the continuous imatinib group. The TACs from the tumours treated with intermittent imatinib showed higher uptake and reached a plateau earlier after tracer injection as compared to the tumours treated with continuous imatinib (25 minutes vs. 30 minutes, respectively). The median area under the normalised TAC curve was 20% higher for the intermittent group, albeit not significantly different (p = 0.08) (data not shown).
Figure 3. An example of cumulative 18F-FDG uptake with time in a human GIST AHAX xenograft model (A). The white arrows point at the tumour. 18F-FDG uptake as a function of time for two selected voxels within the xenograft is shown in (B). The uptake curves for the free and bound 18F-FDG components obtained from kinetic modeling are provided.
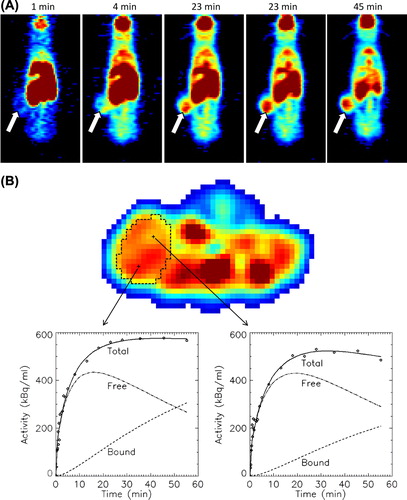
TACs of two voxels located at different sites within a continuous imatinib-treated xenograft are shown in . Using kinetic modeling, the TAC of the voxels were separated into free (not metabolised) and bound (metabolised) components. The goodness of fit between the measured TACs and the uptake curves obtained from modeling ranged from 0.91 to 0.98 with no significant differences between the two treatment groups. Mean k1, k2, k3, MRFDG and vB for both treatment groups are summarised in . Significant differences were found for the kinetic parameters k1, k3 and MRFDG. The influx k1 parameter was 32% higher in the intermittent group (p = 0.01), while k3 and MRFDG were 95% (p = 0.01) and 50% (p = 0.03) higher in the continuous treatment group, respectively. No significant correlations were found between the tumour volumes and the tumour pharmacokinetic parameters.
Table II. Results from pharmacokinetic modelling of dynamic 18F-FDG PET data. Data are given as median values.
Tumour histology and immunohistochemistry
Microscopic examination of the haematoxylin stained tumour sections revealed no differences in tumour morphology between the three groups. However, the mitotic index was significantly higher in the control group (median; 13 mitoses/20 HPFs) as compared to the continuous and the intermittent group (both medians 4/20 HPFs, p = 0.02). The cytoplasmic GLUT-1 expression was significantly higher in the control group as compared to the intermittent group (median score 9 vs. 6; p = 0.023) and the continuous group (median score 6; p = 0.009). Both treatment groups had a significantly higher expression of cytoplasmic GLUT-2 (both median scores 9) than the control group (median score 3; p < 0.001). The expression of both the cytoplasmic and the membranous form of GLUT-3 were significantly higher (p < 0.001) in xenografts treated with intermittent imatinib (median score 3 and 3, respectively) as compared to xenografts treated with continuous imatinib (median score 0 and 0, respectively). There were no differences between the three groups with respect to HIF-1α or caspase-3 expression (data not shown).
KIT and PDGFRA mutations
Ten xenografts (continuous group, 4; intermittent group, 3; control group, 3) were analysed for KIT and PDGFRA mutations to investigate tumour mutation status at the end of the experiment. Sequencing confirmed that all xenografts had maintained the original mutation in KIT exon 11 (c.1673_1687del, p.Lys558_Glu562del) and in KIT exon 17 (c.2446G> C, p.Asp816His). No further mutations were detected in KIT exons 9, 14 or 17, or in PDGFRA exons 12, 14 or 18.
Discussion
We explored the effects of imatinib administered either intermittently or continuously in a human GIST xenograft harbouring the D816H mutation, which is a mutation considered to cause clinical imatinib resistance in GIST patients. The results show that the tumours do not regress either with intermittent or continuous imatinib, but, notably, they grow at a substantially slower rate than untreated tumours. This finding suggests that GISTs with a KIT 11 deletion mutation coupled with a D816H substitution mutation are not entirely imatinib-resistant. From a clinical point of view this is potentially an important observation, since the KIT exon 11 deletion mutation is the most common mutation in GIST, and exon 17 point mutations are the most frequent mutations considered to confer imatinib resistance. In clinical practice, imatinib administration is often discontinued when advanced GIST stops to respond to imatinib, and alternative treatments such as sunitinib or other TKIs are instituted. Anecdotal clinical experience suggests that reinstitution of imatinib after failure of the second- or third-line TKI treatments may still slow down GIST progression compared to no systemic treatment. Although firm clinical evidence is lacking, reinstitution of imatinib may still be advantageous as the last-line palliative care [Citation12].
The reason for imatinib benefit in the presence of D816H remains hypothetical. The KIT exon 11 deletion mutation, unlike the D816H mutation, continues to be sensitive to imatinib, which may results in a less active KIT kinase in the presence of imatinib as compared to a kinase where both mutations are uninhibited. If this hypothesis is correct, the present findings may have relevance to many GISTs with an imatinib-sensitive primary mutation and an imatinib-insensitive secondary mutation. The original primary mutation is virtually always present in GISTs that contain a secondary resistance mutation [Citation11]. Of note, more than one secondary mutation are commonly found in tumours that grow during imatinib treatment, sometimes even within the same metastasis [Citation19]. Our findings may thus lend support to rechallenge with imatinib, even in cases when multiple secondary resistance mutations are present, provided that the primary mutation is imatinib-sensitive.
The French Sarcoma Group investigated in the randomised BRF14 trial the effect of interrupting imatinib treatment at after either one, three or five years of treatment in patients with advanced GIST who continued to respond to imatinib. Interruption of imatinib resulted in rapid GIST progression in the majority of patients, but almost all patients responded to imatinib reinstitution. No overall survival difference was seen between the interruption and the continuation groups, regardless of the timing of imatinib interruption [Citation13,Citation14]. Rapid cycling of imatinib administration (one week on, one week off) has not been tested in clinical trials, but the present result showed no benefits during the 91-day observation period.
The AHAX xenograft model of human GIST has proven useful for studying 18F-FDG uptake responses to TKIs [Citation7]. In the current study we found differences in the dynamic 18F-FDG uptake characteristics between the intermittent and the continuous treatment groups imaged while the mice were on imatinib. The TAC amplitude was higher in the intermittent group indicating either increased perfusion and/or increased metabolism compared to the continuous group. The tumour metabolic rate (MRFDG), in turn, was higher in the continuous group, whereas k1 was higher and k3 lower in the intermittent group as compared to the continuous group suggesting presence of more perfusion, vascular permeability or vascular damage (high flow, leaky vessels) in the intermittent group [Citation20]. Lack of correlations between tumour volumes and kinetic parameters indicate that tumour size could not explain the observed differences in FDG uptake. Taken together, these findings suggest that the schedule of imatinib administration influences tumour glucose uptake and metabolic rate. This observation should, however, be interpreted with some caution, since only four mice from each group underwent dynamic PET and the tumours showed heterogeneity in the PET parameters.
The GLUTs play a central role in the accumulation of 18F-FDG within tumour cells. GLUT-1 is present in most cell types and is a key factor in glucose uptake, but different cancers express different GLUTs [Citation21,Citation22]. We found a difference in GLUT-3 expression between the two treatment groups. GLUT-3 is expressed in neurons and was originally designated as the neuronal GLUT. GISTs may show both muscle and neuronal differentiation and GLUT-3 expression may in part be related to rapid 18F-FDG uptake in GISTs [Citation23]. Imatinib induces GLUT translocation from the plasma membrane to the cytosol via endocytosis [Citation24,Citation25]. In line with this, we found higher cytoplamic GLUT-2 expression in both imatinib groups compared to the control group.
In conclusion, the present study suggests that continuation of imatinib treatment may still benefit some GIST patients despite presence of an imatinib resistance mutation, such as D816H. In this setting, imatinib may slow down tumour progression, possibly by inhibiting the imatinib-sensitive primary mutation. Both continuous imatinib administration and the alternating one week on – one week off administration slowed down tumour progression, but the tumour growth was significantly more rapid with the alternating scheme. We found differences in 18F-FDG uptake kinetics and tumour 18F-FDG metabolic rate between the continuous and the intermittent imatinib administration groups, but their clinical significance remains unknown.
Acknowledgements
The authors greatly acknowledge pathologist Ingvild Victoria Lobmaier and Bodil Bjerkehagen and the technical assistance provided by Mette Førsund and chief engineer Hong Qu.
Declaration of interest: The authors report no conflicts of interest. The authors alone are responsible for the content and writing of the paper.
This work was financially supported by the Norwegian Cancer Society grant 80114001 (TS) and The Norwegian Radium Hospital Research Foundation (MER).
References
- Miettinen M, Lasota J. Gastrointestinal stromal tumors (GISTs): Definition, occurrence, pathology, differential diagnosis and molecular genetics. Pol J Pathol 2003;54:3–24.
- Hirota S, Isozaki K, Moriyama Y, Hashimoto K, Nishida T, Ishiguro S, et al. Gain-of-function mutations of c-kit in human gastrointestinal stromal tumors. Science 1998;279:577–80.
- Rubin BP, Singer S, Tsao C, Duensing A, Lux ML, Ruiz R, et al. KIT activation is a ubiquitous feature of gastrointestinal stromal tumors. Cancer Res 2001;61:8118–21.
- Joensuu H, Roberts PJ, Sarlomo-Rikala M, Andersson LC, Tervahartiala P, Tuveson D, et al. Effect of the tyrosine kinase inhibitor STI571 in a patient with a metastatic gastrointestinal stromal tumor. N Engl J Med 2001;344:1052–6.
- Blanke CD, Demetri GD, von MM, Heinrich MC, Eisenberg B, Fletcher JA, et al. Long-term results from a randomized phase II trial of standard versus higher-dose imatinib mesylate for patients with unresectable or metastatic gastrointestinal stromal tumors expressing KIT. J Clin Oncol 2008;26:620–5.
- Gramza AW, Corless CL, Heinrich MC. Resistance to tyrosine kinase inhibitors in gastrointestinal stromal tumors. Clin Cancer Res 2009;15:7510–8.
- Revheim ME, Roe K, Bruland OS, Bach-Gansmo T, Skretting A, Seierstad T. Monitoring the effect of targeted therapies in a gastrointestinal stromal tumor xenograft using a clinical PET/CT. Mol Imaging Biol 2011;13:1234–40.
- Shinto A, Nair N, Dutt A, Baghel NS. Early response assessment in gastrointestinal stromal tumors with FDG PET scan 24 hours after a single dose of imatinib. Clin Nucl Med 2008; 33:486–7.
- Roe K, Aleksandersen TB, Kristian A, Nilsen LB, Seierstad T, Qu H, et al. Preclinical dynamic 18F-FDG. Acta Oncol 2010;49:914–21.
- Revheim ME, Seierstad T, Berner JM, Bruland OS, Roe K, Ohnstad HO, et al. Establishment and characterization of a human gastrointestinal stromal tumour (GIST) xenograft in athymic nude mice. Anticancer Res 2009;29:4331–6.
- Heinrich MC, Corless CL, Blanke CD, Demetri GD, Joensuu H, Roberts PJ, et al. Molecular correlates of imatinib resistance in gastrointestinal stromal tumors. J Clin Oncol 2006; 24:4764–74.
- National Comprehensive Cancer Network. Clinical practice guidelines in oncology. Soft tissue sarcoma. [2]. 2012. Ref Type: Data File.
- Blay JY, Le CA, Ray-Coquard I, Bui B, Duffaud F, Delbaldo C, et al. Prospective multicentric randomized phase III study of imatinib in patients with advanced gastrointestinal stromal tumors comparing interruption versus continuation of treatment beyond 1 year: The French Sarcoma Group. J Clin Oncol 2007;25:1107–13.
- Le CA, Ray-Coquard I, Bui BN, Adenis A, Rios M, Bertucci F, et al. Discontinuation of imatinib in patients with advanced gastrointestinal stromal tumours after 3 years of treatment: An open-label multicentre randomised phase 3 trial. Lancet Oncol 2010;11:942–9.
- Euhus DM, Hudd C, LaRegina MC, Johnson FE. Tumor measurement in the nude mouse. J Surg Oncol 1986;31: 229–34.
- Qi J, Leahy RM, Cherry SR, Chatziioannou A, Farquhar TH. High-resolution 3D Bayesian image reconstruction using the microPET small-animal scanner. Phys Med Biol 1998;43: 1001–13.
- Qi J, Leahy RM. Resolution and noise properties of MAP reconstruction for fully 3-D PET. IEEE Trans Med Imaging 2000;19:493–506.
- Kamasak ME, Bouman CA, Morris ED, Sauer K. Direct reconstruction of kinetic parameter images from dynamic PET data. IEEE Trans Med Imaging 2005;24:636–50.
- Liegl B, Kepten I, Le C, Zhu M, Demetri GD, Heinrich MC, et al. Heterogeneity of kinase inhibitor resistance mechanisms in GIST. J Pathol 2008;216:64–74.
- Mullani NA, Herbst RS, O’Neil RG, Gould KL, Barron BJ, Abbruzzese JL. Tumor blood flow measured by PET dynamic imaging of first-pass 18F-FDG uptake: A comparison with 15O-labeled water-measured blood flow. J Nucl Med 2008; 49:517–23.
- Godoy A, Ulloa V, Rodriguez F, Reinicke K, Yanez AJ, Garcia ML, et al. Differential subcellular distribution of glucose transporters GLUT1-6 and GLUT9 in human cancer: Ultrastructural localization of GLUT1 and GLUT5 in breast tumor tissues. J Cell Physiol 2006;207:614–27.
- Yamamoto T, Seino Y, Fukumoto H, Koh G, Yano H, Inagaki N, et al. Over-expression of facilitative glucose transporter genes in human cancer. Biochem Biophys Res Commun 1990; 170:223–30.
- Gogvadze V, Orrenius S, Zhivotovsky B. Mitochondria in cancer cells: What is so special about them? Trends Cell Biol 2008;18:165–73.
- Prenen H, Stefan C, Landuyt B, Vermaelen P, Debiec-Rychter M, Bollen M, et al. Imatinib mesylate inhibits glucose uptake in gastrointestinal stromal tumor cells by downregulation of the glucose transporters recruitment to the plasma membrane. Am J Biochem Biotechnol 2005;1:95–102.
- Tarn C, Skorobogatko YV, Taguchi T, Eisenberg B, von MM, Godwin AK. Therapeutic effect of imatinib in gastrointestinal stromal tumors: AKT signaling dependent and independent mechanisms. Cancer Res 2006;66:5477–86.