
Abstract
Background. Understanding the dose-response of the lung in order to minimize the risk of radiation pneumonitis (RP) is critical for optimization of lung cancer radiotherapy. We propose a method to combine the dose-response relationship for RP in the landmark QUANTEC paper with known clinical risk factors, in order to enable individual risk prediction. The approach is validated in an independent dataset. Material and methods. The prevalence of risk factors in the patient populations underlying the QUANTEC analysis was estimated, and a previously published method to adjust dose-response relationships for clinical risk factors was employed. Effect size estimates (odds ratios) for risk factors were drawn from a recently published meta-analysis. Baseline values for D50 and γ50 were found. The method was tested in an independent dataset (103 patients), comparing the predictive power of the dose-only QUANTEC model and the model including risk factors. Subdistribution cumulative incidence functions were compared for patients with high/low-risk predictions from the two models, and concordance indices (c-indices) for the prediction of RP were calculated. Results. The reference dose- response relationship for a patient without pulmonary co-morbidities, caudally located tumor, no history of smoking, < 63 years old, and receiving no sequential chemotherapy was estimated as D500 = 34.4 Gy (95% CI 30.7, 38.9), γ500 = 1.19 (95% CI 1.00, 1.43). Individual patient risk estimates were calculated. The cumulative incidences of RP in the validation dataset were not significantly different in high/low-risk patients when doing risk allocation with the QUANTEC model (p = 0.11), but were significantly different using the individualized model (p = 0.006). C-indices were significantly different between the dose-only and the individualized model. Conclusion. This study presents a method to combine a published dose-response function with known clinical risk factors and demonstrates the increased predictive power of the combined model. The method allows for individualization of dose constraints and individual patient risk estimates.
Background
Understanding the dose-response of normal tissue is of critical importance for the optimization of radiotherapy (RT). Radiation-induced pneumonitis (RP) remains a dose-limiting toxicity in the treatment of lung cancer patients, and hence identification of relationships between dose and the probability of RP is vital if constraints on the safely deliverable radiation dose are to be determined. A great many studies have proposed predictive models for the risk of developing RP after curative RT [Citation1]. Although progress has been made [Citation2], a considerable challenge remains with the generalizability of such models. Even when sophisticated statistical techniques are employed in order to avoid over-fitting, model results may not be generalizable to different patient cohorts [Citation3].
A major step forward for the understanding of the dose-dependence of radiation-induced lung toxicity was represented by the organ specific paper from the Quantitative Analysis of Normal Tissue Effects in the Clinic (QUANTEC) initiative [Citation1], which performed a collective analysis on a number of published studies. The authors related mean dose to the lungs (MLD) to the risk of RP for non-small cell lung cancer (NSCLC) patients, and provided a quantitative estimate of the dose-response relationship. This represents an impressive and important undertaking, which will aid both clinical dose planning and design of future RT studies. However, the published dose-response relationship is an estimate of the risk in an ‘average’ NSCLC patient. Prediction of the risk of RP for individual patients is still fraught with uncertainties, and this may be part of the reason for the limited predictive power of even the best published models.
Patient, disease- and treatment-related factors (which we will collectively refer to as clinical risk factors) are well known to influence the risk of developing RP. The quantitative effects of such risk factors have recently been summarized in a large meta- analysis [Citation4]; but even though a number of individual studies have examined the specific effects of various clinical factors on the RP dose-response (e.g. [Citation2,Citation5,Citation6]), these studies remain limited in their power to detect and accurately quantify the simultaneous effects of several risk factors. Relatively recently, molecular biomarkers for the development or RP have also been added to the mix (e.g. [Citation7,Citation8]), but absence of validation in independent datasets remains a problem in this setting [Citation9].
In this study, we demonstrate how the QUANTEC estimate for the dose-response relationship for RP can be adjusted for the effects of the multiple clinical factors identified in the meta-analysis by Vogelius & Bentzen [Citation4]; and how individual risk estimates and dose-constraints can subsequently be calculated. We validate this method in an independent dataset by illustrating the improved predictive value of the individual risk estimates compared to the dose-only QUANTEC relationship.
Material and methods
The QUANTEC paper suggested a relationship between MLD and the risk (normal tissue complication probability, NTCP) of ‘symptomatic RP’ described by a logistic function
with the parameters:
D50 is the dose which results in a 50% complication probability, and γ50 is the normalized slope of the dose response curve at this point [Citation10].
In the present study, the aim was to obtain the dose-response relationship for a patient with a known set of clinical factors. (For the sake of brevity, all such factors are, in the following, referred to as ‘risk factors’, despite some demonstrating a protective effect.) This was done employing our previously published method [Citation11] for correcting dose-response relationships for clinical risk factors, using the estimated prevalence of the various risk factors as well as odds ratios (ORs) for the effects. From our paper, if a dose-response relationship (with parameters D50 and γ50) is based on a study population wherein a fraction s of the patients demonstrated a risk factor (with a corresponding OR), then the dose-response in another population, with the risk factor completely absent, can be approximately described by
where
Note that Equation 4 implicitly assumes that the OR for a given risk factor is independent of dose. Dose-response relationships for individual patients with a specific set of risk factors were based on these parameter estimates. The modified logistic function in the presence of a single risk factor was
and hence the effect of the risk factor on the parameters describing the dose-response relationship was given by:
All ORs were assumed to be independent and hence multiplicative in the logistic model (cf. Equation 1). For multiple risk factors, this multiplicity of odds ratios (i.e. ORcombined = ORrisk factor 1* ORrisk factor 2*…) was exploited, and the model parameters were found from Equation 7 and 8 with ORcombined.
The constraint on the MLD corresponding to a stipulated probability of normal tissue toxicity (e.g. NTCP ≤ 20%) could be found directly from the inverted equation (6)
ORs for the effects of the various clinical risk factors were drawn from Vogelius and Bentzen [Citation4], see . The prevalence of the various risk factors in the study populations included in the QUANTEC analysis was only reported in a subset of the studies. However, assuming that those studies were representative for the remaining, the overall prevalence was estimated by calculation of weighted averages.
Table I. Odds ratios for the effects of clinical risk factors.
Confidence intervals for the calculated parameter values, risk estimates and dose constraints were approximated using random sampling. For each variable entering the model, we considered an analytical probability density function (see below) for that variable around the point estimate, based on the 95% confidence intervals found in the original reports. Then random values were sampled from the probability distributions and used to calculate estimates of parameters, risks and dose constraints. This was repeated 106 times to provide for probability distributions for each of the reported estimates; the 95% confidence interval reported in this study corresponds to the 2.5 to 97.5 percentile of the sampled distribution. The analytical probability density functions were assumed lognormal for ORs for risk factors. For the QUANTEC parameter estimates, no simple parametric distribution matched with the reported asymmetric confidence intervals. The probability distributions were therefore approximated by one normal distribution matching the point estimate to the lower confidence bound and another normal distribution matching the point estimate to the upper confidence bound. The two distributions were then conjoined to form an approximation of the probability distribution of the parameter considered. For the prevalence estimates from the QUANTEC studies, only point values were used.
Validation in an independent patient cohort
The predictive values of the QUANTEC and individualized NTCP risk estimates were tested in a cohort of NSCLC patients treated in a single institution from 2007 to 2009 (details of this cohort are reported in a study currently in preparation). Patient records were reviewed retrospectively to evaluate the incidence and severity of RP as well as tumor recurrence and survival. Clinical factors – pulmonary co-morbidities, smoking status and history, age, type and scheduling of chemotherapy – were also recorded. RP was graded according to the CTCEA v. 3.0 radiation morbidity scoring scheme during the first year after RT by evaluation of CT scans and notes from follow-up visits. Time to RP was measured from the first day of RT treatment. Patients with RP below grade 3 were recorded as having not experienced RP, while patients with grade 3 and above were recorded as experiencing RP.
Radiation was primarily delivered as three- dimensional (3D) conformal RT. Dose distributions were calculated using an analytical anisotropic algorithm, and dose-volume histograms (DVHs) were extracted using CERR [Citation12]. Mean doses to the combined lungs minus the solid tumor (MLD) were calculated, and the predicted risk of RP from the QUANTEC estimate was computed using Equation 1. Patients were subsequently divided into two risk groups, based on NTCP above or below the cohort median. Additionally, individual risk estimates were calculated based on the method outlined above and these estimates provided for an alternative division into risk groups (again, above/below median NTCP).
Subdistribution cumulative incidence functions for RP were estimated in a competing risk analysis [Citation13], with competing failure causes being death from lung cancer, death from other (or unknown) causes, and local progression. Patients were stratified according to NTCP risk groups, and a test of difference of subdistributions across groups was conducted using a K-sample test by Gray [Citation14]. The concordance index (c-index) for risk groups as a predictor for RP was calculated using standard methods, but with time for all competing risk events set at tmax + 1 (i.e. beyond the maximum follow-up time, as suggested by Wolbers et al. [Citation15], since this ensured that patients experiencing a competing risk were kept ‘at risk’ for RP at all evaluated times). The c-index is defined as the proportion of evaluable patient pairs for which predictions and outcomes are concordant; i.e. the proportion of patient pairs for which higher risk prediction (comparing the two patients involved) corresponds to (earlier) experienced toxicity. A c-index of 0.5 corresponds to the null hypothesis, where the risk prediction is no better than a random allocation of patients. Additionally, the c-index for (continuous) NTCP as a predictor for RP was calculated. Both were tested for difference from 0.5. All analyses were performed using both the QUANTEC NTCP model and the individual risk estimate, taking clinical factors into account. C-indices for the two methods of NTCP calculation were tested for difference using a two-sided Student's t-test for dependent samples. Confidence intervals for the cumulative incidence functions were based on the variance of the point estimates, and approximated using the ln(-ln) transformation, as suggested by Choudhury [Citation16].
Survival analysis was conducted in R [Citation17], using the ‘cmprsk’ [Citation18] and ‘survcomp’ [Citation19] packages. NTCP calculation and confidence interval estimations were done in MATLAB® (2010b, The MathWorks Inc, Natick, MA) using customized functions.
Results
A summary of the prevalence of clinical risk factors in the patient cohorts included in the QUANTEC analysis can be found in . The mean age in the reported studies (65 years) can be compared to the mean age used as a cut-off point in the risk factor meta-analysis (63 years); for the sake of all subsequent analyses these were considered equal. Even though the studies included in the meta-analysis compared sequential chemotherapy with concomitant chemotherapy (rather than with no chemotherapy), patients receiving no chemotherapy were grouped with the ones receiving concomitant chemotherapy. For details of the individual studies, as well as further assumptions underlying the analysis, see Appendix A (available online at http://informahealthcare.com/doi/abs/10.3109/0284186X.2013.820341).
Table II. Summary of prevalence of clinical risk factors in the QUANTEC analysis.
Correcting the QUANTEC dose-response relationship for all six risk factors () resulted in an adjusted relationship between the MLD and the risk of RP described by the parameters
This baseline relationship is valid for a patient without any pulmonary co-morbidities, a tumor in the upper lobe, no history of smoking or current smoking habit, below 63 years old, and not treated with sequential chemotherapy. Note that there is a slight dependence of the result on the order that the corrections are carried out, since the correction method is not exact – however, it is on the order of < 0.1 Gy for D500 and < 0.05 for γ050.
Dose-response relationships for specific risk groups were constructed based on adjusted dose- response parameters, cf. Equations 5 and 6. compares the risk predictions for patients with the highest and the lowest risk of RP with the crude QUANTEC estimate. While the QUANTEC study suggested a constraint on the MLD of 19.8 Gy (in order to limit the risk of RP to below approx. 20%), optimal constrains, as estimated with the additional information from clinical risk factors, varied considerably between patients with highest and lowest number of risk factors. Patients currently smoking, with no risk factors (no pulmonary co-morbidities, no lower/middle tumor, below 63 years old, and no sequential chemotherapy) could potentially receive an MLD up to 27.8 Gy (95% CI 23.8, 32.5) without the predicted risk of RP exceeding 20%. However, the group of patients with the highest risk of RP (pulmonary co-morbidities, middle or lower tumor location, no history of smoking, above 63 years of age, and sequential chemotherapy) had an estimated dose-constrain of 7.0 Gy (0, 14.5) to yield the same risk of RP.
Figure 1. Relationships between the mean dose to the lungs and the risk of radiation pneumonitis. Solid line: Dose-response reported in the QUANTEC study [Citation1]. Dashed line: Estimated dose-response for a patient currently smoking, with no risk factors (no pulmonary co-morbidities, no lower/middle tumor, below 63 years old, and no sequential chemotherapy). Dotted line: Estimated dose-response for patients with highest risk (pulmonary co-morbidities, middle or lower tumor location, no history of smoking, above 63 years of age, and sequential chemotherapy). Appropriate constraints on the mean lung dose in order to ensure a < 20% complication rate are marked on the primary axis.
![Figure 1. Relationships between the mean dose to the lungs and the risk of radiation pneumonitis. Solid line: Dose-response reported in the QUANTEC study [Citation1]. Dashed line: Estimated dose-response for a patient currently smoking, with no risk factors (no pulmonary co-morbidities, no lower/middle tumor, below 63 years old, and no sequential chemotherapy). Dotted line: Estimated dose-response for patients with highest risk (pulmonary co-morbidities, middle or lower tumor location, no history of smoking, above 63 years of age, and sequential chemotherapy). Appropriate constraints on the mean lung dose in order to ensure a < 20% complication rate are marked on the primary axis.](/cms/asset/717ef8fb-4233-423b-b55e-4263175543ad/ionc_a_820341_f0001_b.jpg)
As a further example of the individualized dose-response curves for the risk of RP which can be constructed using this approach, consider an elderly patient (> 63 years old) with pulmonary co-morbidity, without any history of smoking, with an upper lung tumor and not receiving sequential chemotherapy. The relationship between the mean lung dose and the risk of RP is then described by
and the constraint on the MLD corresponding to a probability of ≤ 20% of getting RP is MLD ≤ 14.8 Gy (8.6, 20.9).
Validation in an independent patient cohort
A total of 103 patients were included in the validation dataset. Median prescribed dose was 60 Gy (range 59.5–70 Gy), and the median value of the mean physical dose to the lungs was 18.2 Gy (range 0.79–29.4 Gy). Prevalence of clinical risk factors can be found in , and the incidence of RP is reported in . The crude incidence of grade 2 and above RP was 35.9%, and of grade 3 and above RP 16.5%. Cumulative incidence curves for the four competing risks considered (RP grade 3 and above, local progression, death from lung cancer and death from other or unknown causes) are shown in . The estimated cumulative incidence of RP grade ≥ 3 one year after start of treatment was 15.5% (95% CI 9.3%, 23.2%) in this population.
Figure 2. Cumulative incidence functions for competing outcomes for patients in the validation cohort. Solid line: Radiation pneumonitis CTCAE v. 3.0 grade 3 or above. Dashed line: Local progression of lung cancer. Dotted line: Death from lung cancer. Dot-dashed line: Death from other (or unknown) cause.
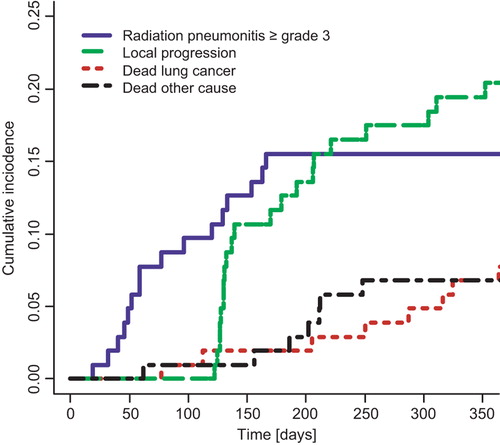
Table III. Patient characteristics in validation cohort.
Table IV. Crude incidence of radiation pneumonitis (as first event) in validation cohort.
Since no information on tumor location was available for these patients, an alternative baseline dose-response relationship valid without tumor location was estimated
This relationship is suitable for a patient without any pulmonary co-morbidities, no history of smoking or current smoking habit, below 63 years old, and not treated with sequential chemotherapy.
contains the estimated cumulative incidence curves for RP for risk groups (splitting the cohort above/below median NTCP risk) constructed using either the crude QUANTEC risk calculation () or the individualized risk estimate (). The test for difference of subdistributions between groups was not statistically significant using the QUANTEC estimate (p = 0.11), but was significant using the individual risk estimates (p = 0.006). For the QUANTEC estimate, the c-index for the risk groups was 0.69 (95% CI 0.46, 0.91, p = 0.10), while for NTCP as a continuous predictive parameter c-index = 0.62 (0.51, 0.73, p = 0.03). Using the individualized risk estimates, the c-index for risk groups was 0.83 (0.65, 1.00, p = 0.0003) and for the continuous NTCP values 0.63 (0.52, 0.74, p = 0.02). Comparison of the two NTCP calculation techniques (crude QUANTEC estimate and individualized risk estimate) showed a significant increase in the predictive value, as characterized by the c-index, by correcting for clinical factors, both for division into high/low-risk groups (p = 0.004) and for NTCP as a continuous variable (p = 0.04).
Figure 3. Cumulative incidence of radiation pneumonitis for high/low risk patients in the validation cohort: Subdistribution cumulative incidence functions for radiation pneumonitis CTCEA v. 3.0 grade 3 or above. Solid line: Patients with predicted normal tissue toxicity (NTCP) below or equal to the group median (low-risk patients). Dashed line: Patients with NTCP above the group median (high-risk patients). Shaded areas: 95% confidence intervals. a) NTCP calculated using the dose-only relationship from the QUANTEC analysis [Citation1]. Group median: 17.0%. b) NTCP calculated using the individualized risk estimate, with the QUANTEC model adjusted for the effects of clinical risk factors. Group median: 13.4%.
![Figure 3. Cumulative incidence of radiation pneumonitis for high/low risk patients in the validation cohort: Subdistribution cumulative incidence functions for radiation pneumonitis CTCEA v. 3.0 grade 3 or above. Solid line: Patients with predicted normal tissue toxicity (NTCP) below or equal to the group median (low-risk patients). Dashed line: Patients with NTCP above the group median (high-risk patients). Shaded areas: 95% confidence intervals. a) NTCP calculated using the dose-only relationship from the QUANTEC analysis [Citation1]. Group median: 17.0%. b) NTCP calculated using the individualized risk estimate, with the QUANTEC model adjusted for the effects of clinical risk factors. Group median: 13.4%.](/cms/asset/0d805a88-7858-4893-8124-4d1e616a3591/ionc_a_820341_f0003_b.jpg)
Discussion
We have demonstrated a method to calculate dose-response relationships for RP which takes clinical risk factors into account, and which is based entirely on data from large, published meta-analyses. The improved predictive power of this method compared to a dose-only approach has been illustrated in a single clinical cohort. The validation set used for testing the model is completely independent in the sense that no parameters have been fitted to the validation set; moreover the method can easily be accommodated to additional future identified risk factors. It allows for individualization of dose constraints and for individual risk estimation.
One limitation of the method is the dependence on the determination of the prevalence of risk factors in the patient cohorts underlying the dose-response relationship. Only a subset of the studies included in the QUANTEC analysis reported sufficient patient characteristics and treatment details; the present study had to assume that the studies reporting those details were representative for the remainder, and that no correlation existed with the radiation dose to the lung (inter- and intra-study). These are optimistic assumptions causing uncertainty in the prevalence estimation. Furthermore, an important model assumption is that the effects of the various risk factors (including dose) are independent, as required for multiplicative ORs. Unfortunately, even first order interactions between risk factors are hardly ever reported in the published literature. See [Citation4] for a detailed discussion of these of assumptions and other potential limitations of the OR estimates.
Including risk factors as ORs is only one out of several possible approaches to incorporating clinical risk factors in dose-response relationships. Our approach is equivalent to using the QUANTEC dose response model, but with the addition of a ‘risk factor equivalent dose’ to the dose variable, such that MLDrisk = MLD + ln(OR)D50/(4γ50). One alternative would have been to use ‘dose modifying factors’, included as multipliers to the dose variable [Citation6]. Current knowledge does not allow determination of which approach provides the best fit to data. However, a pragmatic first approximation is to keep the model linear in all parameters. Furthermore, our approach has the advantage of allowing the utilization of odds ratios as estimated using standard meta-analysis methodology.
Comparing clinical data from a validation cohort with the QUANTEC model predictions entail quantifications of dose metrics and toxicity data which are comparable to the ones employed in the studies underlying QUANTEC. This does not represent an unambiguous problem. For example, most (but not all) of the 10 studies used to derive the QUANTEC dose-response relationship reported the physical dose to the lung, without correcting for fraction-size effects. Therefore the DVHs in the present study were not corrected for fractionation. Furthermore, the definition of ‘symptomatic RP’ in the studies included in the QUANTEC analysis varied, with a number of grading systems and ‘cut-off’ grades used. We deemed CTCEA v. 3.0 grade 3 and above RP to be the closest to the ‘average cut-off’ grade, and hence patients with RP below grade 3 were recorded as having not experienced RP, while patients with grade 3 and above were recorded as experiencing RP.
The statistical method used for the calculation and reporting of the incidence of RP varied across studies as well. The majority of studies reported the crude incidences of RP during the follow-up period, usually around 6–12 months; some of those studies limited the analysis to patients with a minimum of follow-up (e.g. six months). Three studies used the Kaplan-Meier estimates for the incidence of RP. Consequently, there is not one uniform definition of ‘events’ and ‘subjects at risk’ that can be used for comparisons with the QUANTEC dose-response model. We chose to use survival data analysis for the validation study, as it provided us with the formalism and tools to make a self-consistent and informed choice on how to handle competing risks and define the subjects at risk. Tucker et al. [Citation20] have discussed the effects of variation in follow-up on the estimated RP incidence in more detail. In general, it can be discussed what consists the optimal actuarial method for reporting the rate of late toxicities [Citation21]. In this case, however, we believe that cumulative incidences are conceptually closest to the outcome data used for the QUANTEC model estimate. RP can then be considered one of several competing risks of failure for irradiated lung cancer patients; the others being death from lung cancer, or other causes, and local progression. Here, the latter was included as a competing risk, as local recurrence will usually prevent reliable detection of RP.
The correction for the effect of chemotherapy on the risk of toxicity is based on comparisons of sequential chemotherapy with platinum-based concomitant chemotherapy, in concordance with the results of the large individual patient data meta- analysis conducted by Aupérin et al. [Citation22]. However, a recent analysis of the risk of RP after chemoradiotherapy with concurrent chemotherapy in an international, multi-institutional dataset [Citation2] saw a considerable increased risk of toxicity with the use of carboplatin/paclitaxel combinations as compared to cisplatin/etoposide. Hence caution should be exercised when applying the results of the present study to modern, intensified chemoradiotherapy regimens.
More recent preclinical studies have shown an effect of irradiating the whole volume of the heart [Citation23]. Whether this effect plays a major role for typical clinical treatments remains uncertain [Citation24,Citation25]. However, such an effect could potentially contribute to the statistical association of RP with inferior tumor position, a factor that was included in our modeling.
The QUANTEC study reported the risk of RP as a function of the MLD, as no deviation of effective dose (Deff) from mean dose was found. While MLD appears as a simple and robust predictor, it is, however, not necessarily the correct one from a physiological point of view – it may merely act as a crude measure of treatment intensity. A number of recent studies have questioned whether MLD is actually the optimal dose metric to consider [Citation26,Citation27], but without reaching a consensus. The method presented here does not dependent on the dose metric, but can be employed irrespectively of the dose metric used in a dose response model.
The impact of clinical risk factors on the probability of RP after curative radiotherapy for lung cancer is a much-studied issue. However, a consistent quantification of the effect on the dose-response has proven challenging, partly because of the demands on data quantity and completeness required for a multivariate analysis taking all relevant factors into account. As an illustration of this problem, a logistic regression analysis including one dose and six clinical factors would, as a rule of thumb, require approximately 160 events and hence approximately 800 patients at an event probability of approximately 20%. The method presented here provides an alternative that allows for exploitation of already conducted studies and meta-analyses, such that already known clinical risk factors do not need to be re-fitted in each dose-response study. As a straightforward generalization of the method presented here, the known ORs of clinical risk factors can be applied to new dose-response studies, such that a dose-response model including clinical risk factors can be fitted without introducing more free parameters than a dose-only fit. Hopefully, such a strategy can improve the generalizability of results [Citation3].
In conclusion we have presented a method to combine a published dose-response function with known clinical risk factors and demonstrated that the predictive power of the combined model is greater than a dose-only model in an independent dataset.
http://informahealthcare.com/doi/abs/10.3109/0284186X.2013.820341
Download PDF (622.9 KB)Declaration of interest: The authors report no conflicts of interest. The authors alone are responsible for the content and writing of the paper.
ALA and IRV are supported by CIRRO – The Lundbeck Foundation Center for Interventional Research in Radiation Oncology and The Danish Council for Strategic Research. ALA acknowledges support from the Region of Southern Denmark. IRV is supported by the Global Excellence in Health program of the Capital Region of Denmark. SMB acknowledges support from the National Cancer Institute grant no. 2P30 CA 014520-34.
References
- Marks LB, Bentzen SM, Deasy JO, Kong FM, Bradley JD, Vogelius IS, et al. Radiation dose-volume effects in the lung. Int J Radiat Oncol Biol Phys 2010;76(3 Suppl):S70–6.
- Palma DA, Senan S, Tsujino K, Barriger RB, Rengan R, Moreno M, et al. Predicting radiation pneumonitis after chemoradiation therapy for lung cancer: an international individual patient data meta-analysis. Int J Radiat Oncol Biol Phys 2012;85:444–450.
- Bradley JD, Hope A, El Naqa I, Apte A, Lindsay PE, Bosch W, et al. A nomogram to predict radiation pneumonitis, derived from a combined analysis of RTOG 9311 and institutional data. Int J Radiat Oncol Biol Phys 2007;69:985–92.
- Vogelius IR, Bentzen SM. A literature-based meta-analysis of clinical risk factors for development of radiation induced pneumonitis. Acta Oncol 2012;51:975–83.
- Hope AJ, Lindsay PE, El Naqa I, Alaly JR, Vicic M, Bradley JD, et al. Modeling radiation pneumonitis risk with clinical, dosimetric, and spatial parameters. Int J Radiat Oncol Biol Phys 2006;65:112–24.
- Tucker SL, Liu HH, Liao Z, Wei X, Wang S, Jin H, et al. Analysis of radiation pneumonitis risk using a generalized Lyman model. Int J Radiat Oncol Biol Phys 2008;72:568–74.
- Tucker SL, Li M, Xu T, Gomez D, Yuan X, Yu J, et al. Incorporating single-nucleotide polymorphisms into the lyman model to improve prediction of radiation pneumonitis. Int J Radiat Oncol Biol Phys 2012;85:251–7.
- Stenmark MH, Cai XW, Shedden K, Hayman JA, Yuan S, Ritter T, et al. Combining physical and biologic parameters to predict radiation-induced lung toxicity in patients with non-small-cell lung cancer treated with definitive radiation therapy. Int J Radiat Oncol Biol Phys 2012; 84:e217–22.
- Barnett GC, Coles CE, Elliott RM, Baynes C, Luccarini C, Conroy D, et al. Independent validation of genes and polymorphisms reported to be associated with radiation toxicity: A prospective analysis study. Lancet Oncol 2012;13:65–77.
- Bentzen SM, Tucker SL. Quantifying the position and steepness of radiation dose-response curves. Int J Radiat Biol 1997;71:531–42.
- Appelt AL, Vogelius IR. A method to adjust radiation dose-response relationships for clinical risk factors. Radiother Oncol 2012;102:352–4.
- Deasy JO, Blanco AI, Clark VH. CERR: A computational environment for radiotherapy research. Med Phys 2003; 30:979–85.
- Putter H, Fiocco M, Geskus RB. Tutorial in biostatistics: Competing risks and multi-state models. Stat Med 2007; 26:2389–430.
- Gray RJ. A class of K-sample tests for comparing the cumulative incidence of a competing risk. Ann Stat 1988;16:1141–54.
- Wolbers M, Koller MT, Witteman JC, Steyerberg EW. Prognostic models with competing risks: Methods and application to coronary risk prediction. Epidemiology 2009; 20:555–61.
- Choudhury JB. Non-parametric confidence interval estimation for competing risks analysis: Application to contraceptive data. Stat Med 2002;21:1129–44.
- R Core Team. R: A language and environment for statistical computing. Vienna: R Foundation for Statistical Computing; 2012.
- Gray B. cmprsk: Subdistribution analysis of competing risks. R package version 2.2–2. Available from: http://CRAN. R-project.org/package = cmprsk
- Haibe-Kains B, Desmedt C, Sotiriou C, Bontempi G. A comparative study of survival models for breast cancer prognostication on microarray data: Does a single gene beat them all?Bioinformatics 2008;24:2200–8.
- Tucker SL, Jin H, Wei X, Wang S, Martel MK, Komaki R, et al. Impact of toxicity grade and scoring system on the relationship between mean lung dose and risk of radiation pneumonitis in a large cohort of patients with non-small cell lung cancer. Int J Radiat Oncol Biol Phys 2010;77:691–8.
- Bentzen SM, Vaeth M, Pedersen DE, Overgaard J. Why actuarial estimates should be used in reporting late normal-tissue effects of cancer treatment … now!. Int J Radiat Oncol Biol Phys 1995;32:1531–4; Discussion in: Int J Radiat Oncol Biol Phys 1995;32:1547, Int J Radiat Oncol Biol Phys 1996;35:197, Int J Radiat Oncol Biol Phys 1996;36:988–9.
- Aupérin A, Le Péchoux C, Rolland E, Curran WJ, Furuse K, Fournel P, et al. Meta-analysis of concomitant versus sequential radiochemotherapy in locally advanced non-small-cell lung cancer. J Clin Oncol 2010;28:2181–90.
- van Luijk P, Faber H, Meertens H, Schippers JM, Langendijk JA, Brandenburg S, et al. The impact of heart irradiation on dose-volume effects in the rat lung. Int J Radiat Oncol Biol Phys 2007;69:552–9.
- Huang EX, Hope AJ, Lindsay PE, Trovo M, El Naqa I, Deasy JO, et al. Heart irradiation as a risk factor for radiation pneumonitis. Acta Oncol 2011;50:51–60.
- Dang J, Li G, Ma L, Diao R, Zang S, Han C, et al. Predictors of grade ≥ 2 and grade ≥ 3 radiation pneumonitis in patients with locally advanced non-small cell lung cancer treated with three-dimensional conformal radiotherapy. Acta Oncol Epub 2012 Dec 3.
- Tucker SL, Mohan R, Liengsawangwong R, Martel MK, Liao Z. Predicting pneumonitis risk: A dosimetric alternative to mean lung dose. Int J Radiat Oncol Biol Phys 2013; 85:522–7.
- Liu F, Yorke ED, Belderbos JS, Borst GR, Rosenzweig KE, Lebesque JV, et al. Using generalized equivalent uniform dose atlases to combine and analyze prospective dosimetric and radiation pneumonitis data from 2 non-small cell lung cancer dose escalation protocols. Int J Radiat Oncol Biol Phys 2013;85:182–9.