
Abstract
Background. When evaluating late toxicity after combined external beam radiation therapy (EBRT) and high-dose rate brachytherapy (HDR BT) prostate cancer treatments, it is important that the composite dose distribution is taken into account. This can be challenging if organ-at-risk (OAR) dose data are incomplete, i.e. due to a limited ultrasound imaging field-of-view in the HDR BT procedure. This work proposes a method that provides estimates of composite OAR doses for such situations.
Material and methods. Original EBRT, simulated HDR BT, and composite dose-volume histograms (DVHs) for 10 pelvic OARs in 30 prostate cancer cases were used for method implementation and evaluation (EBRT: 25 × 2.0 Gy + BT: 2 × 10.0 Gy). The proposed method used information from the EBRT DVH to estimate OAR BT doses (with or without fractionation correction). Coefficients of determination (R2) were calculated for linear relationships between several EBRT DVH parameters and a BT DVH parameter of interest. The largest R2 value decided the relationship that best predicted the BT DVH parameter. The composite dose value was then calculated by adding the EBRT DVH and the estimated BT DVH parameter values and was compared to the reference composite value (in 1200 OAR/patient/parameter cases).
Results. The linear relationships had an average R2 of 0.68 (range 0.42–0.88). Only one ninth of the 1200 estimated composite DVH values differed more than 2 Gy from their reference values.
Conclusion. Given a successful implementation, the proposed method only requires original or simulated BT plan data for a subset of patients to estimate composite doses for large study populations in a time-efficient manner. This can assist in evaluating radiation-induced late toxicity in multimodality treatments with limited OAR dose data.
Understanding late radiation-induced toxicity is critical for treatments where patients are expected to live long after completed treatment since injuries can appear after many years. This knowledge depends on information from treatments given several years previously, but particularly dose information may be limited since treatment documentation can be incomplete. In addition, radiation therapy may have been delivered with different modalities making composite doses difficult to obtain. Together, this can hamper evaluations of late toxicities.
Localized prostate cancer is a disease with long life expectancy. Radiation therapy is frequently utilized for treatment with techniques such as external beam radiation therapy (EBRT) and high-dose rate brachytherapy (HDR BT) or combinations thereof [Citation1]. To understand late toxicity after prostate cancer radiation therapy, we ideally need the three-dimensional dose distribution for each relevant organ at risk (OAR). In practice, a dose distribution is summarized into a dose-volume histogram (DVH) where the spatial dose information is discarded to provide a condensed dose description. However, an HDR BT procedure is commonly based on ultrasound imaging with a limited field-of-view which often leads to incomplete image information and, subsequently, incomplete OAR dose distribution and DVH data. A method that can provide estimates of composite dose distributions could therefore assist in evaluations of radiation-induced late toxicity after combined EBRT and BT prostate cancer treatments with incomplete dose distribution data.
The purpose of this study was to propose a method to estimate composite OAR doses in combined EBRT and HDR BT prostate cancer treatments with limited BT dose distribution data. The proposed method requires original or simulated BT plan data for a limited number of patients to estimate composite doses for similarly treated patients. It is based on the assumption that DVH parameters in EBRT and BT can be related given that the same CTV is treated with consistent techniques and that the OAR configuration is similar between the two modalities. The proposed method was implemented and evaluated using dose distribution data for 10 pelvic OARs in 30 prostate cancer patients.
Material and methods
Patients and treatment
Since 1988, a combination of EBRT and HDR BT has been a treatment option for prostate cancer at the Sahlgrenska University Hospital in Göteborg, Sweden [Citation2]. To date, more than 1000 patients have been treated, typically with 50 Gy EBRT (25 × 2.0 Gy) and 20 Gy BT (2 × 10.0 Gy) during seven weeks. This combination of EBRT and HDR BT is used for method development in this work and is described in the following sections. Over the years different BT treatment planning systems (TPS) have been used, but since 2003 the EBRT and the BT TPSs have been within one system [Eclipse (various versions), Varian Medical Systems, Palo Alto, CA, USA].
Prior to treatment planning of EBRT, images were obtained using computed tomography (CT). The clinical target volume (CTV) was defined as the prostate gland. The planning target volume (PTV) was defined as the CTV with a 20 mm margin in all directions except posteriorly where the margin was 15 mm or maximum half of the rectal area. A three-field treatment technique was used with one anterior-posterior and two opposed lateral wedged individually shaped fields using 15 MV photons. The treatment was prescribed (100%) to the center of the PTV with the 95%-isodose encompassing the PTV and a maximum dose less than 105%. The dose calculation was performed using a pencil beam algorithm with heterogeneity correction.
BT was given in two sessions separated by two weeks and the procedure relied fully on ultrasound imaging. At each session, the patient was placed in lithotomy position and transversal images were captured using a rectal ultrasound probe. The CTV was defined as the entire prostate gland including the prostatic urethra and the PTV as the CTV with a margin of 2 mm (no margin cranially or caudally). The dose distribution was optimized by determining the needle positions and dwell times for the source within each needle with the objective to cover the PTV with the prescribed dose (100%) while keeping the dose in the urethra lower than 120%. The needles were inserted through a transperineal template (grid size 5 mm) using the live image of the ultrasound as guidance, and the typical number of needles was 14. The dose calculation was performed using the TG51 formalism [Citation3]. After removal of the ultrasound probe, the treatment was delivered with a high-dose rate 192Ir source (treatment time 5–15 minutes) and the needles were removed immediately after treatment.
Data collection for the present study
The data for this study are taken from a larger study investigating radiation-induced toxicity in prostate cancer survivors (n = 874) treated with primary or salvage EBRT, or a combination of EBRT and BT from 1993 to 2006 [Citation4]. In this larger study population, 10 different OARs (anal sphincter, rectum, sigmoid colon, the first 4 cm of the sigmoid colon, urinary bladder, pubic bone, right and left femoral heads, corpora cavernosa, and penile bulb) had been retrospectively delineated on the EBRT CT images without margins for movements or setup using the Eclipse TPS (version 8.6.15). Delineations were made by one research assistant following predefined guidelines and under supervision of an oncologist (DA) [Citation5]. From the 376 patients treated with the combination of EBRT and BT, we randomly sampled 30 patients (five from each of the years 2001–2006) treated with 50 Gy EBRT and 20 Gy HDR BT with all 10 OARs present.
For BT, the OARs were outside the ultrasound field-of-view and their dose distributions and DVHs could not be calculated from the available BT treatment documentation. For the 30 patients, one BT treatment plan was therefore simulated in the Eclipse TPS (version 10.0.39) according to the previously described BT criteria. Using each patient's respective EBRT CT images, an EBRT CTV was expanded 2 mm into a BT PTV and this volume was then covered with the BT prescription dose (20 Gy in 2 fractions). The needles were placed to match the shape of the BT PTV, similarly as in an actual BT procedure. For these simulated treatment plans, the median number of needles was 15 (range 11–17) and the needle spacing was 10–15 mm (corresponding to the 5 mm grid spacing in the transperineal template used at treatment).
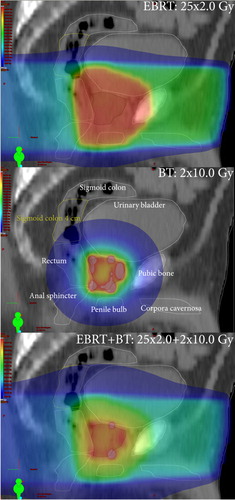
To obtain the total absorbed dose distribution (25 × 2.0 + 2 × 10.0 Gy), a plan sum was then created in the TPS and OAR DVHs for the treatment plans (original EBRT, simulated BT, and composite) were exported as text files using a dose bin interval of 0.5 Gy, in total 900 DVHs (30 patients × 3 treatment plans × 10 OARs). In the following, any DVH originating from the TPS is referred to as a reference DVH. We also obtained the total reference air kerma (TRAK) for each simulated BT plan [Citation6]. Example OAR delineations and dose distributions for one patient are shown in .
Figure 1. Absorbed dose distributions of 50 Gy external beam radiation therapy (EBRT, top panel), 20 Gy brachytherapy (BT, mid panel) and 70 Gy EBRT+ BT (bottom panel). In the colour wash, red corresponds to 100%, green to 50%, and blue to 25% of the prescribed dose, respectively (colour in online version only).
Method description
The purpose of the method is to estimate composite OAR doses in combined EBRT and BT when BT OAR image and dose information is missing. The rationale is that dose distributions (and thus DVHs) by EBRT and BT can be related if the same CTV is treated with consistent techniques and the OAR configuration is similar between the two modalities. It is an empirical method that is implemented in two steps. First, linear relationships between a relevant BT DVH parameter and various EBRT DVH parameters are derived. The strongest correlating relationship will be used to estimate the BT DVH parameter. Second, the method investigates if the composite DVH parameter value obtained by adding the EBRT value and this estimated BT value is of acceptable accuracy compared to the reference composite value. If so, the composite dose for a similarly treated population can be estimated using the determined linear relationships and the EBRT DVHs only.
The method can be used to estimate any DVH metric, but we judged the near maximum doses D2% and D2cc [Citation6–9] as well as the mean absorbed and mean fractionation-corrected dose to be of interest. These are common dose distribution parameters for evaluations of radiation-induced toxicity in general [Citation10]. In the following, the parameters rVD and aVD denotes the relative and absolute volume receiving at least dose D. The highest dose after excluding rv (in %) or av (in cm3) of volume receiving the highest dose are denoted Drv and Dav, respectively.
The first step of the method is to find relationships between the EBRT DVH and the BT DVH parameter in question. For each OAR, we did this by the following procedure (illustrated in ):
Figure 2. Illustration of the first step of the proposed method. In panel (a), the Drv’-EBRT value and the D-BT value are calculated for one patient. In panel (b), the squared Pearson's product-moment correlation coefficient (R2) is calculated for the Drv’-EBRT parameter values and the D-BT parameter values for all patients. This is repeated for all rvs and results in the R2-graph shown in panel (c). The maximum R2 now determines the rv* value and the linear equation that best predicts the D-BT parameter.
The sought BT-parameter value (D-BT) from each BT DVH was calculated.
Drv values from each EBRT DVH (Drv-EBRT) were calculated.
rVD values from each EBRT DVH (rVD-EBRT) were calculated.
The coefficients of determination (R2) for all linear relationships between Drv-EBRT and D-BT, and between rVD-EBRT and D-BT were calculated. In addition, the R2 between the BT TRAK and D-BT was calculated.
The linear equation with the highest R2 value was identified to determine the model and associated parameter (rv in Drv, D in rVD, or BT TRAK) that best predicted the BT DVH parameter value.
To determine the relationship for D2cm3, we used the same approach as above (steps 1–5) with the exception that absolute volume cumulative DVHs were used instead.
In the second step of the method, we obtained the composite DVH parameter value by adding the reference EBRT parameter value and the estimated BT parameter value. The validity of this addition was evaluated by comparing the estimated to the reference composite parameter values for the investigated near maximum and mean doses.
To take the fractionation effect into account, the reference EBRT DVH and the reference BT DVH were converted into equieffective 2-Gy fractions (EQD23) using the Linear quadratic (LQ) model with α/β = 3 Gy for late effects [Citation11]. The two mean fractionation-corrected doses were calculated over all bins of the respective DVH. A fractionation-corrected composite parameter value was obtained by adding the fractionation-corrected EBRT value and the fractionation-corrected BT value.
Statistical analyses
For each BT DVH parameter in the first step of the method, the mean difference between the simulated and the reference values and their standard deviations was calculated. The R2 was calculated as the squared Pearson product-moment correlation coefficient (R2) to find the strongest correlating linear relationship between the EBRT DVH and each BT DVH parameter. We regarded an R2 value above 0.5 to indicate a useful relationship. All dose differences were calculated by patient and not by group. Calculations were performed in MATLAB 7.6.0 (R2008a, The MathWorks Inc., Natick, MA, USA).
Results
The reference DVHs for the subset of patients were used to calculate mean value and standard deviation for each combination of investigated BT DVH parameter and OAR, and Supplementary Table I (available online at http://informahealthcare.com/doi/abs/10.3109/0284186X.2013.870669). Due to variations in patients’ anatomies, the near maximum doses and the mean doses varied substantially both within and between the different OARs.
Table I. Reference dose-volume histogram parameter values for selected organs at risk in the 30 investigated prostate cancer patients.
The model and associated parameter (rv in Drv, D in rVD, or BT TRAK) that best predicted the linear relationship for each combination of OAR and BT parameter (n = 40) are given in and Supplementary Table II (available online at http://informahealthcare.com/doi/abs/10.3109/0284186X.2013.870669). The average R2 for all combinations of OAR and BT parameter was 0.68 ± 0.11 (range 0.42–0.88) and 38/40 of all R2 were larger than 0.5. Overall, the mean absorbed dose parameter correlated most strongly among the investigated BT parameters. The sigmoid had the highest R2 for each of the four investigated parameters. The BT TRAK resulted in higher R2 values than the EBRT DVH parameters for the femoral heads only.
Table II. Step one in the method: the model and associated parameter (cut-off) that best predicted the linear relationship for each combination of organ at risk and sought brachytherapy parameter and its corresponding squared Pearson's product-moment correlation coefficient (R2) for selected organs at risk.
For each OAR and BT DVH parameter, the mean and standard deviation for the difference between the estimated values and their reference values are given in and Supplementary Table III (available online at http://informahealthcare. com/doi/abs/10.3109/0284186X.2013.870669). The mean differences for the 2 × 10.0 BT dose parameter values are zero due to the properties of the R2 determination. A small standard deviation reflects a precise parameter estimate in terms of absolute dose. A larger BT DVH parameter standard deviation occurred when (parts of) the OAR was close to the prostate gland. For the 1200 estimated BT DVH parameter values, 396 (142) deviated more than 1 Gy (2 Gy) from its reference value (data not shown). For the composite parameter values, the mean differences and their standard deviations for the near maximum doses were close to zero, i.e. the highest OAR doses from EBRT and BT were in the same location.
Table III. Differences between the estimated and reference dose-volume histogram parameter values for selected organs at risk.
Discussion
To assist in evaluations of late toxicity after combined EBRT and BT prostate cancer treatments with limited BT imaging information, we propose a method to estimate OAR BT dose contributions and composite OAR doses. The suggested method is based on the rationale that DVH parameters in EBRT and BT can be related given that the same CTV is treated with consistent techniques and that the OAR configuration is similar between the two modalities. Only one ninth of the 1200 investigated estimated composite DVH values deviated more than 2 Gy from their respective reference value.
Our method can be helpful in evaluating radiation-induced toxicity in combined EBRT and BT treatments when long-term follow-up data are available but sufficient information about the given BT OAR dose distributions is missing. It is a time- efficient method that, once the relationships have been established using a subset of patients, can be used to estimate composite doses for the remaining study population without having to reconstruct each BT treatment plan. We choose to investigate a linear relationship for our data, but other relationships can potentially be more suitable in other situations and may need to be investigated. Our approach adds to previously suggested methods concerning treatments with limited image and dose information, e.g. [Citation12–14], by also providing estimates when more than one treatment modality is used. Retrospective analyses of radiation therapy, particularly in studies with longer follow-up, are often hampered by limited image information. One such example is historically treated breast cancers where there is a great interest in estimating (fractionation-corrected) heart doses to derive dose-response relationships for excess risk of heart disease after various radiation treatment regimens [Citation15]. In our dataset, estimated composite doses of acceptable accuracy were obtained in most of the OAR and BT parameter combinations. It could be argued that it would have been easier to use the EBRT DVH to estimate the composite parameter value of interest directly. However, using a two-step approach as described in this work has some advantages over the direct approach. If mean absorbed dose or Dv are of interest, a derived relationship will be valid for prescription doses different from those used to determine the relationship. Furthermore, for Dv, different fractionation correction model parameter values (or different fractionation correction models) can be applied before addition without the need to re-estimate the relationship. A high R2 value by the two-step approach will however not guarantee that the sum of Dv from EBRT and the estimated Dv from BT is a useful estimate of the composite Dv. This must be separately verified.
In a target population, the accuracy of the OAR BT dose contribution estimated by this method depends on a suitable subset of patients for method implementation, how well the true organ configuration for each treatment modality is represented and the strength of the derived relationship (R2). BT dose distributions of the urinary bladder and of the rectum have been previously investigated [Citation16–18]. Our estimated BT dose contributions are of the same magnitude, both for the urinary bladder and the rectum, but it is obvious that the OAR definitions will particularly impact the high-dose region (i.e. aV100%). The OARs close to the prostate gland are located within a region with a steep dose gradient and will also be subject to a high BT dose. An inaccurate estimation can in this case introduce a large error in terms of absolute dose and may be more critical for the accuracy of the estimated composite doses. However, OARs far from the PTV are located within a region with a shallow dose gradient and will also receive a small BT dose. A somewhat inaccurate estimation of this small dose contribution may not be critical.
A similarity between the patients’ OAR and prostate gland configurations at both treatments will be favorable for the accuracy of the estimated composite doses even if useful correlations may be present also when organ displacement between EBRT and BT has occurred. The effect of organ displacement on the composite dose estimates was, however, not possible to address in this work due to the lack of BT image information, but the linear relationships may be different and the R2s can be expected to be smaller. To accumulate dose optimally in the presence of organ displacement between treatment modalities (and fractions), we will need to use voxel-tracking methods [Citation19].
In conclusion, when evaluating very late radiation-induced toxicity in combined EBRT and BT, it is important that the composite dose distribution is acknowledged, but obtaining a DVH can be challenging. In this work, a method to estimate composite doses is suggested for situations with limited or absent BT data in prostate cancer radiotherapy. We are now approaching a situation where commercially available TPSs can be used to calculate DVHs for the fractionation-corrected dose distribution in (multimodality) radiation therapy [Citation20]. Together with complete OAR 3D images, these will enable us to add dose distributions from different modalities in a correct way. This will lead to more suitable data for the modeling of radiation-induced toxicity after EBRT and BT prostate cancer treatments than the estimations proposed in this work. However, if high-quality toxicity data is available, but there is limited or missing BT data, modelling of radiation-induced toxicity is impossible without using approximations of the given dose. Our suggested method, or other approaches to estimate composite doses, is a pragmatic approach to make use of available data to advance our understanding of radiation-induced late toxicity. Although it was proposed for the combination of EBRT and HDR BT for prostate cancer, we see no reason why its principles cannot be applied to other treatment modality combinations or cancer diagnoses.
Supplementary Tables I–III
Download PDF (44 KB)Declaration of interest: The authors report no conflicts of interest. The authors alone are responsible for the content and writing of the paper.
References
- Hoskin PJ, Colombo A, Henry A, Niehoff P, Paulsen Hellebust T, Siebert FA, et al. GEC/ESTRO recommendations on high dose rate afterloading brachytherapy for localised prostate cancer: An update. Radiother Oncol 2013;107:325–32.
- Borghede G, Hedelin H, Holmang S, Johansson KA, Sernbo G, Mercke C. Irradiation of localized prostatic carcinoma with a combination of high dose rate iridium-192 brachytherapy and external beam radiotherapy with three target definitions and dose levels inside the prostate gland. Radiother Oncol 1997;44:245–50.
- Rivard MJ, Coursey BM, DeWerd LA, Hanson WF, Huq MS, Ibbott GS, et al. Update of AAPM task group no. 43 report: A revised AAPM protocol for brachytherapy dose calculations. Med Phys 2004;31:633–74.
- Alsadius D, Hedelin M, Johansson KA, Pettersson N, Wilderang U, Lundstedt D, et al. Tobacco smoking and long-lasting symptoms from the bowel and the anal-sphincter region after radiotherapy for prostate cancer. Radiother Oncol 2011;101:495–501.
- Waldenstrom AC, Alsadius D, Pettersson N, Johansson KA, Holmberg E, Steineck G, et al. Variation in position and volume of organs at risk in the small pelvis. Acta Oncol 2010;49:491–9.
- ICRU Report 58, Dose and volume specification for reporting interstitial brachytherapy. Bethesda, MD: International Commission on Radiation Units and Measurements; 1997.
- ICRU Report 83, Prescribing, recording, and reporting photon beam intensity-modulated radiation therapy (IMRT). Bethesda, MD: International Commission on Radiation Units and Measurements; 2010.
- Kovacs G, Potter R, Loch T, Hammer J, Kolkman-Deurloo IK, de la Rosette JJ, et al. GEC/ESTRO-EAU recommendations on temporary brachytherapy using stepping sources for localised prostate cancer. Radiother Oncol 2005;74:137–48.
- Potter R, Haie-Meder C, Van Limbergen E, Barillot I, De Brabandere M, Dimopoulos J, et al. Recommendations from gynaecological (GYN) GEC ESTRO working group (II): Concepts and terms in 3D image-based treatment planning in cervix cancer brachytherapy-3D dose volume parameters and aspects of 3D image-based anatomy, radiation physics, radiobiology. Radiother Oncol 2006;78:67–77.
- Marks LB, Yorke ED, Jackson A, Ten Haken RK, Constine LS, Eisbruch A, et al. Use of normal tissue complication probability models in the clinic. Int J Radiat Oncol Biol Phys 2010;76(3 Suppl):S10–9.
- Bentzen SM, Dorr W, Gahbauer R, Howell RW, Joiner MC, Jones B, et al. Bioeffect modeling and equieffective dose concepts in radiation oncology – terminology, quantities and units. Radiother Oncol 2012;105:266–8.
- Das IJ, Andrews JZ, Cao M, Johnstone PA. Correlation of 2D parameters to lung and heart dose-volume in radiation treatment of breast cancer. Acta Oncol 2013;52:178–83.
- Ng A, Brock KK, Sharpe MB, Moseley JL, Craig T, Hodgson DC. Individualized 3D reconstruction of normal tissue dose for patients with long-term follow-up: A step toward understanding dose risk for late toxicity. Int J Radiat Oncol Biol Phys 2012;84:e557–63.
- Teh AY, Park EJ, Shen L, Chung HT. Three-dimensional volumetric analysis of irradiated lung with adjuvant breast irradiation. Int J Radiat Oncol Biol Phys 2009;75: 1309–15.
- Taylor CW, Nisbet A, McGale P, Darby SC. Cardiac exposures in breast cancer radiotherapy: 1950s–1990s. Int J Radiat Oncol Biol Phys 2007;69:1484–95.
- Hsu IC, Pickett B, Shinohara K, Krieg R, Roach M, 3rd, Phillips T. Normal tissue dosimetric comparison between HDR prostate implant boost and conformal external beam radiotherapy boost: Potential for dose escalation. Int J Radiat Oncol Biol Phys 2000;46:851–8.
- Lachance B, Beliveau-Nadeau D, Lessard E, Chretien M, Hsu IC, Pouliot J, et al. Early clinical experience with anatomy-based inverse planning dose optimization for high-dose-rate boost of the prostate. Int J Radiat Oncol Biol Phys 2002;54:86–100.
- Pouliot J, Kim Y, Lessard E, Hsu IC, Vigneron DB, Kurhanewicz J. Inverse planning for HDR prostate brachytherapy used to boost dominant intraprostatic lesions defined by magnetic resonance spectroscopy imaging. Int J Radiat Oncol Biol Phys 2004;59:1196–207.
- Jaffray DA, Lindsay PE, Brock KK, Deasy JO, Tome WA. Accurate accumulation of dose for improved understanding of radiation effects in normal tissue. Int J Radiat Oncol Biol Phys 2010;76(3 Suppl):S135–9.
- Allen Li X, Alber M, Deasy JO, Jackson A, Ken Jee KW, Marks LB, et al. The use and QA of biologically related models for treatment planning: Short report of the TG-166 of the therapy physics committee of the AAPM. Med Phys 2012;39:1386–409.