
Abstract
Background. Methods to accurately accumulate doses in radiotherapy (RT) are important for tumour and normal tissues being influenced by geometric uncertainties. The purpose of this study was to investigate a pre-release deformable image registration (DIR)-based dose accumulation application, in the setting of prostate RT.
Material and methods. Initially accumulated bladder and prostate doses were assessed (based on 8–9 repeat CT scans/patient) for nine prostate cancer patients using an intensity-based DIR and dose accumulation algorithm as provided by the Dynamic Adaptive Radiation Therapy (DART) software. The accumulated bladder and prostate dose-volume histograms (DVHs) were compared on a range of parameters (paired Wilcoxon signed-rank test, 5% significance level) to DVHs derived using an in-house developed dose accumulation method based on biomechanical, contour-driven DIR (SurfaceRegistration). Finally, both these accumulated dose distributions were compared to the ‘static’ DVH, assessed from the planning CT.
Results. Over the population, doses accumulated with DART were overall lower than those from SurfaceRegistration (p < 0.05: D2%, gEUD and NTCP (bladder); Dmin (prostate)). The magnitude of these differences peaked for the bladder gEUD with a population median of 47 Gy for DART versus 57 Gy for SurfaceRegistration. Across the ten bladder dose/volume parameters investigated, the most pronounced individual differences were observed between the ‘accumulated’ DVHs and the ‘static’ DVHs, with deviations in mean dose up to 22 Gy.
Conclusion. Substantial and significant differences were observed in the dose distributions between the two investigated DIR-based dose accumulation applications. The most pronounced individual differences were seen for the bladder and relative to the planned dose distribution, encouraging the use of repeat imaging data in RT planning and evaluation for this organ.
Methods to accumulate doses precisely are important for all radiotherapy (RT) tumours and organs at risk (ORs) that are subject to geometric uncertainties [Citation1–3], particularly within strategies aiming for treatment adaptation. Dose accumulation typically requires voxel tracking through rigid and/or deformable image registration (DIR) of repeat volumetric images [Citation3]. Assessing the delivered doses obtained from dose accumulation may improve the accuracy in delivering the prescribed dose to the tumour [Citation1–3] as well as the predictive value of outcome models for tumour control and normal tissue morbidity, both usually based on a ‘snapshot’ of the dose distribution calculated on the planning computed tomography (pCT) scan [Citation2–5]. The associations between dose-volume histogram (DVH) parameters for ORs in the pelvis and morbidity are generally weak, in particular for urinary morbidity [Citation6]. The substantial motion observed for the bladder during a course of RT, usually caused by variations in the amount of urine within the bladder, leads to a ‘blurring’ of the DVH, which may conceal the dose/volume response relationships for this organ [Citation1,Citation5,Citation6]. For this reason, DIR-based dose accumulation methods are being developed and explored, however, performance evaluation of such methods is essential prior to clinical implementation.
In this study we have therefore investigated the performance of a pre-release DIR-based dose accumulation application in the setting of prostate cancer, investigating the accumulated bladder and prostate doses. The performance of this dose accumulation approach was compared to: 1) an in-house developed biomechanical contour-based DIR and dose accumulation application; 2) the doses obtained from crude dose summation; and finally, 3) the planned DVH.
Material and methods
Treatment planning
For nine patients previously treated with intensity-modulated RT (IMRT) for prostate cancer, 8–9 computed tomography (CT) scans were acquired during the course of RT [Citation7]. The pCT and the subsequent scans (slice thickness: 2–3 mm, resolution: 512 × 512 pixels, in-slice resolution: 0.88 × 0.88 mm2) were acquired in supine position, from the pelvis to L4. No bladder preparation protocol was applied in relation to any of the image acquisitions.
For the purpose of the current study, a radiation oncologist manually delineated the clinical target volume (CTV, the prostate gland) and the bladder (from the dome to the apex) in all pCT and repeat CT scans. The planning target volume (PTV) was generated by volume expansion of 9/7 mm in cranio-caudal/transversal directions to the CTV. Each patient was re-planned and re-calculated with volumetric modulated arc therapy (RapidArc, Eclipse v.10.0, Varian Medical Systems, Palo Alto, Inc., CA, USA) using 15 MV photons and a 120-leaf Millennium multileaf collimator, applying the Analytic Anisotropic Algorithm for the dose calculations. The dose was prescribed as a mean dose of 78 Gy to the PTV delivered in 39 fractions following the institutional clinical protocol for RT of localised prostate cancer. The pCT was rigidly registered (translations only) to each of the repeat scans by means of intra-prostatic fiducial markers (2–3 fiducials/patient) followed by a new dose calculation maintaining the number of monitor units, simulating our clinical image-guidance procedure [Citation8].
Intensity-based dose accumulation in DART™
The pCT and the re-calculated plans were imported into the Dynamic Adaptive Radiation Therapy application (DART™, Varian Medical Systems), a non-clinical research tool. The in-built DIR was a modified Demons algorithm constrained by intensity differences for the specified registration field-of-view (FOV) [Citation9]. A more extensive description of this algorithm and its application for contour-propagation purposes for CT-to-CT and CT-to-cone beam CT registrations is found in [Citation10] and [Citation11]. The planned dose distributions were re-calculated on the repeat scans following the rigid intra-prostatic fiducial marker-based registrations. A subsequent DIR was performed between the pCT and each of the repeat scans with all concerned organs included in the FOV. Altogether 78 DIRs were performed. The dose distributions were then deformed back to the pCT using this CT scan as frame for the dose accumulation. The dose bins in the resulting total dose distribution were scaled to the total number of fractions (39) divided by the number of repeat scans (n = 8–9). Finally, the pCT contours were propagated onto each of the repeat CT scans in order to evaluate the volumetric performance of the DIR [Citation10, Citation11] (see section DVH Comparisons for a more detailed description of this evaluation).
Comparison with biomechanical-based dose accumulation
An in-house developed biomechanical dose accumulation application (SurfaceRegistration), developed [Citation12] and tested [Citation12,Citation13] specifically for sphere-like volumes, such as the bladder, was used for comparison of the accumulated doses from DART. SurfaceRegistration is a contour-based application where each organ is represented by a triangular surface mesh and where points are being connected by massless springs. When springs are stretched/contracted, a spring force proportional to the change in length is generated. In the mapping between two organs, the vertices of one organ surface mesh are distributed over the surface of the other organ in a way that minimises the potential energy of a spring mass-system. The surface-point-to-surface-point mapping is established through a two-dimensional (2D) spherical space of the organ surface [Citation12]. As in the procedure in DART, the pCT was registered to each of the repeat scans using the pCT as frame for the dose accumulation. The organ surface displacements were interpolated into the organ volume using radial basis functions [Citation12]. The establishment of point mapping was assumed to be valid also for the reasonably spherical prostate and we therefore also compared the accumulated prostate doses between DART and SurfaceRegistration. For the bladder, three anatomical bladder landmarks (the bladder tissue connected to the ureters and urethra) delineated on the repeat scans additionally guided the DIR. A more detailed description of the SurfaceRegistration features is found in [Citation12] and [Citation13].
Dose summation
From the re-calculated DVHs, following the registrations being based on the fiducial markers, one summed DVH was derived for each patient [Citation14]. This summed DVH was obtained without DIR, by averaging across the DVHs available for each patient utilising the Dv parameters [Citation15] scaled to the number of CT scans available for each patient (n = 8–9), hereafter denoted as ‘Manual summation’ (Equation 1):
DVH comparisons
Since the dose-response relationship for the bladder is far from established [Citation5,Citation6], we extracted a range of dose/volume parameters (ten in total) and compared these between DART, SurfaceRegistration, the manual summations and the planned DVH: D2%, D20%, D33%, D66%, D98%, Dmean, V40Gy and V70Gy. Additionally the generalised equivalent uniform dose (gEUD) [Citation16], using k = 8 [Citation17,Citation18] as value for the volume dependence parameter, as well as the normal tissue complication probability (NTCP) were calculated [Citation19–21]. The dose/volume parameters and the gEUD- and NTCP-values were compared using a Wilcoxon signed-rank test with the hypothesis of no difference in median values (significance level: p ≤ 0.05). All statistical analyses were performed in STATA (STATA v.11, StataCorp LP, College Station, TX, USA).
The Dice similarity coefficient (DSC) [Citation22], calculated between the previously described propagated DIR-based DART contours (Vprop) and the manually delineated contours (Vman), was used to evaluate the accumulated DVHs from DART relative to the contour-based accumulated DVHs from SurfaceRegistration, focusing on the DIR performance in DART (Equation 2):
The DSC ranges from zero to one where a higher value indicates a larger volume overlap. In this study a median DSC of 0.9 was used as threshold to quantify the DIR performance, comparing patients with a median DSC < 0.9 versus ≥ 0.9.
For the prostate (CTV) the accumulated doses from DART were compared to those from SurfaceRegistration and from the manual summations quantified by the two CTV treatment planning criteria at our institution: the minimum dose (Dmin) and D99.5%. These parameters were compared using a Wilcoxon signed-rank test with the hypothesis of no difference in median Dmin and median D99.5% between the investigated dose distributions. The planning criteria for Dmin and D99.5% (i.e. Dmin ≥ 94% and D99.5% ≥ 95%) were used to quantify any violations of these parameters using either DART or SurfaceRegistration. The doses accumulated with DART were compared to those from SurfaceRegistration based on the classification of the DIR performance in DART (using the median DSC < 0.9 vs. ≥ 0.9 threshold).
Results
Among all bladder dose comparisons the most pronounced systematic and significant differences (p ≤ 0.05) over the population were seen between the dose/volume parameters from DART and the corresponding parameters from both SurfaceRegistration and the manual summations, with the doses from DART being generally lower (; and ; Supplementary Figure 1, available online at http://informahealthcare.com/doi/abs/10.3109/0284186X.2014.928742). Comparing DART and SurfaceRegistration, the largest population median (range) difference was −12 (−23–−5.1) Gy for gEUD (; ). Smaller, yet significant, differences were observed also between the manual summations and SurfaceRegistration, the former doses being significantly lower for near minimum doses while significantly higher for the intermediate- and the high-dose region (; Supplementary Figure 1 available online at http://informahealthcare.com/doi/abs/10.3109/0284186X.2014.928742). Across the ten dose/volume parameters, the individual differences peaked when comparing the repeat image-based dose distributions to the planned DVH with, e.g. the planned D20% deviating up to 22 Gy, 33 Gy and 36 Gy relative to the D20% assessed from DART, the manual summations and SurfaceRegistration, respectively (Supplementary Figure 1 available online at http://informahealthcare.com/doi/abs/10.3109/0284186X.2014.928742).
Figure 1. The bladder DVHs from DART (green), SurfaceRegistration (magenta) and the manual summations (red) for one patient with a median DSC > 0.9 (left; Patient 8: DSC = 0.93 (0.90–0.95)) and one patient with a median DSC < 0.9 (right; Patient 2: 0.87 (0.71–0.93)). The planned DVH (black) is included as well.
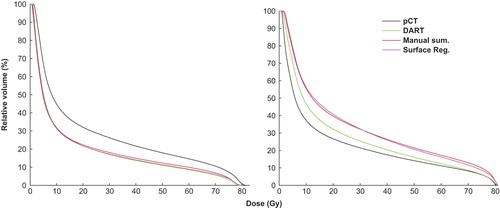
Figure 2. Upper panel: Individual differences for one of the two bladder dose/volume parameters (gEUD (Gy)) where significant differences were obtained between DART and all compared dose distributions. The comparison between SurfaceRegistration and manual summations, also relative to the planned DVH, is included as well. Lower panel: For the prostate, the individual distributions are given for DART and SurfaceRegistration Dmin (Gy), the parameter being significantly different between DART and SurfaceRegistration and between DART and the manual summations. The treatment-planning criterion (Dmin ≥ 94%) is indicated by the red dotted line (i.e. bars below this line refers to not fulfilling this criterion).
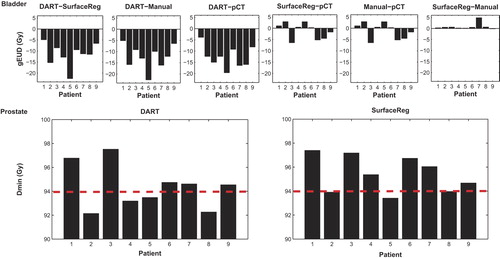
Table I. Population median (range) dose/volume data from DART, SurfaceRegistration, the manual summations (bladder and prostate) and the pCT (bladder). Significant p-values (Wilcoxon signed-rank test) are given for the comparisons a: DART vs. SurfaceRegistration; b: DART vs. Manual summations; c: DART vs. pCT and d: SurfaceRegistration vs. Manual summations. Note: No significant differences were established between the planned DVH and SurfaceRegistration or between the planned DVH and the Manual summations.
Across the population, the median bladder DSC ranged from 0.80 to 0.94, with four patients having a median DSC ≥ 0.9 (0.93–0.94) and five patients a median DSC < 0.9 (0.80–0.88). For all ten investigated dose/volume parameters, the differences between DART and SurfaceRegistration (again with the doses from DART being lower) was much more pronounced for the patients with DSC < 0.9 as compared to the patients with a DSC ≥ 0.9 (where in addition no systematic differences were established). For instance, the median difference in gEUD was −13 (−22–−8.5) Gy as compared to −8.9 (−11–−4.9) Gy (p ≤ 0.05 for DSC < 0.9 only).
In analogy to the bladder, the prostate doses were lower in DART than in SurfaceRegistration but significantly lower (p ≤ 0.05) for Dmin only (difference in population median: ∼1 Gy) (). Individual differences > 2 Gy were seen. Differences between DART and SurfaceRegistration were also found when comparing the dose/volume parameters to the planning criteria with a larger number of patients having lower Dmin and D99.5% values than the planning criteria according to accumulations in DART compared to SurfaceRegistration (; Supplementary Figure 2, available online at http://informahealthcare.com/doi/abs/10.3109/0284186X.2014.928742). The prostate doses were significantly lower in DART compared to the doses from the manual summations as well as to the doses obtained from SurfaceRegistration. No significant differences were established between the doses from the manual summations and SurfaceRegistration ().
The median prostate DSC ranged from 0.83 to 0.92 across the patients. Two patients had a median DSC ≥ 0.9 (0.90, 0.92) and seven patients a median DSC < 0.9 (0.83–0.89). Comparing the dose distributions between DART and SurfaceRegistration using this DSC cut-off, the pattern of the former dose distributions being lower than the latter was, similarly as observed for the bladder, more pronounced for patients with a median DSC < 0.9 with the median difference in Dmin (p ≤ 0.05 for DSC < 0.9 only) being −1.7 (−2.2–0.1) Gy as compared to −0.1 (−0.6–0.3) Gy.
Discussion
In this study we have documented considerable differences between accumulated bladder and prostate doses obtained from the pre-release intensity-based DART application versus accumulations from the in-house developed contour-based biomechanical Surface Registration, with the doses from DART being generally lower. This was most pronounced for the bladder and mainly for patients having less precise DIRs in DART for this organ.
Independent of the approach used to accumulate dose, the most pronounced differences across all compared dose distributions were observed between the planned DVH and any of the three accumulation/summation approaches (including repeat imaging data), although significantly (p ≤ 0.05) lower doses were obtained only with DART for the bladder gEUD and NTCP values. Hatton et al. [Citation1] previously compared planned and summed bladder DVHs and found that the summed bladder DVHs were higher than the doses predicted from the planned DVH and significant differences were established for the three selected parameters (V40Gy, V60Gy and V70Gy) for the majority of the patients. In contrast to that study no bladder preparation protocol was applied for the patients in the present study, and the bladder volume thus varied throughout the treatment course. This likely induces additional uncertainties to the bladder DVHs and may explain why no systematic difference was observed between DVH summation and the planned DVH for V40Gy and V70Gy. In order to establish biologically relevant bladder dose- response relationships, however, the bladder wall and/or the urethra should instead likely be used [Citation5–7,Citation23] and might be further improved by use of a spatial representation of the dose distribution [Citation24].
Using the same gEUD endpoint as in this study, Hysing et al. [Citation17] demonstrated a mean ratio of unity between the summed and the planned bladder gEUD (range 0.98–1.04). In our study the ratio between the bladder gEUD values from the manual summations or SurfaceRegistration and the planned gEUD were in the same range (0.91–1.06 and 0.90–1.05) whereas the ratio between the gEUD values from DART and the planned gEUD was greatly different (0.69–0.93).
Hatton et al. [Citation1] also investigated the dose coverage (95% and 98% isodose lines) of the prostate and found that for one third of the patients, dose coverage was not achieved when assessed with the summed prostate DVHs. This was explained by large prostate volume variations in the pCT compared to those in the repeat scans. Considerable prostate volume variations were observed also in this study (population range of manually delineated volumes in repeat scans/volume in pCT (VpCT): 0.84–1.35; population range of propagated DART volumes/VpCT: 0.85–1.07) and the Dmin planning criterion (Dmin ≥ 94%)) was violated to a larger extent for the four patients not fulfilling it based on Dmin from DART (0.5–1.8%) as compared to the three patients based on Dmin from SurfaceRegistration (0.02–0.6%).
Even though we were unable to establish systematic differences between the planned DVH and the DVHs from the accumulations/summation across the population, very large differences were seen in individual patients particularly when large bladder deformations were presented. In a previous investigation from our institution [Citation13] no systematic differences were seen between the dose/volume parameters from the initial treatment plan and contour-based DIR dose accumulation. As in this study, however, substantial differences were seen in individual patients, e.g. for V70Gy the deviations ranged from −6 to 10 percentage points and over- and underestimation of the planned bladder doses were explained to depend on the bladder volume on the pCT [Citation13]. This could be seen in the light that associations between bladder DVH parameters and urinary morbidity after RT for prostate cancer have in general been difficult to establish. Associations between rectal morbidity and rectum DVH parameters have been reported far more often, although the debate whether it is the intermediate or the high dose levels being the most predictive for this endpoint is still ongoing [Citation5,Citation6]. For both organs the vast majority still build their predictions on a snapshot of the dose distribution [Citation2,Citation5,Citation6,Citation23], which probably prohibits the establishment of reproducible estimates [Citation5,Citation6,Citation23]. Different associations with late rectal morbidity using simulated motion-inclusive rectum DVHs as compared to using static DVHs have previously been suggested [Citation25,Citation26] and individually assessed rectal dose/volume parameters, obtained from manually summed dose distributions, have been shown to be associated with rectal morbidity [Citation27]. This would advocate that organ motion during RT influences prediction of normal tissue morbidity [Citation27] and motivates forthcoming studies to investigate the associations between rectal/urinary morbidity and individually assessed motion-inclusive DVHs [Citation2,Citation6].
This study has also demonstrated that the dose distributions from the two contour-based accumulation/summation approaches (i.e. SurfaceRegistration and manual summation) agreed well with only minor differences being observed. In the study by Soukup et al. [Citation18] two similar methods were applied in order to compare the robustness of IMRT versus intensity-modulated proton therapy to organ movement in prostate RT. The accumulated bladder gEUD was 1.0–2.9 Gy lower than the summed gEUD indicating that, for the material used in that study, the summed DVH was an inaccurate representation of the actual DVH [Citation18]. Conversely in another investigation on this topic [Citation13], bladder doses from biomechanical DIR-based dose accumulation and DVH summation agreed to a large extent, with small differences for the near-maximum/minimum doses (p ≤ 0.05 for D2% and D98%) only. Both approaches still rely on manual delineation of organs, introducing yet another uncertainty and additional workload in the clinic.
Comparing the accumulated bladder and prostate dose distributions between DART and SurfaceRegistration based on the DIR quality in DART (median DSC ≥ 0.9 vs. median DSC < 0.9), significantly lower doses (p ≤ 0.05 for bladder gEUD and NTCP and for prostate Dmin) were seen using DART for the patients with a median DSC < 0.9. For the patients with a median DSC ≥ 0.9, this was less pronounced and no significant differences were established. Even though the patients with a median DSC ≥ 0.9 were considered as having overall accurate DIRs in DART, large volume variations relative to the pCT volumes were not captured. Indeed for both the bladder and the prostate we found that for two of the patients with a median DSC ≥ 0.9, the ratio between the propagated DART volumes and the pCT volumes were significantly different compared to the corresponding ratio between the manually delineated volumes and the pCT volumes (data not shown). In a previous investigation where various performance metrics of intensity-based DIR were compared, when applied to rectum and bladder contour propagation, the DSC metric was significantly correlated with a clinical measure of the accuracy of the propagated contours [Citation28]. In analogy to the current investigation, it was further demonstrated that the intensity-based DIR algorithm used in that study was unable to track substantial (smaller/larger) bladder volume variations relative to the pCT volumes, with the ratio between the propagated and the pCT contours being up to 44% larger than the corresponding ratio between the manually delineated and the pCT contours. For intensity-based DIR algorithms a frequently recognised drawback is that they are error prone when large volume variations are present, resulting in lack of image intensities to track organ elements [Citation2,Citation10,Citation11,Citation28,Citation29]. This is a likely explanation to the insufficient tracking of volumes between the pCT and the repeat scans observed with DART in the current study.
In conclusion, we have presented large differences between motion-inclusive dose distributions and ‘static’ dose distributions assessed from the treatment planning CT for the bladder and the prostate. In addition, the accumulated bladder and prostate doses from the pre-release intensity-based DIR application deviated from the doses resulting from the in-house developed contour-based biomechanical DIR application. The largest differences were associated with poor DIRs obtained in the intensity-based application. Dose accumulation following intensity-based DIR only therefore needs further improvements prior to clinical implementation.
http://informahealthcare.com/doi/abs/10.3109/0284186X.2014.928742
Download PDF (129.1 KB)Acknowledgements
Varian Medical Systems are greatly acknowledged for providing the DART application.
Declaration of interest: The authors report no conflicts of interest. The authors alone are responsible for the content and writing of the paper.
This study has been supported by research grants from CIRRO-The Lundbeck Foundation Center for Interventional Research in Radiation Oncology, the Danish Cancer Society, FSS (The Danish Council for Independent Research) as well as the Danish Council for Strategic Research.
References
- Hatton JA, Greer PB, Tang C, Wright P, Capp A, Gupta S, et al. Does the planning dose-volume histogram represent treatment doses in image-guided prostate radiation therapy? Assessment with cone-beam computerised tomography scans. Radiother Oncol 2011;98:162–8.
- Jaffray DA, Lindsay PE, Brock KK, Deasy JO, Tomé WA. Accurate accumulation of dose for improved understanding of radiation effects in normal tissue. Int J Radiat Oncol Biol Phys 2010;76:135–9.
- Lu W, Olivera GH, Chen Q, Ruchala KJ, Haimeri J, Meeks SL, et al. Deformable registration of the planning image (kVCT) and the daily images (MVCT) for adaptive radiation therapy. Phys Med Biol 2006;51:4357–74.
- Muren LP, Karlsdottir A, Kvinnsland Y, Wentzel-Larsen T, Dahl O. Testing the new ICRU 62 ‘Planning Organ at Risk Volume’ concept for the rectum. Radiother Oncol 2005; 75:293–302.
- Rosewall, T, Catton C, Currie G, Bayley A, Chung P, Wheat J, et al. The relationship between external beam radiotherapy dose and chronic urinary dysfunction – a methodological critique. Radiother Oncol 2010;97:40–7.
- Viswanathan AN, Yorke ED, Marks LB, Eifel PJ, Shipley WU. Radiation dose-volume effects of the urinary bladder. Int J Radiat Oncol Biol Phys 2010;76:116–22.
- Muren, LP, Wasbø E, Helle SI, Hysing LB, Karlsdottir A, Odland OH, et al. Intensity-modulated radiotherapy of pelvic lymph nodes in locally advanced prostate cancer: Planning procedures and early experiences. Int J Radiat Oncol Biol Phys 2008;71:1034–41.
- Thörnqvist S, Bentzen L, Petersen JB, Hysing LB, Muren LP. Plan robustness of simultaneous integrated boost radiotherapy of prostate and lymph nodes for different image-guidance and delivery techniques. Acta Oncol 2011; 50:926–34.
- Thirion JP. Image matching as a diffusion process: An analogy with Maxwell's demons. Med Image Anal 1998; 2:243–60.
- Thörnqvist S, Petersen JB, Høyer M, Bentzen L, Muren LP. Propagation of target and organ at risk contours in radiotherapy of prostate cancer using deformable image registration. Acta Oncol 2010;49:1023–32.
- Thor M, Petersen JB, Bentzen L, Høyer M, Muren LP. Deformable image registration for contour propagation from CT to cone-beam CT scans in radiotherapy of prostate cancer. Acta Oncol 2011;50:918–25.
- Noe K.Ø, Tanderup K, Sørensen TS. Surface membrane based bladder registration for evaluation of accumulated dose during brachytherapy in cervical cancer. IEEE International Symposium on Biomedical Imaging (ISBI) 2011: 1253–6.
- Andersen ES, Muren LP, Sørensen TS, Noe KO, Thor M, Petersen JB, et al. Bladder dose accumulation based on a biomechanical deformable image registration algorithm in volumetric modulated arc therapy for prostate cancer. Phys Med Biol 2012;57:7089–100.
- Kvinnsland Y, Muren LP, Dahl O. Evaluation of a new method for calculation of cumulative doses in the rectum wall using repeat CT scans. Acta Oncol 2004;43:388–95.
- International Commission on Radiation Units and measurements (ICRU). Prescribing, recording and reporting photon-beam intensity-modulated radiation therapy (IMRT): ICRU Report 83. J ICRU 2010;10:27–40.
- Niemierko A. A generalized concept of equivalent uniform dose. Med Phys 1999;26: 1100(abstract).
- Hysing LB, Skorpen TB, Alber M, Fjellsbø LB, Helle SI, Muren LP. Influence of organ motion on conformal vs. intensity-modulated pelvic radiotherapy for prostate cancer. Int J Radiat Oncol Biol Phys 2008;71:1496–503.
- Soukup M, Söhn M, Yan D, Liang J, Alber M. Study of robustness of IMPT and IMRT for prostate cancer against organ movement. Int J Radiat Oncol Biol Phys 2009;75: 941–9.
- Lyman JT. Complication probability as assessed from dose-volume histograms. Radiat Res 1985;8:13–9.
- Kutcher GJ, Burman C. Calculation of complication probability factors for non-uniform normal tissue irradiation: The effective volume method. Int J Radiat Oncol Biol Phys 1989;16:1623–30.
- Burman C, Kutcher GJ, Emami B, Goitein M. Fitting of normal tissue tolerance data to an analytic function. Int J Radiat Oncol Biol Phys 1991;21:123–35.
- Dice LR. Measures of the amount of ecologic association between species. Ecology 1945;26:297–302.
- Pederson AW, Fricano J, Correa D, Pelizzari CA, Liauw SL. Late toxicity after intensity-modulated radiation therapy for localized prostate cancer: An exploration of dose-volume histogram parameters to limit genitourinary and gastrointestinal toxicity. Int J Radiat Oncol Biol Phys 2012;82:235–41.
- Buettner F, Gulliford SL, Webb S, Partridge M. Using dose-surface maps to predict radiation-induced rectal bleeding: A neural network approach. Phys Med Biol 2009; 54:5139–53.
- Thor M, Væth M, Karlsdottir A, Muren LP. Rectum motion and morbidity prediction: Improving correlation between late morbidity and DVH parameters through use of rectum planning organ at risk volumes. Acta Oncol 2010;49: 1061–8.
- Thor M, Apte A, Deasy JO, Muren LP. Statistical simulations to estimate motion-inclusive dose-volume histograms for prediction of rectal morbidity following radiotherapy. Acta Oncol 2013;52:666–75.
- Thor M, Bentzen L, Hysing LB, Ekanger C, Helle SI, Karlsdottir A, et al. Prediction of rectum and bladder morbidity following radiotherapy of prostate cancer based on motion-inclusive dose distributions. Radiother Oncol 2013;107:147–51.
- Thor M, Bentzen L, Elstrøm UV, Petersen JB, Muren LP. Dose/volume based evaluation of the accuracy of deformable image registration for the rectum and bladder. Acta Oncol 2013;52:1411–6.
- Godley A, Ahunba E, Peng C, Ling XA. Automated registration of large deformations for adaptive radiation therapy of prostate cancer. Med Phys 2009;36:1433–41.