
Abstract
Background. The aim of this study was to evaluate two fully automatic segmentation methods in comparison with manual delineations for their use in delineating the heart on planning computed tomography (CT) used in radiotherapy for breast cancer.
Material and methods. Automatic delineation of heart in 15 breast cancer patients was performed by two different automatic delineation systems. Analysis of accuracy and precision of the differences between manual and automatic delineations were evaluated on volume, mean dose, maximum dose and spatial distance differences. Two sets of manual delineations were used in the evaluation: 1) a set prior to common delineation guidelines; and 2) a second set repeated with a common set of guidelines.
Results. Systematic differences between automatic and manual delineations were small for volume as well as dose. The uncertainty of the difference in volume was smaller than or similar to the inter-observer variation in manual delineations. For dose, the uncertainty was similar to manual delineations performed without common guidelines but slightly higher than the variation in manual delineations with common guidelines. Spatial differences between average manual and automatic delineations were largest at the base of the heart, where also large variations are observed in the manual delineations. Both algorithms could be improved slightly at the apex of the heart where the variation of automatic delineation was larger than for the manual delineations.
Conclusion. Automatic delineation is an equal alternative to manual delineation when compared to the inter-observer variation. The reduction in precision of measured dose was small compared to other uncertainties affecting the estimated heart dose and would for most applications be outweighed by the benefits of fully automated delineations.
In order to estimate and minimize radiation doses to normal tissue, precise delineations are needed. Software solutions for automated delineation of organs at risk are becoming commercially available. These systems have the potential to reduce or even remove the time needed for manual delineation and at the same time reduce the manual inter-observer delineation variation. However, if fully automatic delineation is to be used with no subsequent manual editing, careful testing and verification is needed.
Radiotherapy for breast cancer can result in an increased risk of heart disease [Citation1], and therefore the heart is delineated in breast cancer patients receiving radiotherapy in many centers. Inter-observer variation in manual delineation of the heart can be substantial [Citation2], especially at the base of the heart, where differences of several centimetres have been observed [Citation3]. Consensus guidelines have been formed in attempt to reduce the inter-observer variation, e.g. in the form of breast cancer atlas by the Radiation Therapy Oncology Group (RTOG) as well as the Danish Breast Cancer Cooperative Group (DBCG).
Automatic delineations of organs at risk have been evaluated in radiotherapy, e.g. cancer of the prostate [Citation4,Citation5] and head and neck [Citation6,Citation7], but to our knowledge, there are no studies evaluating automatic delineation of the heart in radiotherapy for breast cancer. The aim of this study was to evaluate two commercial automatic segmentation methods in comparison with manual delineations for their use in delineating the heart in radiotherapy for breast cancer.
Material and methods
Automatic delineation of heart in 15 breast cancer patients was performed by two different automatic delineation systems with analysis of accuracy and precision of the differences between manual and automatic delineations. Two sets of manual delineations were used in the evaluation: 1) a set prior to common delineation guidelines (Baseline 1); and 2) a second set repeated with a common set of guidelines (Baseline 2).
Automatic delineation
Two automatic delineation systems were used: ABAS (Atlas Based Auto Segmentation, Elekta AB) and SPICE (Smart Probabilistic Image Contouring Engine) part of Pinnacle3 version 9.4 (Philips Healthcare).
ABAS is based on a user-defined atlas, consisting of CT scans of a number of locally delineated patients – atlas subjects. For each subject in the atlas the heart delineation is transferred to the actual patient by use of deformable registration. For atlases consisting of more than one subject the individual segmentations are combined to a single segmentation using the STAPLE algorithm [Citation8].
SPICE is not based on any local input to the segmentation system, but includes predefined models for a range of organs. The thorax segmentation of SPICE included lungs, carina, spinal cord, trachea and two models of the heart named Heart1 and Heart2. The two heart models differ at the cranial part of the heart, with Heart1 extending further in the cranial direction than Heart2. The Heart1 model was closest to the manual delineations used for comparison, therefore only Heart1 was included in the study.
Manual delineation
Two sets of manual delineations were used for evaluation of the automatic segmentation. The first set, Baseline 1, was included to make a comparison to the variations expected clinically among observes from different centers without any inter-institution agreement on delineation guidelines. The second set, Baseline 2, was used as a description of the variation expected among observers from different centers after definition of common guidelines.
The 15 patients included in the current study were previously manually delineated as part of a study on inter-observer variation of heart delineation [Citation3]. The delineations were performed by nine observers from five centers, four in Denmark and one in the UK. All observers had clinical experience in the delineation of the heart for planning of radiotherapy. Initially the observers were asked to delineate the heart according to local clinical practice (Baseline 1). Following the initial delineation, common guidelines were agreed, based on the article by Feng et al. [Citation9], by the participating centers. Re-delineations were performed using the common guidelines (Baseline 2) separated by at least two months in time.
Volume and dose
Delineations, CT scans and dose distributions were imported and analyzed in Matlab R2007b using the open-source tool CERR [Citation10] and in-house code. The automatic delineations were compared with the manual delineations with respect to measured volume, mean and maximum doses using Bland-Altman plots [Citation11]. The Bland-Altman plot shows the mean difference between two measurement methods and the 95% interval of the difference (1.96 × SD of the difference) as function of the average value. Thus, the Bland-Altman shows the standard input to as paired student t-test as function of the average values including confidence limits as calculated by the student t-test. In the Bland-Altman plots comparing the automatic and manual methods, the patient-specific mean value of the nine manual volume or dose values were used as predictor of the best manual delineations. The reported values and confidence intervals in the plots are therefore the difference between the automatic delineation and the average value of patient-specific manual delineations. For comparison the 95% interval of the manual delineations [1.96 × root mean square (RMS) of the inter-observer standard deviation within each patient] were calculated and shown in the right hand side of the Bland-Altman plots. This limit reflects the variation expected if a single observer was doing the delineation.
Spatial distance
Spatial deviation between manual and automatic contours may not result in differences in volume or mean and maximum doses. Thus, in order to measure local differences in specific directions the spatial difference in distance between automatic and manual delineation was mapped. The difference was measured as the difference between automatic and the median of the manual delineations along a set of directions covering the surface of the heart (illustrated in ). The differences were plotted on a map which also included the anatomical directions (see ). Furthermore, the variation in manual delineations along the same directions was calculated and mapped. The spatial variation of the manual delineations was calculated as the RMS of the standard deviation of the delineations in the specific direction within each patient.
Figure 1. Illustration of the mapping of spatial differences between automatic and manual delineations. a) an automatic heart delineation in 3D. Along the surface of the heart the deviation between manual and automatic segmentations is mapped as illustrated by the arrows. b) one of these arrows in 2D showing how the difference is calculated between the median manual delineation and the automatic. These differences along the surface of the heart are mapped using an Eckert IV projection, with anatomical directions as shown in c).
Patients
The 15 patients included in the study have been described previously [Citation3]. The patients were treated with radiotherapy after left-sided breast conserving surgery in 2010 and selected at random. All patients were scanned on a Phillips Bigbore with voxel size 1 × 1× 3 mm without contrast. Each patient received radiotherapy according to the 2010 guidelines from DBCG (http://www.dbcg.dk). The treatment field configuration was patient-specific, but consisted in general of two 6 MV tangential beams with one or two supplementary 18 MV fields delivering 10–20% of the prescribed dose. Shielding of the heart and left anterior descending coronary artery (LADCA) was adjusted to comply with the DBCG dose volume constraints for the heart: V40Gy ≤ 5% and V20Gy ≤ 10% and for LADCA: V20Gy = 0% and V10Gy ≤ 5% (Vx being the relative volume receiving a dose larger than x).
All treatment plans were made in the Pinnacle treatment planning system using the collapsed cone algorithm.
Selection of atlas subjects for ABAS
As stated previously ABAS is based on local input of a delineation atlas. The quality of the automatic delineation from ABAS is expected to increase as the number of subjects in the delineation atlas increases. In the current study, the delineation atlas consisted of 15 subjects pre-delineated locally based on the same guidelines as described above. The 15 subjects provided à priori to the ABAS algorithm were a different set of patients from the 15 patients included in the current study, but had similar characteristics.
In order to evaluate whether a sufficient number of atlas subjects was used, the segmentation of study patients was repeated with 15 different sets of atlases each containing different number of atlas subjects. The selection of subjects for each atlas set was performed at random, starting with one atlas subject and then adding additional subjects at random until all 15 atlas subjects were included.
Results
All 15 patients were segmented by both ABAS and SPICE. For both systems the delineations where in general closer to the manual delineation with common guidelines (example patient can be seen in Supplementary Figure 1, available online at: http://informahealthcare.com/doi/abs/10.3109/0284186X.2014.930170).
Compared with manual delineations performed without common guidelines (Baseline 1), both ABAS and SPICE had on average a larger volume (Supplementary Table I, available online at: http://informahealthcare.com/doi/abs/10.3109/0284186X.2014.930170 and ). The 95% limits of the difference between automatic and the mean manual volume were substantially smaller than the 95% limits in manual delineations for both systems, indicating that the automatic delineations had less variation than the manual delineations. For both systems the 95% limits of the differences in mean as well as maximum doses were similar to the 95% limits in manual delineation ().
Figure 2. Bland-Altman plots of difference in volume, mean and maximum dose given by automatic and manual delineation without common guidelines (baseline 1). Solid horizontal lines is mean difference and dashed lines is the 95% limits of agreements (± 1.96 × SD of the difference). For comparison the 95% limits in manual delineations (± 1.96 × RMS of the inter-observer standard deviation within each patient) is shown to the right of each figure.
Comparisons between the automatic systems and the manual delineations performed with common guidelines (Baseline 2) showed a smaller overall difference in volume compared to that of Baseline 1 (Supplementary Table I available online at: http://informahealthcare.com/doi/abs/10.3109/0284186X.2014.930170 and ). The 95% limits of the difference were similar to the 95% limits of the manual delineation. For both systems, the 95% limits of the differences in mean and maximum doses were wider than the 95% limits of the manual delineations, implying that automatic delineations had a larger variation than the manual delineations ().
Figure 3. Bland-Altman plots of difference in volume, mean and maximum dose given by automatic and manual delineation with common guidelines (baseline 2). Solid horizontal lines is mean difference and dashed lines is the 95% limits of agreements (± 1.96 × SD of the difference). For comparison the 95% limits in manual delineations (± 1.96 × RMS of the inter-observer standard deviation within each patient) is shown to the right of each figure.
shows that for Baseline 1, the major differences between automatic and manual delineations were at the base of the heart where delineations by both ABAS and SPICE were systematically larger (). Delineations by SPICE were smaller than the manual delineations in the mid-posterior and caudal region. However, all the deviations were less than the standard deviation of the manual delineations ().
Figure 4. Spatial mapping of heart delineations. a) shows the variation in manual delineations without guidelines as the root mean square of the standard deviation of the delineations in the specific direction within each patient . b) and c) the mean deviation between automatic and median manual delineations without guidelines delineation for ABAS and SPICE respectively. Similar maps are shown in d), e) and f) for manual delineations performed with common guidelines. Anatomical directions of the maps are shown in .
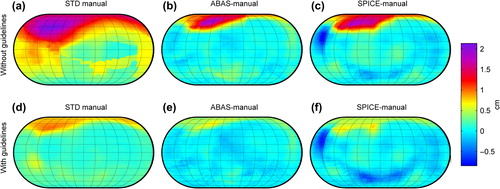
When compared to delineations with common guidelines (Baseline 2 – ), deviations at the base of the heart were reduced for both systems and still within one standard deviation of the variation in manual delineations (). Delineations by SPICE were smaller than the manual delineations in the mid-posterior and caudal region, and differed in parts of those regions with more than two standard deviations of the manual delineations.
The average segmentation time for a complete segmentation of thorax with SPICE was 5.4 min per patient, whereas for ABAS the average time with 15 atlas patients was 57 min per patient. shows that the mean and variation in mean doses estimated by ABAS when compared to Baseline 2 stabilized after inclusion of 8–9 patients corresponding to a segmentation time of approximately 30 minutes.
Figure 5. Difference in mean dose for ABAS as function of number of atlas subjects. Two parameters from the Bland-Altman plots, the mean difference (value of solid line in figure 3c) and the standard deviation of the difference for mean dose compared with baseline 2 is shown. Atlas subjects were selected at random starting with one and adding one at random until all 15 patients were selected. Segmentation time is shown as average time per patient.
Discussion
The two systems tested, ABAS and SPICE, were fully automated and required no manual input in order to successfully delineate the heart. Subsequent manual editing of automatically generated delineations could be applied to improve the precision. However, automatic delineations requiring no subsequent editing are preferable, and no manual editing was applied to any of the automatic contours in this study. While we are not aware of other studies on automatic delineation of the heart in radiotherapy for breast cancer, fully automatic delineation has been evaluated of other organs at risk. Simmat et al. [Citation4] evaluated automatic delineations of the prostate, rectum and bladder and observed a spatial overlap slightly smaller than the overlap among manual delineations. Their results were based on only one atlas subject, which in the current study was not sufficient for heart delineation to utilize the full capability of ABAS. ABAS was also used by Voet et al. [Citation7] to evaluate salivary glands delineations in radiotherapy of head and neck cancer. In terms of estimated dose, subsequent manual editing was rarely needed. Whereas Teguh et al. [Citation6] also evaluating ABAS concluded based on overlap measures that subsequent manual editing was needed for several organs at risk in radiotherapy of H&N cancer. The different conclusions reached in the studies may be explained by some organs being more difficult to automatically delineate, but also by the way the delineations were evaluated. Overlap measures, such as the DICE-coefficient are often used for measuring the similarity of delineations as done by Teugh et al. who used the DICE-coefficient between the automatic and a manual delineation to conclude whether the similarity was sufficiently high. Overlap measures however has no direct clinical interpretation, and while they can be compared to the overlap expected among manual delineations by different observers as done by Simmat et al., the clinical importance of any differences are unclear. A much more clinical relevant measure is differences in measured dose as applied by Voet et al. [Citation7]. Mean and maximum dose to the heart was therefore used as measures for evaluating the automatic delineation in the current study and differences between automatic and manual delineations were compared to the inter-observer variation in manual delineations.
In the current study, heart volume was estimated more consistently by both ABAS and SPICE than manual delineations. Prior to common guidelines, local heart delineation guidelines may vary, and the lower variation compared to Baseline 1 was therefore expected. Using Baseline 2 with common guidelines on heart delineation, it was surprising that the automatic delineation still had less volume variation than the manual delineations (albeit only slightly smaller for SPICE).
In terms of estimated doses from left-sided tangential radiotherapy for breast cancer, the advantage of the automatic delineations was not as clear. While the mean difference was small in comparison with both baselines, the variation in estimated dose was for Baseline 1 similar to the manual variation but for Baseline 2 the variation in dose estimates were smaller for the manual delineations. Additional uncertainty may therefore be associated with doses based on an automatic delineation compared to a trained individual, and depending on the contexts this should be balanced against the benefits of automatic delineations. The additional uncertainty in using the automated delineation is comparable to the dose variation introduced by 1–2 mm uncertainty of heart position within the treatment field. Thus, compared to other delivery uncertainties, such as heart beat, respiration and setup uncertainties the additional uncertainty of using automatic versus manual delineations will for most cases be minimal. In clinical treatment planning the automatic heart delineations would lead to a reduction in manual delineation time required and also reduce the need of training whereas in studies on radiation induces heart disease automatic heart delineations could allow for measuring heart doses in large number of patients which would not be possible if manual delineations were to be performed retrospectively.
Though the spatial distance mapping showed the base of the heart to be the region with largest deviation from manual delineations, differences in this region have modest impact on dose from the left-sided tangential radiotherapy we use today. As previously shown [Citation3] the mean dose depend not only on the spatial difference but also the local dose at the point of the spatial difference (the more the local dose deviates from the mean dose the higher the impact). The largest deviation between mean heart dose and local dose is in the anterolateral region where the heart is irradiated by the tangential fields. This variation is the main reason for the variation observed for the mean dose. Thus, small improvement in automatic delineations near the apex could therefore markedly reduce the uncertainties in measured dose for the automatic systems.
The results of estimated doses are only valid for radiotherapy with similar dose distributions. As shown by the spatial mapping of distance differences (), the uncertainties would be different, e.g. a lung cancer treatment which could irradiate larger areas of the base of heart. However, use of manual delineation would not reduce the uncertainty since similar variations in manual delineations are seen in that area.
The segmentation precision by ABAS increased with an increasing number of atlas patients, but this gain lead to an increased segmentation time. The results in indicate that the precision would not had been increased if more atlas subjects had been used, and that the number of atlas subjects for ABAS could likely be halved without compromising the precision. Furthermore, the segmentation time by ABAS can be reduced by more than 30% using a supported graphics processor unit [Citation12]. With this in mind segmentation times of neither of the two systems hinders clinical implementation.
In general, ABAS and SPICE performed similarly with similar mean differences in volume and doses, but with ABAS showing a lower variation than SPICE. ABAS was trained specifically for the study using the same guidelines as used for manual delineation in Baseline 2, and the higher agreement could therefore be explained by this inherent advantage of ABAS. This however also means that the results for ABAS obtained in the current study, are not universal and care needs to be taken in defining the atlas in a clinical implementation. SPICE on the contrary comes with the heart predefined and could directly be implemented clinically without need of local input which will reduce inter-center variations.
Conclusion
Both automatic segmentation systems delineated the heart fully automatically with no manual intervention or editing. Heart volume was well estimated, with both systems having a lower uncertainty than manual delineations. Mean and maximum heart doses were estimated with high accuracy but with slightly higher uncertainties than manual delineations performed with common guidelines. Automatic delineations could therefore readily replace manual delineations when compared to the variation observed clinically between manual delineations from different centers. Though the uncertainty was higher in doses than in manual delineations performed with common guidelines, the slight increase in uncertainty would for most applications be sufficiently low to be outweighed by the benefits of fully automated delineations.
http://informahealthcare.com/doi/abs/10.3109/0284186X.2014.930170
Download PDF (1.2 MB)Acknowledgements
The authors would like to thank Karl Bzdusek for providing access to SPICE and Carolyn W. Taylor, Maja Maraldo, Mette H. Nielsen, Birgitte V. Offersen, Maria R. Andersen, Dean O’Dwyer, Lone Larsen, Sharon Duxbury and Baljit Jhitta for manual delineation of patients.
Declaration of interest: The authors report no conflicts of interest. The authors alone are responsible for the content and writing of the paper.
References
- Darby SC, Ewertz M, McGale P, Bennet AM, Blom-Goldman U, Brønnum D, et al. Risk of ischemic heart disease in women after radiotherapy for breast cancer. New Engl J Med 2013;368:987–98.
- Li XA, Tai A, Arthur DW, Buchholz TA, Macdonald S, Marks LB, et al. Variability of target and normal structure delineation for breast cancer radiotherapy: An RTOG multi-institutional and multiobserver study. Int J Radiat Oncol Biol Phys 2009;73:944–51.
- Lorenzen EL, Taylor CW, Maraldo M, Nielsen MH, Offersen BV, Andersen MR, et al. Inter-observer variation in delineation of the heart and left anterior descending coronary artery in radiotherapy for breast cancer: A multi-centre study from Denmark and the UK. Radiother Oncol 2013;108:254–8.
- Simmat I, Georg P, Georg D, Birkfellner W, Goldner G, Stock M. Assessment of accuracy and efficiency of atlas-based autosegmentation for prostate radiotherapy in a variety of clinical conditions. Strahlenther Onkol 2012;188:807–15.
- Foskey M, Davis B, Goyal L, Chang S, Chaney E, Strehl N, et al. Large deformation three-dimensional image registration in image-guided radiation therapy. Phys Med Biol 2005;50:5869–92.
- Teguh DN, Levendag PC, Voet PWJ, Al-Mamgani A, Han X, Wolf TK, et al. Clinical validation of atlas-based auto-segmentation of multiple target volumes and normal tissue (swallowing/mastication) structures in the head and neck. Int J Radiat Oncol Biol Phys 2011;81:950–7.
- Voet PWJ, Dirkx MLP, Teguh DN, Hoogeman MS, Levendag PC, Heijmen BJM. Does atlas-based autosegmentation of neck levels require subsequent manual contour editing to avoid risk of severe target underdosage? A dosimetric analysis. Radiother Oncol 2011;98:373–7.
- Warfield SK, Zou KH, Wells WM. Simultaneous truth and performance level estimation (staple): An algorithm for the validation of image segmentation. IEEE Trans Med Imaging 2004;23:903–21.
- Feng M, Moran JM, Koelling T, Chughtai A, Chan JL, Freedman L, et al. Development and validation of a heart atlas to study cardiac exposure to radiation following treatment for breast cancer. Int J Radiat Oncol Biol Phys 2011;79:10–8.
- Deasy JO, Blanco AI, Clark VH. CERR: A computational environment for radiotherapy research. Med Phys 2003; 30:979–85.
- Bland JM, Altman DG. Statistical methods for assessing agreement between two methods of clinical measurement. Lancet 1986;1:307–10.
- Godley A, Peng C, Ahunbay E, Li X. SU-GG-T-20: GPU-accelerated auto-segmentation for online adaptive radiotherapy. 2010;37:3188.