
Abstract
Background. Tissue permeabilization by electroporation (EP) is a promising technique to treat certain cancers. Non-invasive methods for verification of induced permeabilization are important, especially in deep-seated cancers. In this study we evaluated diffusion-weighted magnetic resonance imaging (DW-MRI) as a quantitative method for detecting EP-induced membrane permeabilization of brain tissue using a rat brain model.
Material and methods. Fifty-four anesthetized Sprague-Dawley male rats were electroporated in the right hemisphere, using different voltage levels to induce no permeabilization (NP), transient membrane permeabilization (TMP), and permanent membrane permeabilization (PMP), respectively. DW-MRI was acquired 5 minutes, 2 hours, 24 hours and 48 hours after EP. Histology was performed for validation of the permeabilization states. Tissue content of water, Na+, K+, Ca2+, and extracellular volume were determined. The Kruskal-Wallis test was used to compare the DW-MRI parameters, apparent diffusion coefficient (ADC) and kurtosis, at different voltage levels. The two-sample Mann- Whitney test with Holm's Bonferroni correction was used to identify pairs of significantly different groups. The study was approved by the Danish Animal Experiments Inspectorate.
Results and conclusion. Results showed significant difference in the ADC between TMP and PMP at 2 hours (p < 0.001) and 24 hours (p < 0.05) after EP. Kurtosis was significantly increased both at TMP (p < 0.05) and PMP (p < 0.001) 5 minutes after EP, compared to NP. Kurtosis was also significantly higher at 24 hours (p < 0.05) and 48 hours (p < 0.05) at PMP compared to NP. Physiological parameters indicated correlation with the permeabilization states, supporting the DW-MRI findings. We conclude that DW-MRI is capable of detecting EP-induced permeabilization of brain tissue and to some extent of differentiating NP, TMP and PMP using appropriate scan timing.
Cellular membranes are permeabilized when exposed to sufficiently high voltage pulses. This phenomenon is known as electroporation (EP) [Citation1]. Its application in medicine is growing rapidly, and currently EP is also being evaluated as a new treatment modality of primary and secondary cancers in the brain [Citation2,Citation3].
EP induces transient membrane permeabilization (TMP) or permanent membrane permeabilization (PMP), depending on the pulse parameters (amplitude, duration, frequency and number) [Citation4]. In chemotherapy, for example, moderate pulse amplitudes (voltage levels) are applied to induce TMP, enabling entrapment of chemotherapeutic agents in tumor cells, thus increasing cytotoxicity (> 300-fold) [Citation5,Citation6]. In tumor ablation, however, tumor cells are eradicated by very high pulse amplitudes (higher voltage levels) that induce PMP locally [Citation7,Citation8]. Conversely, if the voltage level is too low, no permeabilization (NP) will occur. On the molecular scale, tissue EP is associated with reorganization of cell membrane lipids and ion transport proteins [Citation9], inflicting loss of ionic equilibrium, depletion of adenosine triphosphate (ATP) and formation of reactive oxidative species (ROS) [Citation10]. The cellular reactions manifest through morphological changes, including cellular swelling, shrinkage, blebbing, lysis and extracellular edema [Citation11–14], changing the micro-scale diffusion environment of the tissue.
Diffusion-weighted magnetic resonance imaging (DW-MRI) assesses said extracellular micro-scale diffusion environment of the scanned tissue non-invasively. In brief, DW-MRI measures the random motion of water molecules within the tissue. The apparent diffusion coefficient (ADC) is a metric of the averaged Gaussian diffusion of the water molecules and is derived from the acquired DW-MRI [Citation15]. In case of biological tissue, and in particular neural tissue, water diffusion is not purely Gaussian due to the tissue complexity (neurons, glial cells, extracellular matrix etc.). The statistical parameter, kurtosis, has been introduced as a further DW-MRI metric [Citation16], providing information about the non-Gaussian characteristics of the water diffusion in tissue [Citation17].
In this study we evaluated DW-MRI as a method for detecting membrane permeabilization of brain tissue, induced by in vivo EP. Specifically, we evaluated the use of ADC and the kurtosis for quantitative assessment of electroporated brain tissue, and their value in differentiating NP, TMP and PMP. We used histological samples for validation of the permeabilization states. Tissue content of water, Na+, K+, Ca2+, and the extracellular volume (ECV) were measured for assessing change in cellular morphology and physiological state.
Imaging biomarkers for monitoring the response to treatments are in demand. We believe DW-MRI may play an important role in verification of response to treatments, such as electrochemotherapy. Potentially, the results from our study could also be applied in radiation therapy since ionizing radiation is known to induce membrane permeabilization [Citation18], and in radiofrequency ablation treatments where heat ruptures cell membranes in the exposed tissue.
Material and methods
Experimental design
In vivo EP was performed in the right brain hemisphere of the anesthetized rat using a stereotactic setup. The electrodes were removed and the rat was transferred to the MRI scanner for repeated DW-MRI scans. After the last DW-MRI scan the animal was sacrificed and tissue samples excised for determination of water, Na+, K+ and Ca2+ content, assessment of ECV, as well as histology. Four voltage levels were tested, assumed to induce NP (0 V), TMP (100 V, 200 V) and PMP (400 V). The experimental design is illustrated in .
Figure 1. Experimental design: Four voltage levels, 0 V, 100 V, 200 V and 400 V were used. The numbers of animals at each voltage level are shown at the beginning of each individual timeline. The overall timeline (5 min, 2 h, 24 h, 48 h) indicates the time between EP and MRI. Immediately after MRI at each time point a number of animals (italicized) underwent ex vivo tests (H, Histology; W, Water content; I, Ion content; E, Extracellular volume). A total of 54 rats were included in the study, of these six were not MRI scanned (indicated by *). Example: A total of eight rats were electroporated with 200 V. All had MRI at 5 min, six had additional MRI at 2 h, four had again additional MRI at 24 h and two had also MRI at 48 h. Following each MRI session two rats were euthanized and underwent ex vivo test as schematized.
Animals
Sprague-Dawley male rats (N = 54, 300–350 g), anesthetized (2.7 ml/kg body weight) with fentanyl fluanisone combination (Hypnorm; VetaPharma, UK), midazolam (Dormicum; Hoffmann-La Roche, Switzerland) and sterile H2O (1:1:2 mixture). Euthanization by anesthesia followed by lethal pentobarbital injection. The study and protocol were approved by the Danish Animal Experiments Inspectorate.
In vivo electroporation
In vivo EP, described by Agerholm-Larsen et al. [Citation2]: an 8-electrode device () was applied through a 5 mm burr hole in the skull at the stereotactic coordinates x = 2 mm, and y = 1 mm (origo at bregma), with 5 mm electrode deployment (z = 5 mm) into the brain (). Eight 0.1 ms pulses (1 Hz) were delivered at each polarity configuration (). Voltage was clamped at 0 V, 100 V, 200 V and 400 V, respectively. Electrodes were immediately removed after EP allowing a first MRI scan at 5 minutes.
Figure 2. The electrode device and electric field distribution: (A) The rat brain electrode device: four parallel inner electrodes and four slightly angled outer electrodes of length 5 mm. Only the distal 3 mm of the electrodes were electrically conductive. Each electrode was 0.2 mm in diameter. The electrodes had a palladium core and 35N LT coating. (B) Four polarity configurations were used to expose the region symmetrically (top view). The electric field distribution corresponding to an initial electrode polarization is shown in the top left window. The next electric field distribution (after 90° rotation of the polarity) is combined with the previous electric field distribution and shown in the bottom left window. This is repeated at 180° and 270° rotations of the polarity configuration. The electric field distributions are at depth z = 3.5 mm (see ) and shown for 100 V. White and black marks at the tip of the electrodes indicate opposing polarities.
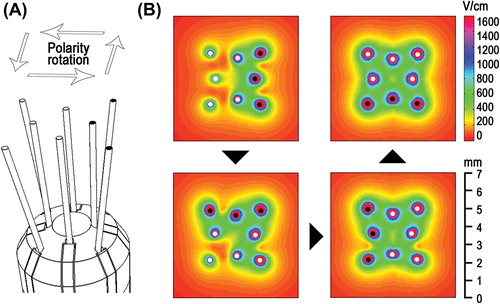
Figure 3. Regions of interest (ROI) and the location of the electrodes: The electroporated region is defined as x = [1.5;3.0] and z = [1.5;6.0] in the right hemispheres, and the control region is defined as x = [-3.0;-1.5] and z = [1.5;6.0] in the left hemisphere. The electric field overlay (200 V) on the coronal plane corresponding to the center of the electrode device is shown in the bottom.
![Figure 3. Regions of interest (ROI) and the location of the electrodes: The electroporated region is defined as x = [1.5;3.0] and z = [1.5;6.0] in the right hemispheres, and the control region is defined as x = [-3.0;-1.5] and z = [1.5;6.0] in the left hemisphere. The electric field overlay (200 V) on the coronal plane corresponding to the center of the electrode device is shown in the bottom.](/cms/asset/c43ce2a8-f63a-4c42-a9e5-865d559ba404/ionc_a_991045_f0003_oc.jpg)
Electric field and Joule heating calculations
Electric field distributions and Joule heating were calculated with Comsol Multiphysics 3.5a (Comsol AB, Sweden) and Matlab R2010a (The Mathworks Inc., USA). Electric field: The (electrostatic) continuity equation, −∇·(σ·∇φ) = 0, where σ is the tissue conductivity and φ is the electric potential, was solved with boundary conditions φ = V0 applied to the electrode surface and φ = 0 applied to model boundaries. Joule heating: Calculated as ΔT(σ/ρ·cp)E2Δt assuming quasi adiabatic conditions. Tissue properties used: Conductivity σ = 0.64 S/m, ρ = 1000 kg/m3 and cp = 4.18·103 J/(kg·K). The averaged accumulated exposure time per electrode, Δt = 2.0 ms (each of the outer 4 electrodes used in 2 configurations, and each of the inner 4 electrodes used in 3 configurations).
Magnetic resonance imaging (MRI)
A 3T clinical MRI system (Philips Achieva, Philips Healthcare, The Netherlands) was used with a 50-mm 4-channel phased array animal coil (Shanghai Chenguang Medical Technology, China). DW-MRI scans (TR/TE = 4000 ms/80 ms, 1 mm slice, FOV = 35 × 35 mm, matrix 72 × 69, pixel size 0.5 × 0.5 mm) were implemented using a generic single-shot, fat-saturated, spin-echo DWIBS sequence. Images for 6 b-values (50, 100, 150, 600, 800, 1000 s/mm2) in the direction along the electrodes (anterior–posterior) were recorded. Ten repeated DW-MRI scans and two T2-weighted (T2W) MRI scans (TR/TE = 4155 ms/100 ms, 1 mm slice, FOV 50 × 50 mm, matrix 248 × 248) were recorded at each time point.
Ex vivo examinations
Histology. Standard protocols were used for Hematoxylin and eosin (HE), Periodic acid-Schiff (PAS), and immunohistochemical neuro-filament staining (NF) with monoclonal mouse anti-human, 2F11 (Dako, Denmark), glial filament (GFAP) with polyclonal rabbit anti-GFAP (Dako, Denmark). Olympus BX50 microscope, Olympus color view 1 camera (Tubus, UTV, 0.5xG3), and Olympus soft imaging system (analySIS getIT; Olympus) were used.
Extracellular volume (ECV). The change in ECV was assessed by tracer uptake: Tissue biopsies, approximately 100 mg from the electroporated region and the control region, respectively, were incubated (within 8 minutes after asphyxiation) for 60 minutes in Na-Krebs buffer with 51Cr-Ethylenediaminetetraacetic acid (EDTA) and glucose, pre-bubbled with 95% O2 and 5% CO2. Samples were washed and counted using a scintillation gamma counter (Packard Cobra II, USA) [Citation19].
Water and Na+, K+, Ca2+ content. Water content was determined as the ratio of dried sample weight (55°C, 24 hours) to normal (wet) sample weight. Contents of Na+ and K+ were determined by flame photometry: 2.5 ml 0.3 M TCA was added to the dried samples and left to soak for at least 24 hours. Na+ and K+ contents were determined by mixing 100 μl of the TCA extract with 900 μl TCA and 1.5 ml 5.0 mM LiCl. The flame photometer (FLM3, Radiometer) used lithium as internal standard and was adjusted to give readout of 50/50 against a standard of 0.25/0.25 mM Na+/K+. Ca2+ content was determined by atomic absorption spectrophotometry (Solaar AAS, Thermo); 25–300 μl of the TCA extract was mixed with TCA to a final volume of 1500 μl. Immediately prior to measurement, 150 μl 0.27 M KCl was added to the samples, which were measured against a standard curve using a blank and standards containing 12.5 or 25 μM Ca2+ and the same amount of TCA and KCl.
Data post-processing and statistics
The ADC and kurtosis were derived as first and second order coefficients, respectively, of a second order polynomial fitted to the series expansion of the Stejskal-Tanner expression, using Matlab R2010a. ADC and kurtosis are expressed in medians to suppress effects of any outliers. Regions of interest (EP and control) are shown in and were outlined in the DW-MRI scans using registration with the T2-weighted MRI scans. The Kruskal Wallis test was used to compare different voltage levels (0 V, 100 V, 200 V, 400 V). Multiple comparisons using the two-sample Mann-Whitney test with Holm's Bonferroni correction were used to identify pairs of significantly different groups. To test for difference between normal tissue (control) and the EP region, one-sample t-test of log-transformed ADC ratios and kurtosis differences was used. Holm's sequential Bonferroni correction was used to account for multiple testing.
Results
Histological validation of NP, TMP and PMP
Histology shows clear correlation with the applied voltage (). At 0 V only a spot is observed, indicating simple perforation by the electrode. After application of 100 V there are slightly larger regions of bleeding, and loss of neurons at the electrode sites. The porous texture at the electrode sites indicates extracellular edema. The tissue is recovered 14 days after EP (). This indicates that permeabilization induced by 100 V is transient. EP at 400 V induces severe necrosis, observed as a large contiguous region in the sample taken 48 hours after EP. This clearly shows that 400 V induces PMP.
Figure 4. Rat brain histology: The left column shows HE stained axial tissue samples at depth 3 mm (z = 3). The electrodes were deployed orthogonal to the sample plane. White arrows point at selected electrode marks. The right column shows magnifications, including overlays of calculated iso-field lines at selected intensities (in V/cm). Samples are NF stained (neurofilament), HE stained and GFAP stained (glial filament), from top to bottom. GFAP stained coronal tissue sample: Generally the tissue is recovered and scar tissue (reactive gliosis) is seen only in close proximity of the electrode (arrow) where the electric field intensity is very high. In the superior part of the brain there is a slightly diffuse reactive gliosis connected to surgery of the brain dura and penetration of the device.
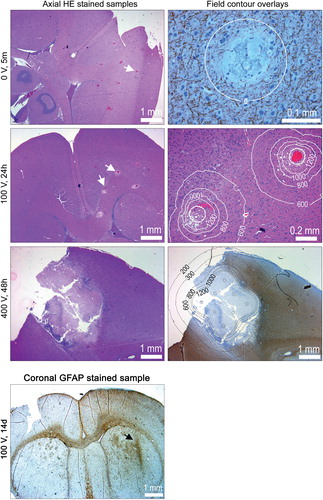
In the second column of overlays of the iso-field lines are added to the histology images. The 0 V/cm iso-field line at 0 V is simply the outline of the electrode, confirming that the affected region is no larger than the perforation by the electrode (0.2 mm). At 100 V edema is present in a region outlined by the 800 V/cm iso-field line, and loss of neurons and glial cells is present inside the 1000–1200 V/cm iso-field line. This is confirmed by the sample from 400 V exposure showing necrosis in a region corresponding to intensities above 1000–1200 V/cm. Thickening of both glial filaments and condensation of neuro-filaments is observed in the region corresponding to 300–600 V/cm. This may indicate membrane permeabilization-induced hyper-osmolarity in cell cytoplasm, likely caused by Na+ influx. The results suggest that TMP may take place in the window of 300–800 V/cm and PMP ensues at field intensities above 800–1000 V/cm, all in agreement with findings reported from muscle EP [Citation20].
DW-MRI of brain tissue with NP, TMP and PMP
Representative MRI scans in show almost no intensity change at 0 V. At 100 V there are slight local changes in image intensity corresponding to the electroporated region. A small hyper-intense region in the T2W image at 48 hours is hypo-intense in the DW scan, corresponding to increased diffusion in that region. At 200 V (2 hours) the regions corresponding to the electrode tracks appear hyper-intense and the region between the electrodes appears hypo-intense in the DW scan, suggesting restricted and increased diffusion, respectively. Interestingly, at 400 V (2 hours) image intensity of the DW-MRI seems reversed in the electroporated region, suggesting restricted diffusion in the area between the electrode tracks. This is confirmed by the ADC ratios (), showing a slight drop in the ADC at 2 hours and no change at 24 hours, separating it from the 100 V and 200 V conditions which have increased ADC ratios at these time points.
Figure 5. T2-weighted (T2W) and DW-MRI (b = 800) of the rat brain: Representative coronal MRI scans at selected time points and all voltage levels. In the DW-MRI images the hyper-intensity reflects low diffusivity and hypo-intense regions reflect high diffusivity. The left column shows the calculated electric field distributions in the range 350–1200 V/cm. White arrows in the top panel (T2W) indicate the tracks left by the electrodes (black arrows).
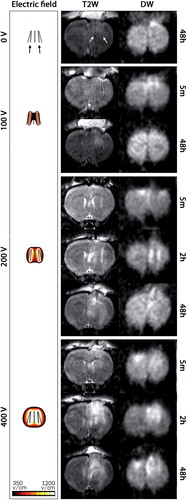
Figure 6. ADC ratios and kurtosis shift over time: The ADC ratio is the median ADC of the electroporated region over the median ADC of the control region. The kurtosis shift is the median kurtosis of the electroporated region minus the median kurtosis of the control region (kurtosis shift). (Variance of measurements of the control and electroporated region was comparable). Electroporated region and control region definitions are shown in . All data points are shown individually and as boxes with the central mark indicating the median. The edges of the box are the 25th and 75th percentiles. Significance levels: *p < 0.05, **p < 0.01, ***p < 0.001.
The kurtosis () is increased quickly after EP (5 minutes) at 100 V, 200 V and 400 V. In the 400 V condition the kurtosis remains high throughout the scans, whereas it tends to normalize for TMP (100 V and 200 V).
The results indicate that ADC and kurtosis provide complementary information. Non-, transiently and permanently permeabilized tissues can be differentiated with combined use of ADC and kurtosis: In the 0 V group, at 5 minutes, the kurtosis is significantly lower than in the 100 V, 200 V and 400 V groups. The 100 V and 200 V conditions are not significantly different in terms of ADC or kurtosis, at any time point, indicating similar permeabilization state. The 400 V condition, however, can be distinguished from the 100 V and 200 V conditions by the ADC at 2 hours and 24 hours, and also has the highest kurtosis at all time-points. additionally shows that both transiently and permanently permeabilized tissues can be distinguished from the control tissue (region in the contralateral hemisphere) in terms of ADC and kurtosis at 5 minutes, 2 hours and 24 hours.
Table I. p-Values for test between normal tissue (control) and electroporated tissue (0 V, 100 V, 200 V, 400 V).
ECV and water content of tissue
The water content of the electroporated tissue increases steadily with electric field intensity (). This is likely to be associated with extracellular edema and disintegration of cell membranes of permanently permeabilized cells. There is no clear trend over time. We believe the decrease in water content from 5 minutes to 2 hours observed at all voltage levels may be explained as dehydration during anesthesia.
Figure 7. Water content: The water content of the electroporated region (right hemisphere) divided by the water content of the control region (left hemisphere). Extracellular volume (ECV): The change in 51Cr-EDTA uptake as counts per unit tissue weight of the electroporated region over counts per unit tissue weight of the control region. Bars show median values and white triangles indicate individual data points (2–4 observations per group).
The Cr-EDTA uptake test () also shows a general increase with electric field intensity. Since tracer content is considered proportional to the ECV we interpret this to be caused by edema. Cell shrinkage/membrane blebbing (morphological changes in apoptotic cells) could also contribute to this trend. The data imply that there is an increase in ECV from 5 minutes to 24 hours (at 0 V, 100 V, 400 V) and then a very clear fall from 24 hours to 48 hours. This corresponds nicely with the T2W scans () that show increasing hyper-intensity (edema) from 5 minutes to 2 hours, and no further increase at 48 hours.
Na+, K+, Ca2+ content of tissue
shows that the Na+ and K+ contents at 0 V are similar to the control tissue and stable over time. At 100 V and in particular at 200 V the Na+ content is increased but stable. After application of 400 V the Na+ content is increased further from 5 minutes to 24 hours, and jumps to a clearly higher level at 48 hours. This may indicate permanently increased ECV due to a solitary, or more probably, a combined effect of membrane disintegration, extracellular edema and cell shrinkage.
Figure 8. Tissue contents of Na+, K+ and Ca2+: Bars show mean values and white triangles indicate individual data points as content per gram of wet tissue (2 observations per group). Sodium and potassium data for 200 V at 5 min were excluded due to suspicion of measurement error.
We see an inverted trend in the change in K+ content (), beginning at 100 V, clearer at 200 V, and further dropping at 400 V. The increase of sodium ions and decrease of potassium ions in the tissue is an indication of an increased ECV fraction (ECV volume over total volume). This could indicate cell shrinkage, blebbing, lysis and/or extracellular edema.
The Ca2+ content is increased at 24 hours and 48 hours after application of 100 V. At 200 V the Ca2+ content increases gradually with time and more dramatically between 24 hours and 48 hours after EP. At 400 V Ca2+ increase is clear from the first time point and with a marked increase at 24 hours and 48 hours. This indicates that the PMP causes uninterrupted cellular uptake of Ca2+, eventually exceeding the storage capacity of the cell (mitochondria and ER) resulting in increased cytoplasmic Ca2+ concentrations. Sustained increases in cytoplasmic Ca2+ concentration induces degradative processes in the cell causing further membrane damage [Citation21], accelerating the Ca2+ influx. Free cytosolic calcium is known to signal apoptosis through mitochondria-caspase pathway. Apoptosis is associated with membrane blebbing which increases tissue tortuosity and restricts diffusion despite edema. We believe this supports the decrease in ADC (see ) at 400 V (2 hours and 24 hours).
Discussion
We have used DW-MRI to measure changes in the micro-scale diffusion environment of histologically validated, non-permeabilized (0 V), transiently (100 V, 200 V) and permanently permeabilized (400 V) brain tissue. In addition to the ADC, we have evaluated the eligibility of the kurtosis as a response parameter of tissue permeabilization. Results indicate that DW-MRI is capable of detecting permeabilized brain tissue and at particular time points to differentiate between the permeabilization states NP, TMP and PMP in tissue. We also demonstrated that the kurtosis and the ADC provide complimentary information. The ex vivo tests showed that the main induced effects in permeabilized tissue are edema (100 V, 200 V, 400 V) and cell shrinkage, membrane blebbing and membrane disintegration (400 V).
Other studies have addressed non-invasive assessment of EP, for example by using electrical impedance tomography [Citation22,Citation23], MRI and CT techniques [Citation24–26]. Our study is the first in which quantitative MRI has been used to detect EP-induced membrane permeabilization in vivo at different voltage levels and different time points. The use of the DW-MRI metrics ADC and kurtosis in combination, has to the best of our knowledge, not been reported before.
A basic condition in this study is heterogeneity of the brain tissue (neurons, glial cells, extracellular matrix etc.) which may blur the threshold level for TMP and PMP of the tissue. This means that at any given voltage level tissue reactions corresponding to both NP, TMP and PMP may be present. This was in fact seen in the histological samples and also indicated in other ex vivo data, where a continuous dose response was seen rather than a dichotomized response. Heterogeneity of the electric field distribution (see ) further complicates the predictability. The use of direct techniques, such as electron microscopy, may improve identification of tissue states.
The contribution from tissue perfusion is believed to be minor since the volume fraction of water in the capillaries is small in normal brain tissue [Citation27], and may constitute only a few percent of the total signal at b = 150 s/mm2, and less at higher b-values [Citation28]. A vascular effect of EP, consisting of an initial constricting effect on afferent arterioles and a subsequent effect due to cell swelling causing compromised flow in tissues has been described [Citation29]. Whereas the perfusion restriction due to the reflexive constriction of the afferent arterioles, as suggested by in vivo study of muscle tissue [Citation29], is brief and not likely to show on DW-MRI measurements, the indirect effect due to tissue swelling [Citation29] may play a more important role.
The exposure of biological tissue to electric fields increases local temperature (Joule heating). At prolonged exposures above 42°C denaturation of proteins begin, and when the temperature is elevated above 50–60°C even short exposures increase the rate of tissue (including membrane) damage dramatically [Citation30]. Our calculation of Joule heating showed that the temperature rise may induce denaturation in ∼0.4% of the tissue when 100 V is applied, increasing to ∼2.7% and ∼12.5%, respectively, when 200 V and 400 V are applied. Since the ADC and the kurtosis were calculated using regions of interest between electrodes (see ), and not too close to the electrode surface, we believe that the Joule heating effect may be reflected little in the DW-MRI data.
In conclusion, this study shows that DW-MRI can be used to detect and characterize cellular membrane permeabilization of brain tissue in an experimental model in the rat. The results suggest that DW-MRI may be a useful tool in a future clinical setting for quick and easy verification of EP-based treatments. Our data indicate that one DW-MRI scan right after treatment (5 minutes) and one 24 hours after treatment may identify non-, transiently and permanently permeabilized brain tissues, respectively. Further preclinical investigation is however warranted, including studies with larger animals, larger regions of interest and cancer models. In particular, we believe that the use of more sophisticated DW-MRI sequences and model-based analyses of data could provide better assessment of membrane permeabilization.
Acknowledgments
We thank Marianne Fregil, Hospital Herlev, University of Copenhagen, for skillful laboratory assistance. Vibeke Uhre, Aarhus University, is acknowledged for help with ion content measurements in tissue biopsies. This work was funded by the Danish National Advanced Technology Foundation and Region Hovedstadens Forskningsfond. The corresponding author Julie Gehl was a Royal Swedish Academy of Sciences Research Fellow supported by a grant from the Acta Oncologica Foundation.
Declaration of interest: J. Gehl, F. Mahmood, and B. Agerholm-Larsen have patents granted or pending related to this work. The authors alone are responsible for the content and writing of the paper.
References
- Neumann E, Rosenheck K. Permeability changes induced by electric impulses in vesicular membranes. J Membr Biol 1972;10:279–90.
- Agerholm-Larsen B, Iversen HK, Ibsen P, Moller JM, Mahmood F, Jensen KS, et al. Preclinical validation of electrochemotherapy as an effective treatment for brain tumors. Cancer Res 2011;71:3753–62.
- Electrochemotherapy as a palliative treatment for brain metastases: Clinicaltrials.gov Web site. Available from: http://www.clinicaltrials.gov. ClinicalTrials.gov Identifier: NCT01322100. [Updated 2011 Apr 26].
- Lindner P, Neumann E, Rosenheck K. Kinetics of permeability changes induced by electric field impulses in chromatin granules. J Membr Biol 1977;32:231–54.
- Orlowski S, Belehradek J Jr, Paoletti C, Mir LM. Transient electropermeabilization of cells in culture: Increase of the cytotoxicity of anticancer drugs. Biochem Pharmacol 1988;37:4727–33.
- Gehl J, Skovsgaard T, Mir LM. Enhancement of cytotoxicity by electropermeabilization: An improved method for screening drugs. Anticancer Drugs 1998;9:319–25.
- Rubinsky B. Irreversible electroporation in medicine. Technol Cancer Res Treat 2007;6:255–60.
- Garcia PA, Rossmeisl JH, Neal RE, Ellis TL, Olson JD, Henao-Guerrero N, et al. Intracranial nonthermal irreversible electroporation: In vivo analysis. J Membr Biol 2010;236:127–36.
- Neumann E. Electric field-induced structural rearrangements in the biomembranes. Studia Biophys 1989;130:139–43.
- Gabriel B, Teissie J. Generation of reactive-oxygen species induced by electropermeabilization of chinese hamster ovary cells and their consequence on cell viability. Eur J Biochem 1994;223:25–33.
- Kinosita K Jr,, Tsong TY. Formation and resealing of pores of controlled sizes in human erytrocyte membrane. Nature 1977;268:438–41.
- Kerr JF, Wyllie AH, Currie AR. Apoptosis: A basic biological phenomenon with wide-ranging implications in tissue kinetics. Br J Cancer 1972;26:239–57.
- Fackler OT, Grosse R, Cell motility through plasma membrane blebbing. J Cell Biol 2008;181:879–84.
- Sale AJH, Hamilton WA. Effects of high electric fields on microorganisms. III. lysis of erythrocytes and protoplasts. Biochim Biophys Acta 1968;163:37–43.
- Callaghan PT. Principles of nuclear magnetic resonance microscopy. Oxford: Oxford University Press; 1991.
- Raab P, Hattingen E, Franz K, Zanella FE, Lanfermann H. Cerebral gliomas: Diffusional kurtosis imaging analysis of microstructural differences. Radiology 2010;254:876–81.
- Jensen JH, Helpern JA, Ramani A, Lu H, Kaczynski K. Diffusional kurtosis imaging: The quantification of non-gaussian water diffusion by means of magnetic resonance imaging. Magn Reson Imaging 2005;53:1432–40.
- Hannig J, Lee RC. Structural changes in cell membranes after ionising electromagnetic field exposure. IEEE Trans Plas Sci 2000;28:97–101.
- Patlak CS, Hospod FE, Trowbridge SD, Newman, GC. Diffusion of radiotracers in normal and ischemic brain slices. J Cereb Blood Flow Metab 1998;18:776–802.
- Gehl J, Sorensen TH, Nielsen K, Raskmark P, Nielsen SL, Skovsgaard T, et al. In vivo electroporation of skeletal muscle: Threshold, efficacy and relation to electric field distribution. Biochim Biophys Acta 1999;1428:233–40.
- Gissel H. Ca2 + accumulation and cell damage in skeletal muscle during low frequency stimulation. J Comp Neurol 2000;279:R917–24.
- Granot Y, Ivorra A, Maor E, Rubinsky B. In vivo imaging of irreversible electroporation by means of electrical impedance tomography. Phys Med Biol 2009;54:4927–43.
- Ivorra A, Al-Sakere B, Rubinsky B, Mir LM. In vivo electrical conductivity measurements during and after tumor electroporation: Conductivity changes reflect the treatment outcome. Phys Med Biol 2009;54:5949–63.
- Mahmood F, Hansen RH, Agerholm-Larsen B, Jensen KS, Iversen HK, Gehl J. Diffusion-weighted MRI for verification of electroporation-based treatments. J Membr Biol 2011;240:131–8.
- Schoellnast H, Monette S, Ezell PC, Deodhar A, Maybody M, Erinjeri JP, et al. Acute and subacute effects of irreversible electroporation on nerves: Experimental study in a pig model. Radiology 2011;260:421–7.
- Zhang Y, Guo Y, Ragin AB, Lewandowski RJ, Yang GY, Nijm GM, et al. MR imaging to assess immediate response to irreversible electroporation for targeted ablation of liver tissues: Preclinical feasibility studies in a rodent model. Radiology 2010;256:424–32.
- Jensen JH, Helpern JA. MRI quantification of non-gaussian water diffusion by kurtosis. NMR Biomed 2010;23: 698–710.
- Le Bihan D, Breton E, Lallemand D, Aubin M-L, Vignaud J, Laval-Jeantet M. Separation of diffusion and perfusion in intravoxel incoherent motion MR imaging. Radiology 1988;168:497–505.
- Gehl J, Skovsgaard T, Mir LM. Vascular reactions to in vivo electroporation: Characterization and consequences for drug and gene delivery. Biochim Biophys Acta 2002;1569:51–8.
- Davalos RV, Rubinsky B, Mir LM. Theoretical analysis of the thermal effects during in vivo tissue electroporation. Bioelectrochemistry 2003;61:99–107.