
Abstract
Background. The efficacy of focal continuous low dose-rate brachytherapy (CLDR-BT) for prostate cancer requires that appropriate margins are applied to ensure robust target coverage. In this study we propose a method to establish such margins by emulating a focal treatment in patients treated with CLDR-BT to the entire gland.
Material and methods. In 15 patients with localized prostate cancer, prostate volumes and dominant intra-prostatic lesions were delineated on pre-treatment magnetic resonance imaging (MRI). Delineations and MRI were registered to trans-rectal ultrasound images in the operating theater. The patients received CLDR-BT treatment to the total prostate volume. The implantation consisted of two parts: an experimental focal plan covering the dominant intra-prostatic lesion (F-GTV), followed by a plan containing additional seeds to achieve entire prostate coverage. Isodose surfaces were reconstructed using follow-up computed tomography (CT). The focal dose was emulated by reconstructing seeds from the focal plan only. The distance to agreement between planned and delivered isodose surfaces and F-GTV coverage was determined to calculate the margin required for robust treatment.
Results. If patients had been treated only focally, the target volume would have been reduced from an average of 40.9 cm3 for the entire prostate to 5.8 cm3 for the focal plan. The D90 for the F-GTV in the focal plan was 195 ± 60 Gy, the V100 was 94% [range 71–100%]. The maximum distance (cd95) between the planned and delivered isodose contours was 0.48 cm.
Conclusions. This study provides an estimate of 0.5 cm for the margin required for robust coverage of a focal target volume prior to actually implementing a focal treatment protocol.
For patients with low-risk prostate cancer, continuous low dose rate brachytherapy (CLDR-BT) of the prostate gland is a common treatment option. This treatment often represents a significant procedure with long lasting impact on health-related quality of life (HRQOL) [Citation1]. Based on the hypothesis that small lesions with low Gleason score are likely to remain indolent and have no effect on longevity [Citation2], a treatment strategy with less toxicity is attractive as alternative to CDLR-BT or active surveillance [Citation3,Citation4]. One potential treatment modality is focal CLDR-BT to eradicate the known dominant intra-prostatic lesion (DIL) while preserving uninvolved prostatic tissue and reducing dose to nearby organs at risk (OAR), such as rectum and bladder neck. Langley et al. [Citation5] have introduced the concepts of a focal gross target volume (F-GTV), focal target extended with clinical insignificant disease (F-CTV) and an expanded treatment area which compensates for uncertainties in image registration and treatment delivery (F-PTV). In that work, however, no estimate for the necessary F-PTV expansion, or method to obtain one, was given.
The aim of our study is therefore to quantify the necessary F-PTV expansion to ensure robust dose coverage to a focal delineation. This study does not aim to quantify the errors that are the result of delineation uncertainty and estimation of microscopic disease spread (F-CTV).
To achieve our aim, we propose a method to study the targeting uncertainty of focal therapy and establish the margins required for focal coverage of the F-GTV in patients treated with CLDR-BT to the entire gland. In these patients, we reconstructed a pre-defined selection of the delivered dose to emulate a focal treatment. We quantified the errors in the treatment delivery by comparing the planned with delivered isodose contours. Based on the reported seed displacements [Citation6,Citation7], we investigated the hypothesis that a margin of 0.5 cm around the tumor is sufficient to ensure adequate target coverage.
Material and methods
Patient inclusion
Fifteen patients with localized prostate cancer received CLDR-BT with I-125 seeds, covering the total prostate volume. Only patients with a clearly distinguished DIL as defined on magnetic resonance imaging (MRI) were included. Patients with prior treatment to the prostate were excluded.
Imaging, planning and implant delivery
Patients received a multi-parametric MRI exam prior to BT (MRI-pre) on a 3T Philips Achieva MRI scanner (Philips, Best, The Netherlands), using a combination of a phased array and an endorectal coil. The exam consisted of an axial, sagittal and coronal T2-weighted Turbo-Spin-Echo (TSE) sequence with echo time TE = 120 ms, repetition time TR = 8800 ms, slice thickness 3 mm, a diffusion-weighted scan (single-shot echo planar imaging, b-values 0, 188, 375, 563 and 750 s/mm2) and dynamic contrast enhanced (DCE) MRI (spoiled gradient echo TR/TE 4/1 ms, flip angle 13°, 120 time points at 2.5 s time resolution. A concentration of 0.1 ml/kg of Dotarem (Guerbet, Villepinte, France) was injected at 3 ml/s, followed by a saline flush.
An apparent diffusion coefficient (ADC) map was calculated from the diffusion-weighted MR images. From the DCE-MRI data a Ktrans map was calculated using the Tofts model [Citation8].
All images were co-registered and an F-GTV was defined in our home-made delineation software (Worldmatch) on the axial T2-weighted images, using information from all other available images [Citation9]. The F-GTV was expanded up to 0.5 cm in all directions, unless this expansion would reach outside the prostate volume, resulting in the F-PTV.
Source Tech Medical model STM1251 125I low dose rate BT seeds were implanted under trans-rectal ultrasound (TRUS) guidance, following the guidelines of the ESTRO/EAU/EORTC [Citation10]. The source strength of the seeds was 0.57–0.59 μGy m²/h. The pre-plan TRUS was performed in the same session as the implant procedure, and consisted of 60–80 transversal 1 mm slices. Seed implantation was performed under general anesthesia, with a urethral catheter in place.
The pre-MRI (with F-GTV and F-PTV delineations) was registered to the TRUS image by a manual rigid body registration method. On the TRUS image, the prostate volume and OAR were delineated.
To emulate focal BT while in fact treating the entire prostate according to the regular clinical protocol, a pseudo-focal planning strategy was followed. First, a focal plan was designed with a planning aim for the F-PTV of D90 ≥ 167 Gy (115% of 145 Gy) with V100 ≥ 95%. This plan was then supplemented with additional seeds until a ‘total plan’ with a conventional dose distribution was obtained that satisfied the planning aim for the total prostate volume of D90 ≥ 167 Gy (115% of 145 Gy) with V100 ≥ 95%. The dose to the rectum, the bladder neck and the urethra was verified. The dose constraint to the rectum was D2cc ≤ 116 Gy, to the urethra D10% ≤ 217.5 Gy. To the bladder neck, we applied a constraint D0.5cc ≤ 175 Gy, based on the study by Steggerda et al. [Citation11]. If required to satisfy these dose constraints, the dose in the focal plan was reduced. Therefore, the D90 and V100 for the F-PTV in the focal plan were lower than the planning aims in a few cases.
Planning was performed using the VariSeed system V8.02 (Varian Medical Systems, Palo Alto, CA, USA). As a seed delivery method, we applied manually loaded needles containing connected seeds and spacers of variable length (ProLink, Bard Brachytherapy Inc. Carol Stream, IL, USA). Each needle's loading configuration was assembled in the OR based on the dose planning optimization.
The focal and total plans were implanted under US guidance. First, the focal plan was implanted, without real-time corrections. After that, the rest of the plan was implanted to achieve a regular treatment of the entire prostate. At this stage, real-time addition of seeds and correction of the seed locations and resulting dose distributions were possible to avoid local underdosing of the prostate volume.
Evaluation of dose coverage
Patients received an MRI and computed tomography (CT) examination 4–6 weeks after treatment to determine the location of the BT seeds relative to the target. The MRI exam was acquired only with a phased-array surface coil and contained the three orthogonal T2-weighted sequences described above. As a result of the manual needle and seed loading approach for the implant, each needle loading was reasonably unique and remained visible as a strand of seeds, allowing for straightforward identification on post-treatment CT dosimetry images (see ). The totality of seeds was used to reconstruct the dose of the total plan. Seeds originating from the focal plan were identified separately to reconstruct the dose distribution of the focal plan.
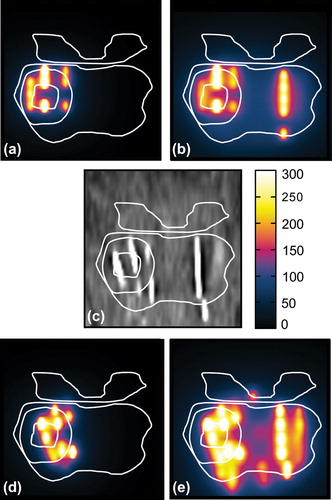
The planned dose distributions generated in VariSeed from the focal and total plan (Supplementary Figure 1e and f, available online at http://informahealthcare.com/doi/abs/10.3109/0284186X.2014.995312) were registered to the pre-MRI images (Supplementary Figure 1a) by applying the inverse of the transformation used in the OR to register the pre-MRI to the TRUS images (Supplementary Figure 1b). The post-treatment reconstructed (delivered) dose distributions were registered to the pre-MRI data in two steps. First, the post-CT with dose distributions (Supplementary Figure 1d, g and h) was registered to the post-MRI (Supplementary Figure 1c), then the post-MRI was registered to the pre-MRI acquisition. All registrations were performed using a rigid body (six degrees of freedom) transformation optimizing either with a cross- correlation (for MRI-MRI registration) or mutual information (for CT-MRI) cost function. The registrations were performed using in-house developed software, and the extent of residual mismatch was assessed by measuring the distance between landmarks (i.e. seeds, urethra and calcifications).
First, we evaluated the coverage of the F-GTV by the delivered focal 145 Gy isodose based on the focal plan with a 0.5 cm margin (F-PTV). Second, the delivered focal isodose surface was compared to planned focal isodose surface (at 145 Gy). To achieve this, it was necessary to measure the distance between 1) delivered focal 145 Gy isodose surface and F-GTV and 2) delivered and planned focal 145 Gy isodose surface. We defined coverage to be robust when 95% of the reference surface (F-GTV or planned 145 Gy isodose surface) is contained within the delivered focal 145 Gy isodose surface. The (expansion or contraction) margin necessary for robust coverage can be found by determining the signed point-to-surface distances for all vertices between two surfaces [Citation12]. Positive distances correspond to an expansion of the delivered isodose surface to cover the reference surface, and vice versa (Supplementary Figure 2, available online at http://informahealthcare.com/doi/abs/10.3109/0284186X.2014.995312). The 95 percentile in this distribution of point-to-surface distances reflects the expansion needed for at least 95% coverage of the reference surface by the delivered 145 Gy isodose surface (). We will call this the 95% coverage distance (cd95).
Dose volume histogram (DVH) values for the target volumes were determined for the focal and total planned and delivered dose distributions.
Results
Plan characteristics of all plans are listed in Supplementary Table I (available online at http://informahealthcare.com/doi/abs/10.3109/0284186X.2014.995312). If the patients had been treated only focally, the target volume would have been reduced from an average of 40.9 cm3 for the entire prostate to 5.8 cm3 for the F-PTV. Subsequently, the average number of needles decreased from 17.5 for the entire prostate to 6.2 for the focal plan and the number of seeds from 63.3 to 16.9.
A single slice of each imaging modality and reconstructed doses is shown in Supplementary Figure 1 available online at http://informahealthcare.com/doi/abs/10.3109/0284186X.2014.995312. The delineations used during the implant procedure are propagated to all other images. In 11 of 15 patients landmarks, such as calcifications and cysts, could be identified on pre-MRI, TRUS imaging and post-treatment MRI. The mean distance between these landmarks was 0.24 cm with a standard deviation of 0.14 cm.
DVH statistics of the target volumes F-GTV, F-PTV and total prostate volume were calculated, and the planned and delivered doses compared (). For the F-GTV the D90 of the focal plan was 198 ± 44 Gy, the focal delivered D90 was 195 ± 60 Gy. The V100 of the F-GTV was 97% [range 89–100%] for the focal plan resulting in a delivered V100 of 94% [range 71–100%]. Detailed results for coverage of the target volumes and the dose to OARs are listed in Supplementary Tables II and III (available online at http://informahealthcare.com/doi/abs/10.3109/0284186X.2014.995312).
For each patient, the cd95 from the delivered focal 145 Gy isodose to: 1) the F-GTV; and 2) planned isodose contour was determined ( top and bottom, respectively). For four of 15 patients, the delivered dose was insufficient: the 145 Gy isodose contour did not fully cover the F-GTV. These cases were investigated further (). All these cases featured laterally located lesions. In this study, the F-GTV was not expanded beyond the prostate volume, in order to achieve dose distributions to the total prostate volume that are in line with our current standard of care.
Underdosage was observed in the directions that were not fully expanded. In addition, for three of the four cases, the planned D90 to the F-GTV was below 145 Gy, due to planning constraints of the total implant, and thus complete F-GTV coverage was not expected from the outset.
The maximum distance (cd95) between the planned and delivered isodose contours was 0.48 cm. For both distance comparisons, no significant correlation between the size of the target surface and cd95 was observed.
Discussion
In this study we propose a method to establish a realistic F-PTV expansion margin for robust focal BT in localized prostate cancer. In a group of low-risk prostate cancer patients treated with low dose rate BT to the total prostate volume, we reconstructed a pre-defined selection of the delivered dose emulating a focal treatment. This pseudo-focal approach allows for investigation of the margin necessary for dose coverage in focal treatment strategies, while still delivering the conventional total prostate BT treatment. This approach thus allows us to find such a margin without risk to the patient.
In our patients, the mean delivered D90 dose to the total prostate volume was 152 Gy (, Supplementary Table II to be found online at http://informahealthcare.com/doi/abs/10.3109/0284186X.2014.995312). This is less than the planned 176 Gy, and constitutes a D90 decline of almost 14%. This is in line with results found earlier [Citation13] and by other groups [Citation14]. V100 statistics show a similar result with a mean planned and delivered V100 of 97% and 90% of the prostate volume. It is important to note that these DVH statistics are based on registration of the planned/delivered doses to the same image space and using the same delineations. In clinical practice, the targets and OAR delineation are repeated on the new images, avoiding registration errors.
The F-GTV was covered sufficiently in 11 of 15 patients, with application of a 0.5 cm margin for the focal plan (). In four cases, peripherally located F-GTVs were not expanded the full 0.5 cm for the construction of the F-PTV. Even though our planning aim was to achieve a D90 of 115% of 145 Gy to the F-PTV, this resulted in an insufficient coverage of the F-GTV in these cases. An isotropic PTV expansion can result in significant dose outside the prostate volume, and might directly cover OAR such as the rectum, depending on the location of the DIL.
In the clinical routine of an implant of the entire prostate, the seeds are placed in an interactive process which takes into account the deformation of the prostate due to swelling, needle insertion and other clinical reasons, using intra-operative ultrasound imaging. This is an important benefit of CLDR-BT and increases the robustness of the method [Citation15]. It is therefore standard practice to compare the prescribed dose as defined directly after the implant has been done, with the delivered dose as evaluated after 4–6 weeks. For treatment of a tumor focus, this is however much harder as the conspicuity of the tumor on intra-operative ultrasound imaging is poor. While the prostate contour is seen, we need to rely on the registration of the ultrasound images with the pre-MRI to localize the F-GTV and F-PTV. This registration step has influence on the overall accuracy of the treatment. For this reason, we have chosen to compare the planned rather than the prescribed dose to the delivered dose.
The cd95 from the delivered to the planned isodose contours was 0.48 cm, very close to our initial estimate of 0.5 cm. While it was expected that larger lesions (requiring more BT seeds) would be more robust for seed placement uncertainties [Citation16], we found no significant correlation between the target volume and cd95 for tumor volumes between 5 and 21 cm3. We conclude that robust target coverage with CLDR-BT can be obtained using an isotropic margin of 0.5 cm.
There are several factors that could influence the margin that was determined in this study. These factors include systematic (Type B) uncertainties, such as contouring, seed reconstruction and registration between the MRI-pre and the TRUS [Citation17].
The GEC-ESTRO working groups BRAPHYQS (BRAchytherapy PHYsics Quality assurance System) and PROBATE (PROstate BrAchyThErapy Group) investigated in a multi-center setting how the inter observer variability in contouring, seed reconstruction and image fusion affects the accuracy of the calculated dose distribution for BT of the entire prostate gland [Citation18]. The inter-observer variability in target delineation showed a mean standard deviation in volume of 23% for contours delineated on CT and 17% for T2-weighted MRI. This study, however, did not address the delineation of the tumors inside the prostate gland. While several other studies addressed the inter-observer agreement of tumor detection [Citation19,Citation20], the inter-observer agreement in delineation of the prostate tumor inside the gland has hardly been studied. To our knowledge, no distances between tumor contours from different observers have been reported.
The accuracy of seed reconstruction was investigated in a prostate phantom by De Brabandere et al. [Citation21]. A mean magnitude of deviation of the reconstructed seed positions on CT scans with 3 mm slice thickness of 0.8 ± 0.6 mm was found. Siebert et al. [Citation22] showed that a slice spacing larger than 3 mm would result in an increase in displacements in the z-direction. The robustness of a LDR plan might also depend on the seeds’ apparent activity; in our study we applied seeds with a source strength of 0.57 μGy m²/h. This is in the middle of the range offered by the manufacturer which spans 0.24–1.82 μGy m²/h.
To establish the margin, in our study three imaging modalities were co-registered (Supplementary Figure 1 to be found online at http://informahealthcare.com/doi/abs/10.3109/0284186X.2014.995312). The spatial mismatch between the doses can be partially explained by registration inaccuracy, rather than the implant quality itself. In our study, we registered T2-weighted MRI on CT in variseed. We found a mean registration error of 0.24 cm based on distances between landmarks. De Brabandere et al. found for this approach a variation in D90 of 16% [Citation18]. Assuming that registration errors are independent from the needle and seed placement errors, they contribute quadratically to the total error (i.e. the margin of 0.48 cm). Correcting for registration errors (0.24 cm), the remaining margin is 0.42 cm.
There is no standard method to calculate margin recipes for use in CLDR-BT. The proposed 95 percentile coverage criterion is somewhat arbitrary. In BT, the dose gradients are different from a typical external-beam radiotherapy treatment. Also, a higher inhomogeneity of the dose is realized, leading to substantially higher biologically effective dose levels. Thus, traditional margin concepts from external-beam radiotherapy are not directly applicable.
Other studies investigating the accuracy of BT seed placement have found similar results to ours. A recent study by Mason et al. [Citation23], while looking at focal boosting using high dose rate (HDR) BT, covers the systematic uncertainties in delineation and registration from MRI to TRUS results in more detail. They report an effective F-PTV expansion of 0.45 cm in order to compensate for these uncertainties. The uncertainties for CLDR-BT and HDR are described in detail by Kirisits et al. [Citation17]. Roberson et al. looked at the displacement of BT seeds or strands of seeds and reported displacements of about 0.46 cm perpendicular to the needle direction [Citation6]. The use of extra stabilization needles did not reduce the uncertainty of seed placement [Citation24]. In a study that tracked needle trajectories along several imaging modalities, Lobo et al. [Citation7] found an average seed displacement of 0.49 cm during and another 0.3 cm after implantation. Note that in our study the delivered dose was determined based on scans acquired six weeks after treatment, taking into account the swelling and shrinking of the prostate during and after treatment. While individual seed displacements do not directly correspond to isodose margins, we note that these distances are in the same order as our results.
Currently, there is one study by Cosset et al. investigating focal LDR BT in a group of low-risk prostate cancer patients [Citation25], reporting excellent toxicity scores and showing the feasibility of focal planning and implants. Our study focuses on a method to assess the uncertainty of the BT treatment after delineation and planning. As a result, the definition of the focal target volumes differs significantly (i.e. 34% vs. 14% of the total prostate volume). The study by Cosset applies a ‘rather large safety margin’, presumably to account for invisible tumor infiltration as well as uncertainties in delineation and delivery. With better estimates of clinical target definitions combined with the uncertainty of treatment delivery as described in this study, it becomes possible to determine a more considered margin for focal prostate cancer treatment.
In conclusion, we proposed a method to establish margins to ensure robust target coverage in focal CLDR-BT. This was achieved by emulating a focal treatment in patients treated to the entire gland. This approach thus allowed us to determine such a margin without risk to the patient. In 11 of 15 patients, a margin of 0.5 cm was sufficient to cover the F-GTV. In cases where full coverage was not achieved, this was due to non-uniform expansion of the focal target volume. Comparing the delivered with the planned 145 Gy isodose surfaces, a uniform margin of 0.5 cm was necessary to cover 95% of the delineated F-GTV for all patients.
Supplementary material available online
Supplementary Tables I–III to be found online at http://informahealthcare.com/doi/abs/10.3109/0284186X.2014.995312
ionc_a_995312_sm7126.pdf
Download PDF (672.2 KB)Acknowledgments
The authors would like to acknowledge Dr. Kari Tanderup (Aarhus University, Denmark) for reading and discussing the manuscript. Parts of the data in this study were previously presented at the ESTRO-FORUM conference in Geneva 2013 (abstract # OC-0366).
Declaration of interest: The authors report no conflicts of interest. The authors alone are responsible for the content and writing of the paper.
References
- Mohammed N, Kestin L, Ghilezan M, Krauss D, Vicini F, Brabbins D, et al. Comparison of acute and late toxicities for three modern high-dose radiation treatment techniques for localized prostate cancer. Int J Radiat Oncol 2012;82: 204–12.
- Ahmed HU, Arya M, Freeman A, Emberton M. Do low-grade and low-volume prostate cancers bear the hallmarks of malignancy? Lancet Oncol 2012;13:e509–17.
- De la Rosette J, Ahmed H, Barentsz J, Johansen TB, Brausi M, Emberton M, et al. Focal therapy in prostate cancer—report from a consensus panel. J Endourol 2010;24:775–80.
- Eggener S, Salomon G, Scardino PT, De la Rosette J, Polascik TJ, Brewster S. Focal therapy for prostate cancer: Possibilities and limitations. Eur Urol 2010;58:57–64.
- Langley S, Ahmed HU, Al-Qaisieh B, Bostwick D, Dickinson L, Veiga FG, et al. Report of a consensus meeting on focal low dose rate brachytherapy for prostate cancer. Br J Urol Int 2012;109:7–16.
- Roberson PL, Narayana V, McShan DL, Winfield RJ, McLaughlin PW. Source placement error for permanent implant of the prostate. Med Phys 1997;24:251–7.
- Lobo JR, Moradi M, Chng N, Dehghan E, Morris WJ, Fichtinger G, et al. Use of needle track detection to quantify the displacement of stranded seeds following prostate brachytherapy. IEEE Trans Med Imaging 2012;31:738–48.
- Tofts PS, Brix G, Buckley DL, Evelhoch JL, Henderson E, Knopp MV et al. Estimating kinetic parameters from dynamic contrast-enhanced T(1)-weighted MRI of a diffusable tracer: Standardized quantities and symbols. J Magn Reson Imaging 1999;10:223–32
- Van der Heide UA, Houweling AC, Groenendaal G, Beets-Tan RGH, Lambin P. Functional MRI for radiotherapy dose painting. Magn Reson Imaging 2012;30:1216–23.
- Salembier C, Lavagnini P, Nickers P, Mangili P, Rijnders A, Polo A, et al. Tumour and target volumes in permanent prostate brachytherapy: A supplement to the ESTRO/EAU/EORTC recommendations on prostate brachytherapy. Radiother Oncol 2007;83:3–10.
- Steggerda MJ1, Witteveen T, van den Boom F, Moonen LM. Is there a relation between the radiation dose to the different sub-segments of the lower urinary tract and urinary morbidity after brachytherapy of the prostate with I-125 seeds? Radiother Oncol 2013;109:251–5.
- Rao M, Stough J, Chi Y-Y, Muller K, Tracton G, Pizer SM, et al. Comparison of human and automatic segmentations of kidneys from CT images. Int J Radiat Oncol Biol Phys 2005;61:954–60.
- Steggerda MJ, van der Poel HG, Moonen LMF. Minimizing the number of implantation needles for prostate 125I brachytherapy: An investigation of possibilities and implications. Brachytherapy 2010;9:319–27.
- Moerland MA, van Deursen MJH, Elias SG, van Vulpen M, Jürgenliemk-Schulz IM, Battermann JJ. Decline of dose coverage between intraoperative planning and post implant dosimetry for I-125 permanent prostate brachytherapy: Comparison between loose and stranded seed implants. Radiother Oncol 2009;91:202–6.
- Polo A, Salembier C, Venselaar J, Hoskin P. Review of intraoperative imaging and planning techniques in permanent seed prostate brachytherapy. Radiother Oncol 2010;94:12–23.
- Su Y, Davis BJ, Furutani KM, Herman MG, Robb RA. Dosimetry accuracy as a function of seed localization uncertainty in permanent prostate brachytherapy: Increased seed number correlates with less variability in prostate dosimetry. Phys Med Biol 2007;52:3105–19.
- Kirisits C, Rivard MJ, Baltas D, Ballester F, De Brabandere M, van der Laarse R, et al. Review of clinical brachytherapy uncertainties: Analysis guidelines of GEC-ESTRO and the AAPM. Radiother Oncol 2014;110:199–212.
- De Brabandere M, Hoskin P, Haustermans K, Van den Heuvel F, Siebert FA. Prostate post-implant dosimetry: Interobserver variability in seed localisation, contouring and fusion. Radiother Oncol 2012;104:192–8.
- Bratan F, Niaf E, Melodelima C, Chesnais AL, Souchon R, Mège-Lechevallier F, et al. Influence of imaging and histological factors on prostate cancer detection and localisation on multiparametric MRI: A prospective study. Eur Radiol 2013;23:2019–29.
- Rischke HC, Nestle U, Fechter T, Doll C, Volegova-Neher N, Henne K, et al. 3 Tesla multiparametric MRI for GTV- definition of dominant intraprostatic lesions in patients with prostate cancer–an interobserver variability study. Radiat Oncol 2013;8:183.
- De Brabandere M, Kirisits C, Peeters R, Haustermans K, Van den Heuvel F. Accuracy of seed reconstruction in prostate postplanning studied with a CT- and MRI-compatible phantom. Radiother Oncol 2006;79:190–7.
- Siebert FA, De Brabandere M, Kirisits C, Kovács G, Venselaar J. Phantom investigations on CT seed imaging for interstitial brachytherapy. Radiother Oncol 2007;85:316–23
- Mason J, Al-Qaisieh B, Bownes P, Wilson D, Buckley DL, Thwaites D, et al. Multi-parametric MRI-guided focal tumor boost using HDR prostate brachytherapy: A feasibility study. Brachytherapy 2014;13:137–45.
- Taschereau R, Pouliot J, Roy J, Tremblay D. Seed mis- placement and stabilizing needles in transperineal permanent prostate implants. Radiother Oncol 2000;55: 59–63.
- Cosset J-M, Cathelineau X, Wakil G, Pierrat N, Quenzer O, Prapotnich D et al. Focal brachytherapy for selected low-risk prostate cancers: A pilot study. Brachytherapy 2013;12: 331–7.